Wednesday, March 30, 2022

UNLIKE TRUMP RALLIES

Research Shows NFL Stadium Openings in 2020 Had No Impact on Local COVID-19 Infections

NFL Football Stadium

The findings may inform decisions on holding large outdoor gatherings amid future public health crises.

As with most everything in the world, football looked very different in 2020. As the Covid-19 pandemic unfolded, many National Football League (NFL) games were played in empty stadiums, while other stadiums opened to fans at significantly reduced capacity, with strict safety protocols in place.

At the time it was unclear what impact such large sporting events would have on Covid-19 case counts, particularly at a time when vaccination against the virus was not widely available.

Now, MIT engineers have taken a look back at the NFL’s 2020 regular season and found that for this specific period during the pandemic, opening stadiums to fans while requiring face coverings, social distancing, and other measures had no impact on the number of Covid-19 infections in those stadiums’ local counties.

As they write in a new paper published in the Proceedings of the National Academy of Sciences, “the benefits of providing a tightly controlled outdoor spectating environment — including masking and distancing requirements — counterbalanced the risks associated with opening.”

NFL Stadium Openings Impact COVID

An MIT study finds NFL stadium openings had no impact on local Covid-19 infections during the 2020 season. Credit: Jose-Luis Olivares, MIT

The study concentrates on the NFL’s 2020 regular season (September 2020 to early January 2021), at a time when earlier strains of the virus dominated, before the rise of more transmissible Delta and Omicron variants. Nevertheless, the results may inform decisions on whether and how to hold large outdoor gatherings in the face of future public health crises.

“These results show that the measures adopted by the NFL were effective in safely opening stadiums,” says study author Anette “Peko” Hosoi, the Neil and Jane Pappalardo Professor of Mechanical Engineering at MIT. “If case counts start to rise again, we know what to do: mask people, put them outside, and distance them from each other.”

The study’s co-authors are members of MIT’s Institue for Data, Systems, and Society (IDSS), and include Bernardo García Bulle, Dennis Shen, and Devavrat Shah, the Andrew and Erna Viterbi Professor in the Department of Electrical Engineering and Computer Science (EECS).

Preseason patterns

Last year a group led by the University of Southern Mississippi compared Covid-19 case counts in the counties of NFL stadiums that allowed fans in, versus those that did not. Their analysis showed that stadiums that opened to large numbers of fans led to “tangible increases” in the local county’s number of Covid-19 cases.

But there are a number of factors in addition to a stadium’s opening that can affect case counts, including local policies, mandates, and attitudes. As the MIT team writes, “it is not at all obvious that one can attribute the differences in case spikes to the stadiums given the enormous number of confounding factors.”

To truly isolate the effects of a stadium’s opening, one could imagine tracking Covid cases in a county with an open stadium through the 2020 season, then turning back the clock, closing the stadium, then tracking that same county’s Covid cases through the same season, all things being equal.

“That’s the perfect experiment, with the exception that you would need a time machine,” Hosoi says.

As it turns out, the next best thing is synthetic control — a statistical method that is used to determine the effect of an “intervention” (such as the opening of a stadium) compared with the exact same scenario without that intervention.

In synthetic control, researchers use a weighted combination of groups to construct a “synthetic” version of an actual  scenario. In this case, the actual scenario is a county such as Dallas that hosts an open stadium. A synthetic version would be a county that looks similar to Dallas, only without a stadium. In the context of this study, a county that “looks” like Dallas has a similar preseason pattern of Covid-19 cases.

To construct a synthetic Dallas, the researchers looked for surrounding counties without stadiums, that had similar Covid-19 trajectories leading up to the 2020 football season. They combined these counties in a way that best fit Dallas’ actual case trajectory. They then used data from the combined counties to calculate the number of Covid cases for this synthetic Dallas through the season, and compared these counts to the real Dallas.

The team carried out this analysis for every “stadium county.” They determined a county to be a stadium county if more than 10 percent of a stadium’s fans came from that county, which the researchers estimated based on attendance data provided by the NFL.

“Go outside”

Of the stadiums included in the study, 13 were closed through the regular season, while 16 opened with reduced capacity and multiple pandemic requirements in place, such as required masking, distanced seating, mobile ticketing, and enhanced cleaning protocols.

The researchers found the trajectory of infections in all stadium counties mirrored that of synthetic counties, showing that the number of infections would have been the same if the stadiums had remained closed. In other words, they found no evidence that NFL stadium openings led to any increase in local Covid case counts.

To check that their method wasn’t missing any case spikes, they tested it on a known superspreader: the Sturgis Motorcycle Rally, which was held in August of 2020. The analysis successfully picked up an increase in cases in Meade, the host county, compared to a synthetic counterpart, in the two weeks following the rally.

Surprisingly, the researchers found that several stadium counties’ case counts dipped slightly compared to their synthetic counterparts. In these counties — including Hamilton, Ohio, home of the Cincinnati Bengals — it appeared that opening the stadium to fans was tied to a dip in Covid-19 infections. Hosoi has a guess as to why:

“These are football communities with dedicated fans. Rather than stay home alone, those fans may have gone to a sports bar or hosted indoor football gatherings if the stadium had not opened,” Hosoi proposes. “Opening the stadium under those circumstances would have been beneficial to the community because it makes people go outside.”

The team’s analysis also revealed another connection: Counties with similar Covid trajectories also shared similar politics. To illustrate this point, the team mapped the county-wide temporal trajectories of Covid case counts in Ohio in 2020 and found them to be a strong predictor of the state’s 2020 electoral map.

“That is not a coincidence,” Hosoi notes. “It tells us that local political leanings determined the temporal trajectory of the pandemic.”

The team plans to apply their analysis to see how other factors may have influenced the pandemic.

“Covid is a different beast [today],” she says. “Omicron is more transmissive, and more of the population is vaccinated. It’s possible we’d find something different if we ran this analysis on the upcoming season, and I think we probably should try.”

Reference: “Public health implications of opening National Football League stadiums during the COVID-19 pandemic” by Bernardo García Bulle, Dennis Shen, Devavrat Shah and Anette E. Hosoi, 22 March 2022, Proceedings of the National Academy of Sciences.
DOI: 10.1073/pnas.2114226119
Power of Grassroots Innovation: How a Nondescript Box Has Been Saving Lives During the COVID Pandemic

Do-It-Yourself Air Purifier

A do-it-yourself air purifier in use in a classroom. Credit: Douglas Hannah, CC BY-ND

One afternoon, a dozen Arizona State University students gathered to spend the morning cutting cardboard, taping fans, and assembling filters in an effort to build 125 portable air purifiers for local schools. That same morning, staff members at a homeless shelter in Los Angeles were setting up 20 homemade purifiers of their own, while in Brookline, Massachusetts, another DIY air purifier was whirring quietly in the back of a daycare classroom as children played.

The technology in all three cases – an unassuming duct tape-and-cardboard construction known as a Corsi-Rosenthal box – is playing an important part in the fight against COVID-19. The story of how it came to be also reveals a lot about communities as sources of innovation and resilience in the face of disasters.

A simple technology with a big effect

As it became clear that COVID-19 was spread through airborne transmission, people started wearing masks and building managers rushed to upgrade their ventilation systems. This typically meant installing high-efficiency HEPA filters. These filters work by capturing virus-laden particles: Air is forced into a porous mat, contaminants are filtered out, and clean air passes through.

The efficacy of a building’s ventilation system is governed by two factors, though, not just the quality of the filters. The amount of air moved through the ventilation systems matters as well. Experts typically recommend five to six air changes per hour in shared spaces, meaning the entire volume of air in a room is replaced every 45 minutes. Systems in many older buildings can’t manage this volume, however.

Portable air filters are an option for augmenting ventilation systems, but they typically cost hundreds of dollars, which puts them out of range for schools and other public spaces that face budget constraints.

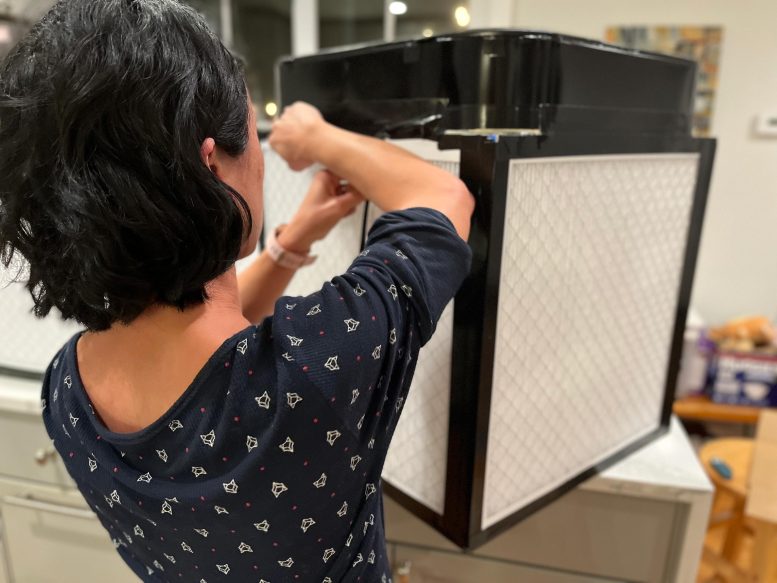
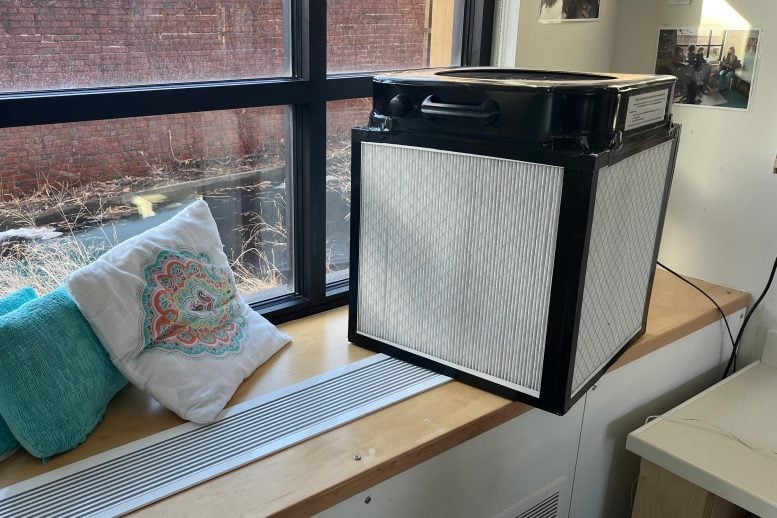
This is where the Corsi-Rosenthal box comes in. It’s a cube consisting of four to five off-the-shelf furnace filters topped by a standard box fan blowing outward. Once sealed together with tape, it can sit on a floor, shelf or table. The fan draws air through the sides of the cube and out the top. The units are simple, durable, and easy to make, and are more effective than simply placing a single filter in front of a box fan. It usually takes 40 minutes, minimal technical expertise, and US$60 to $90 in materials that are available from any home supply store.

Building a Corsi-Rosenthal Box Portable Air Filter

Building a Corsi-Rosenthal box portable air filter comes down to duct-taping together a set of furnace filters and a box fan. Credit: Douglas Hannah, CC BY-ND

Despite this simplicity, though, these homemade units are extremely effective. When used in a shared space like a classroom or hospital ward, they can supplement existing ventilation and remove airborne contaminants, including smoke and virus-laden particles. A raft of recent peer-reviewed research has found portable air purifiers can dramatically reduce aerosol transmission. Other preprint and under-review studies have found Corsi-Rosenthal boxes perform as well as professional units at a fraction of the cost.

Origins of the Corsi-Rosenthal box

The formal story of the Corsi-Rosenthal box began in August 2020, when Richard Corsi, an air quality expert and now dean at the University of California, Davis, pitched the idea of building cheap box-fan air filters on Twitter. Jim Rosenthal, the CEO of a Texas-based filter company, had been playing around with a similar idea and quickly built the first prototype.

Within days, tinkerers and air quality engineers alike were constructing their own Corsi-Rosenthal boxes and sharing the results on social media. A vibrant conversation emerged on Twitter, blending sophisticated technical analysis from engineers with the insight and efforts of nonspecialists.

By December, hundreds of people were making Corsi-Rosenthal boxes, and thousands more had read press coverage in outlets like Wired. In different corners of the world, people tweaked designs based on the availability of supplies and different needs. Their collective improvements and adaptations were documented by dedicated websites and blogs, as well as news reports.

In some cases, design tweaks proved to be influential. In November 2020, for example, a homeowner in North Carolina discovered an issue with air being drawn back in through the corners of the most commonly used square fans. Subsequent testing by air quality experts showed that adding a shroud to the fan increased efficiency by as much as 50%.

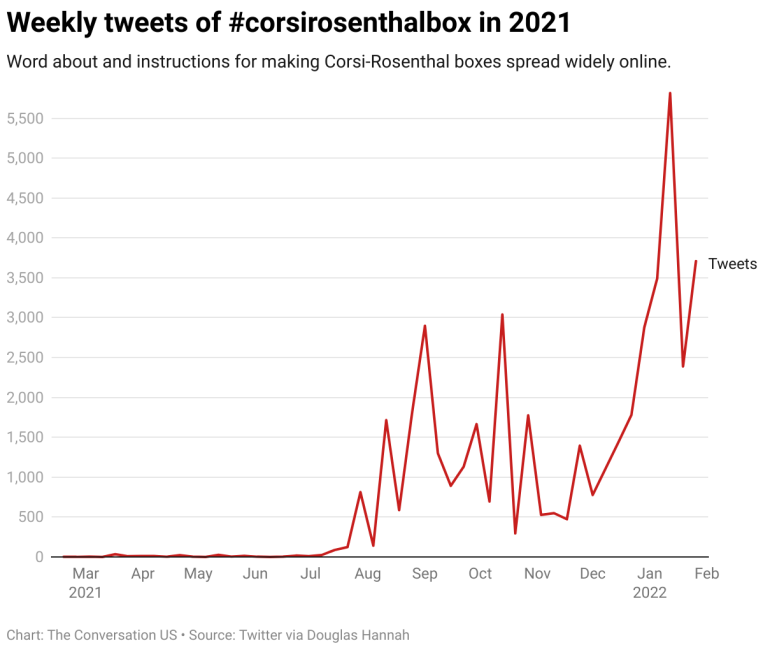
Weekly Tweets of Corsirosenthalbox in 2021
Analyzing social media and news coverage gives a sense of the scale of the Corsi-Rosenthal box phenomenon. As of January 2022, more than 1,000 units were in use in schools, with thousands more in homes and offices. More than 3,500 people had used the hashtag #corsirosenthalbox on Twitter, and tens of thousands more contributed to the online conversation. News articles and explainer videos on YouTube had collectively accumulated more than 1.9 million views.

Communities as sources of innovation

The story of the Corsi-Rosenthal box is part of a broader story of the grassroots response to the COVID-19 pandemic. The early days of the pandemic did more than just take a terrible toll on people. They also galvanized a massive entrepreneurial effort, with tens of thousands of everyday citizens lending their hands to design and produce the critical medical supplies and personal protective equipment that was suddenly needed.

Assembled Corsi-Rosenthal Boxes

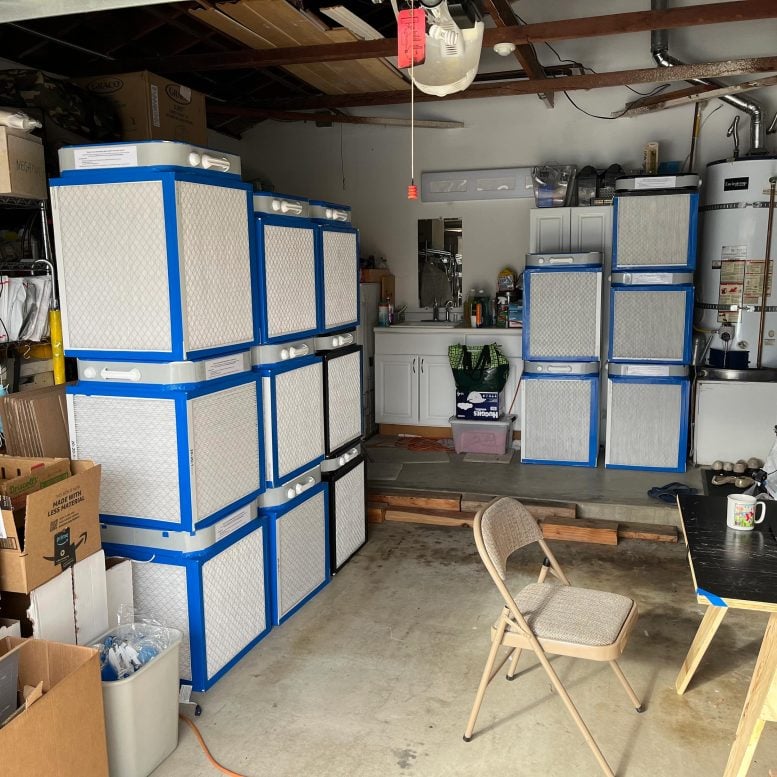
Corsi-Rosenthal boxes assembled and awaiting delivery to a homeless shelter in California. Credit: Douglas Hannah, CC BY-ND

My research team has been tracking these efforts. Through dozens of interviews and months of archival research, we’ve built a database of more than 200 startups – formal and informal, nonprofit and for-profit – whose activities ranged from designing oxygen concentrators to 3D printing face shields to building UV disinfection rooms. The picture of innovation that emerges is a far cry from the traditional lab coats and middle managers image that is commonly associated with new technologies.

First, few of the innovations we’ve tracked were actually invented by a single person, or even a single team. Rather, they were the joint project of broad networks of individual contributors from different backgrounds and organizations. This breadth is important because it brings more knowledge and more diverse perspectives. It can also be helpful for tapping existing knowledge. For example, as Corsi-Rosenthal boxes gained traction, the community was able to draw on earlier iterations that had been developed to help with wildfire smoke.

Second, the innovation process lacked hierarchical control. There was no single person directing where or how the technology was used. This lack of control made it easier to experiment and adapt to local conditions. One example is the development of oxygen concentrators for use in hospitals in India. Realizing that existing Western technologies failed frequently in the more humid operating environment typical of India, teams of innovators rallied to develop and share improved open-source designs.

Third, these communities shared knowledge online. This allowed individual contributors to communicate directly and share ideas, which helped knowledge spread rapidly through the network. It also meant that knowledge was more readily accessible. The detailed designs and test results from air quality engineers working on Corsi-Rosenthal boxes were readily available to anyone in the community.

Also, most of the organizations we tracked used Facebook, Twitter and Slack as tools to manage collaboration within and between organizations. As I and others have argued, this gives grassroots innovation tremendous promise – especially in a world where large-scale disruptions like a pandemic are increasingly common.

Pitfalls of grassroots innovation

Despite this promise, there are areas in which grassroots innovation communities falter. One challenge is a lack of technological sophistication and resources. While some of the communities in our study produced remarkably complex devices, the greatest contribution was in far simpler products like face shields and surgical gowns.

Then there are rules and regulations. Even when grassroots communities can produce safe and effective innovations, existing rules may not be ready to receive them. Some hospitals were unable to accept personal protective equipment provided by the community during the pandemic because of inflexible procurement policies, and today some schools continue to prohibit Corsi-Rosenthal boxes.

A final issue is sustaining effort. While grassroots communities were vital to allowing hospitals and medical facilities to remain functioning during the early days of the pandemic, many of the efforts that depended on volunteer labor eventually ran out of steam.

What this means for the future

As the second anniversary of the U.S. declaration of emergency approaches, a key lesson the world has learned is the importance of investing in indoor air quality, for example through monitoring and improved ventilation and filtration. And the value of ventilation as a noninvasive public health tool is even greater as mask mandates wane.

Another, broader lesson is the power of grassroots innovation and citizen engineering to develop these technologies. The story of the Corsi-Rosenthal box, like the thousands of other grassroots innovations developed during the pandemic, is fundamentally about people taking the welfare of their communities into their own hands. The most popular tweet shared about Corsi-Rosenthal boxes was from a 14-year-old aspiring engineer in Ontario offering to build and donate boxes to anyone in need.

Written by Douglas Hannah, Assistant Professor of Strategy and Innovation, Boston University.

This article was first published in The Conversation.The Conversation

Scientists Find Ways To Reconstruct Ancient 

Scents

Past Scents Can Be Recovered

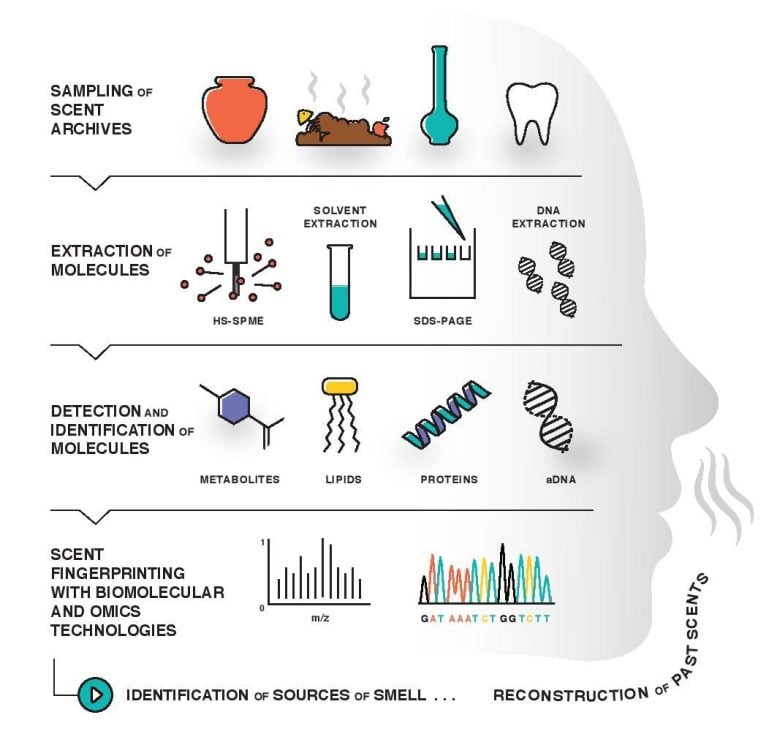
Past scents can be recovered from scent archives by extracting molecules using a variety of different methods. With successful detection and identification of the molecular composition of samples, ancient sources of smell can then be identified. Credit: Michelle O’Reilly

In recent years, millions of people worldwide have suffered the loss of smell due to COVID-19. Even those who have avoided infection with the new coronavirus experience the world of scent differently now due to the very masks that provide protection from the virus. This loss of olfaction has highlighted the important role of smell in how we perceive and navigate the world, and underscored the connections between olfaction and mental and physical health.

Scent has always been an integral component of the human experience, but up until now, the past has remained largely odorless. Most scents come from organic substances that decay quickly, leaving little for archaeologists to investigate thousands of years later. Now a team of researchers from the MPI for the Science of Human History is looking for new ways to bring the smellscapes of the past back to life and using smell to study past experience, behavior, and society.

“Tracking scent in the deep past is not a simple task,” says Barbara Huber, the lead author of the paper, “but the fact that history records expeditions of discovery, wars, and long-distance exchange to acquire materials with strong olfactory properties – like incense and spices – reveals how significant scent has been for humankind.”

Scent Data Can Be Contextualized

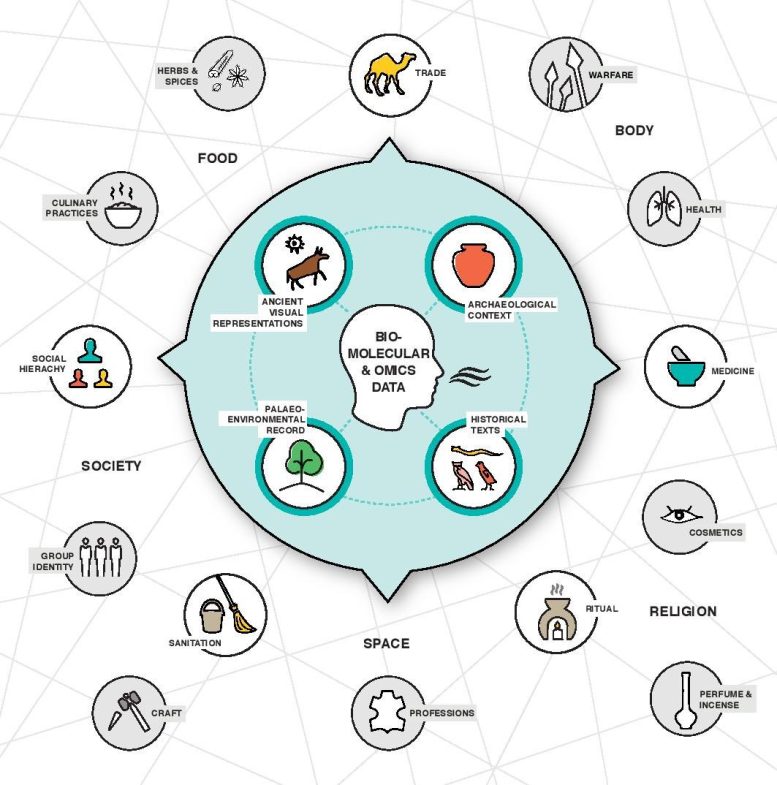
Scent data can be contextualized within the framework of relevant historical texts and visual representations, as well as the archaeological and environmental records. Connecting these different sources of information enables the reconstruction of critical aspects of ancient lifeways and society (indicated by arrows emerging from the blue circle). The icons in the outer area of the figure represent examples of some of the themes that can be addressed through this approach (grey boxes indicate broad headings). Credit: Michelle O’Reilly

Understanding the sensorial dimension of human history and the use of odorous and aromatic substances can contribute knowledge about many aspects of the past – including ritual, perfumery, hygiene, cuisine, trade, and commerce. But because scent is part of how we experience, understand, and navigate the world, ancient scents can also provide insight into more general aspects of the past, from social hierarchy and social practices to group identity.

“Scent is a powerful and underappreciated aspect of human experience,” notes Professor Nicole Boivin, senior author of the study and Director of the Department of Archaeology at the MPI Science of Human History “Smells reach our brain fairly directly and motivate us in critical ways – whether to avoid danger, identify something that is good for us, or remember something from our past, for example.”

“Using only traces of scented substances preserved in archaeological artifacts and features,” adds Huber, “novel methods are revealing the powerful odors that were a cardinal feature of ancient lived realities, and that shaped human action, thoughts, emotions, and memories.”

By leveraging potent new biomolecular and omics approaches, such as proteomic and metabolomics techniques, and linking new data with information from ancient texts, visual depictions, and the broader archaeological and environmental records, researchers stand to open up new aspects of the ancient world, our changing societies and cultures, and our evolution as a species. The authors of the new paper hope that more research into the rich ‘smellscapes’ of the past will provide insight into the sensory worlds of long ago, and the diverse ways that people have captured scents from nature in order to shape human experience. 

Reference: “How to use modern science to reconstruct ancient scent” 28 March 2022, Nature Human Behaviour.
DOI: 10.1038/s41562-022-01325-7


Stunning Subsurface Images of Yellowstone National Park Reveal “Mystery Sandwich” Plumbing System

SkyTEM Instrument Flown Over Old Faithful

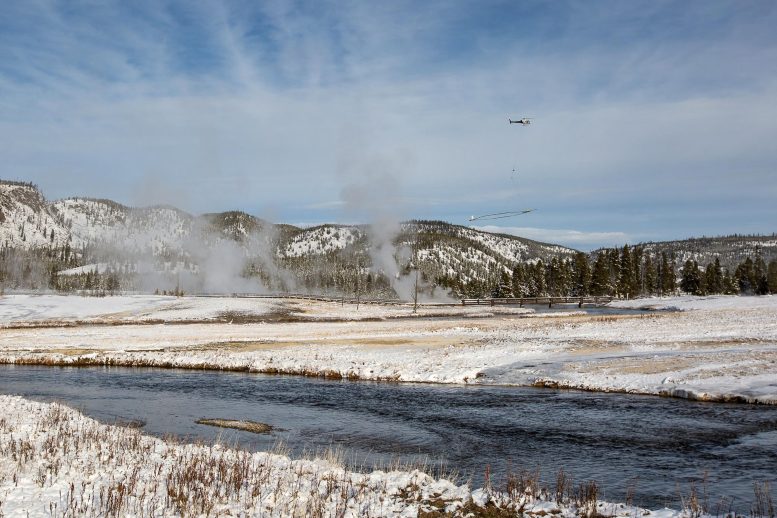
The SkyTEM instrument being flown over Old Faithful in Yellowstone National Park. Credit: Photo by Jeff Hungerford, Yellowstone National Park; supplied by Carol Finn of U.S. Geological Survey

The geysers and fumaroles of Yellowstone National Park are among the most iconic and popular geological features on our planet. Each year, millions of visitors travel to the park to marvel at the towering eruptions of Old Faithful, the bubbling mud cauldrons of Artists Paint Pots, the crystal-clear water, and iridescent colors of Grand Prismatic Spring, and the stacked travertine terraces of Mammoth Hot Springs.

Those who have visited the park may have asked themselves, “Where does all the hot water come from?” A study published last week in Nature, co-authored by Virginia Tech’s W. Steven Holbrook and colleagues from the U.S. Geological Survey and Aarhus University in Denmark, provides stunning subsurface images that begin to answer that question.

The research team used geophysical data collected from a helicopter to create images of Yellowstone’s subsurface “plumbing” system. The method detects features with unusual electrical and magnetic properties indicative of hydrothermal alteration.

“The combination of high electrical conductivity and low magnetization is like a fingerprint of hydrothermal activity that shows up very clearly in the data,” said Holbrook, a professor of geophysics and head of the Department of Geosciences in Virginia Tech’s College of Science. “The method is essentially a hydrothermal pathway detector.”

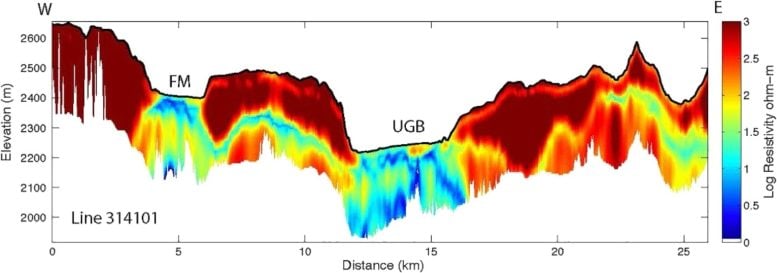
Images from the study show that the park’s geology profoundly shapes its hot springs. Hot hydrothermal fluids ascend nearly vertically, from depths of more than 1 km (or .62 miles), to arrive at the park’s major hydrothermal fields. Along the way, they mix with shallower groundwater flowing within and beneath the park’s volcanic lava flows, which also are visible in the images. Faults and fractures guide the ascent of hydrothermal waters, while lava flow boundaries control the shallow groundwater aquifers.

Subsurface Image of Yellowstone Hydrothermal Features

An example of a subsurface image of Yellowstone hydrothermal features produced from SkyTEM data. Blue colors are electrically conductive hydrothermal pathways; red features are electrically resistive lava flows. This line crosses two hydrothermal areas, one in the center of the figure that is near Old Faithful, and one labeled “FM” for Firehole Meadows. Credit: W. Steven Holbrook / Virginia Tech

The project fills in a longstanding knowledge gap about the underpinnings of Yellowstone’s charismatic hydrothermal features. Much is known about the park’s surface hydrothermal features, including the chemistry and temperature of mud pots and springs, the eruption interval of geysers, and the unique thermophilic bacteria that live in and around those features.

Likewise, scientists have a growing body of knowledge about the deeper heat sources and tectonic activity by tracking earthquakes that occur there. But little is known about how the surface hydrothermal features are connected to each other and to the deeper sources of heat and fluids.

“Our knowledge of Yellowstone has long had a subsurface gap,” Holbook said. “It’s like a ‘mystery sandwich’ — we know a lot about the surface features from direct observation and a fair amount about the magmatic and tectonic system several kilometers down from geophysical work, but we don’t really know what’s in the middle. This project has enabled us to fill in those gaps for the first time.”

To collect the data, the team used a unique instrument called “SkyTEM” that consists of a large loop of wire towed beneath a helicopter. As the helicopter flies, the loop sends downward repeated electromagnetic signals that provoke a response from electrically conductive bodies in the subsurface.

That response is recorded and later analyzed to produce detailed cross-sections along the flight lines. The technique is highly effective in environments like Yellowstone: hydrothermal fluids alter the rocks they pass through, turning rock into clay minerals — for example, the surface mud pots — that have heightened electrical conductivity but suppressed magnetization.

Steve Holbrook

Steve Holbrook, professor and head of the Department of Geosciences. Credit: Mike Lee for Virginia Tech

Because the helicopter is able to travel at speeds of 40 to 50 mph while towing the SkyTEM instrument, scientists involved in the study were able to cover large swaths of the sprawling, 3,500-square-mile national park, Holbrook said.

“One of the unique aspects of this dataset is its extensive coverage of this huge system,” Holbrook added. “We were able not just to look deep beneath the hydrothermal features, but also to see how adjacent features might be connected in the subsurface across great distances. That’s never been possible before.”

One of the mysteries addressed by the new work is whether different hydrothermal areas in the park show contrasting deep fluid sources and pathways. The team found a remarkable similarity in the deep structure beneath areas such as Norris Geyser Basin and Lower Geyser Basin, suggesting that contrasts in the chemistry and temperatures of those areas are not caused by deep processes. Instead, variable degrees of mixing with shallow groundwater likely create the wide variety of hot spring characteristics in the park.

Overall, the project generated more than 2,500 miles of helicopter lines, an enormous amount of data, according to Holbrook. Upon the study’s publication last month, the research team released the data so that others can undertake additional research.

“The data set is so big that we’ve only scratched the surface with this first paper,” Holbrook added. “I look forward to continuing to work on this data and to seeing what others come up with, too. It’s going to be a data set that keeps on giving.”

Before coming to Virginia Tech in 2017, Holbrook was part of the Department of Geology and Geophysics at the University of Wyoming in Laramie, Wyoming. He also co-directed the Wyoming Center for Environmental Hydrology and Geophysics. He said, “I’ve made several field trips to collect ground-based geophysical data in Yellowstone. The airborne data covers a lot more ground much more quickly than we could by hiking gear into the backcountry, though.”

Carol Finn of the U.S. Geological Survey and lead author on the study said, “While the airborne data were still being collected, we saw the first images over Old Faithful and knew instantly that our experiment had worked — that we could, for the first time, image the fluid pathways that had long been speculated.”

She added, “Our work has sparked considerable interest across a range of disciplines, including biologists looking to link areas of groundwater and gas mixing to regions of extreme microbiological diversity, geologists wanting to estimate volumes of lava flows, and hydrologists interested in modeling flow paths of groundwater and thermal fluid. With the paper as a guide and the release of the data and models, we will enable research in these diverse scientific communities.”

One mystery that Holbrook is interested in pursuing further is evidence for distant connections between isolated surface hydrothermal areas. The SkyTEM data show evidence for subsurface linkages between hydrothermal systems that are up to 6 miles apart.

“That might have implications for the co-evolution of thermophilic bacteria and Archaea,” Holbrook said. “The notion that airborne geophysical data could illuminate something about the life of microscopic organisms living around hot springs is a fascinating idea.”

Reference: “Geophysical imaging of the Yellowstone hydrothermal plumbing system” by Carol A. Finn, Paul A. Bedrosian, W. Steven Holbrook, Esben Auken, Benjamin R. Bloss and Jade Crosbie, 23 March 2022, Nature.
DOI: 10.1038/s41586-021-04379-1

We recommend

Smoke from Australia’s intense fires in 2019 and 2020 damaged the ozone layer

Increasingly large blazes threaten to undo decades of work to help Earth’s protective layer


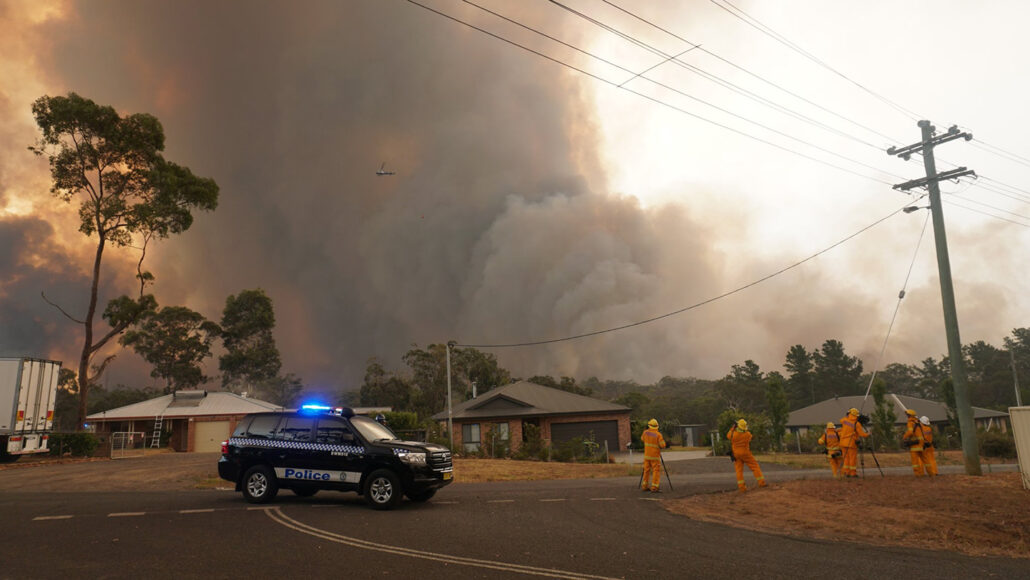
A towering cloud of smoke rises over the Green Wattle Creek bushfire
 on December 21, 2019, near the township of Yanderra in New South Wales, Australia.

By Carolyn Gramling
MARCH 17, 2022 

Towers of smoke that rose high into the stratosphere during Australia’s “black summer” fires in 2019 and 2020 destroyed some of Earth’s protective ozone layer, researchers report in the March 18 Science.

Chemist Peter Bernath of Old Dominion University in Norfolk, Va., and his colleagues analyzed data collected in the lower stratosphere during 2020 by a satellite instrument called the Atmospheric Chemistry Experiment. It measures how different particles in the atmosphere absorb light at different wavelengths. Such absorption patterns are like fingerprints, identifying what molecules are present in the particles.

The team’s analyses revealed that the particles of smoke, shot into the stratosphere by fire-fueled thunderstorms called pyrocumulonimbus clouds, contained a variety of mischief-making organic molecules (SN: 12/15/20). The molecules, the team reports, kicked off a series of chemical reactions that altered the balances of gases in Earth’s stratosphere to a degree never before observed in 15 years of satellite measurements. That shuffle included boosting levels of chlorine-containing molecules that ultimately ate away at the ozone.

Ozone concentrations in the stratosphere initially increased from January to March 2020, due to similar chemical reactions — sometimes with the contribution of wildfire smoke — that produce ozone pollution at ground level (SN: 12/8/21). But from April to December 2020, the ozone levels not only fell, but sank below the average ozone concentration from 2005 to 2019.

Earth’s ozone layer shields the planet from much of the sun’s ultraviolet radiation. Once depleted by human emissions of chlorofluorocarbons and other ozone-damaging substances, the layer has been showing signs of recovery thanks to the Montreal Protocol, an international agreement to reduce the atmospheric concentrations of those substances (SN: 2/10/21).

But the increasing frequency of large wildfires due to climate change — and their ozone-destroying potential — could become a setback for that rare climate success story, the researchers say (SN: 3/4/20).

Questions or comments on this article? E-mail us at feedback@sciencenews.org

CITATIONS

P. Bernath, C. Boone and J. Crouse. Wildfire smoke destroys stratospheric ozone. Science. Vol. 375, March 18, 2022, p. 1,292. doi: 10.1126/science.abm5611.


About Carolyn Gramling
E-mail
Twitter
Carolyn Gramling is the earth & climate writer. She has bachelor’s degrees in geology and European history and a Ph.D. in marine geochemistry from MIT and the Woods Hole Oceanographic Institution.

Palpable Change in Fire Dynamics Confirmed: U.S. Wildfires 4x Larger, 3x More Frequent Since 2000

Alder Fire in Yellowstone National Park

This is a 2013 photo of the Alder Fire in Yellowstone National Park. Credit: Mike Lewelling, National Park Service

New analysis confirms a palpable change in fire dynamics already suspected by many.

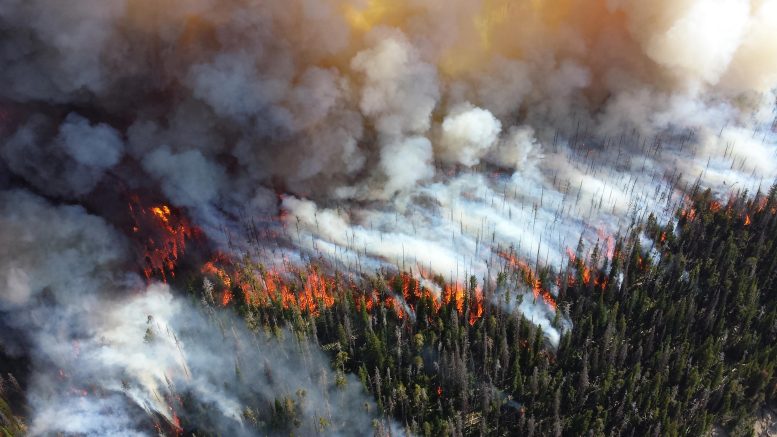
Fires have gotten larger, more frequent, and more widespread across the United States since 2000, according to a new CIRES Earth Lab-led paper. Recent wildfires have stoked concern that climate change is causing more extreme events, and the work published recently in Science Advances shows that large fires have not only become more common, they are also spreading into new areas, impacting land that previously did not burn.

“Projected changes in climate, fuel, and ignitions suggest that we’ll see more and larger fires in the future. Our analyses show that those changes are already happening,” said Virginia Iglesias, a research scientist with CIRES’ Earth Lab and lead author of the paper.

To evaluate how the size, frequency, and extent of fires have changed in the United States, Iglesias and her colleagues analyzed data from over 28,000 fires that occurred between 1984 and 2018 from the Monitoring Trends in Burn Severity (MTBS) dataset, which combines satellite imagery with the best available state and federal fire history records.

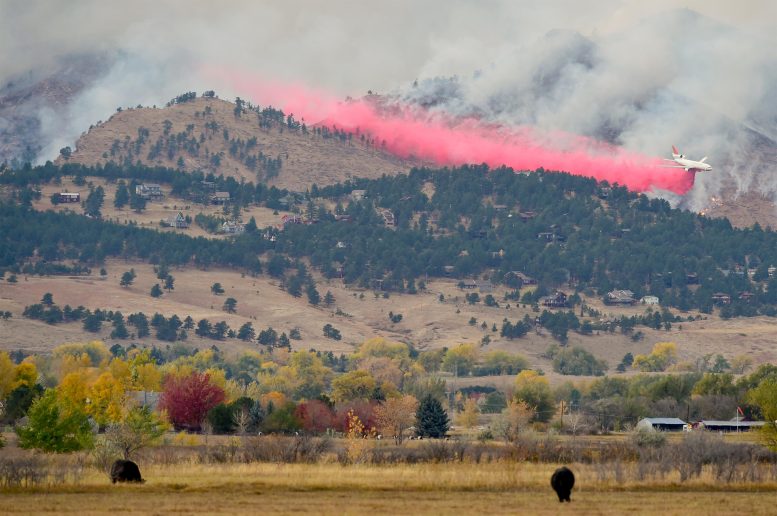
DC 10 Drops Fire Retardant 2020 Calwood Fire

A DC-10 drops fire retardant on the edge of the 2020 Calwood Fire in Colorado. Credit: William Travis, University of Colorado

The team found that there were more fires across all regions in the contiguous United States from 2005 to 2018 compared to the previous two decades. In the West and East, fire frequency doubled, and in the Great Plains, fire frequency quadrupled. As a result, the amount of land burned each year increased from a median of 1,552 to 5,502 square miles (4,019 to 14,249 km2) in the West and from 465 to 1,295 square miles (1,204 to 3,354 km2) in the Great Plains.

The researchers also took a closer look at the most extreme fire events in each region. They found that in the West and Great Plains, the largest wildfires grew bigger and ignited more often in the 2000s. Throughout the record, large fires were more likely to occur around the same time as other large fires.

“More and larger co-occurring fires are already altering vegetation composition and structure, snowpack and water supply to our communities,” Iglesias explained. “This trend is challenging fire-suppression efforts and threatening the lives, health, and homes of millions of Americans.”

Finally, the team discovered that the size of fire-prone areas increased in all regions of the contiguous United States in the 2000s, meaning that not only is the distance between individual fires getting smaller than it was in the previous decades, but also that fires are spreading into areas that did not burn in the past. 

These results confirm a palpable change in fire dynamics that has been suspected by the media, public, and fire-fighting officials. Unfortunately, the results also align with other troubling risk trends, such as the fact that development of natural hazard zones is also increasing wildfire risk. “These convergent trends, more large fires plus intensifying development, mean that the worst fire disasters are still to come,” said co-author and Earth Lab deputy director, William Travis.

The study authors suggest that to adapt and build resilience to wildfire impacts, planners and stakeholders must account for how fire is changing and how it is impacting vulnerable ecosystems and communities.

Reference: “U.S. fires became larger, more frequent, and more widespread in the 2000s” by Virginia Iglesias, Jennifer K. Balch and William R. Travis, 16 March 2022, Science Advances.
DOI: 10.1126/sciadv.abc0020

We recommend