Wednesday, March 30, 2022

Solar Orbiter Spacecraft Captures the Full Sun in Unprecedented Detail

Solar Orbiter Close Approach Sun

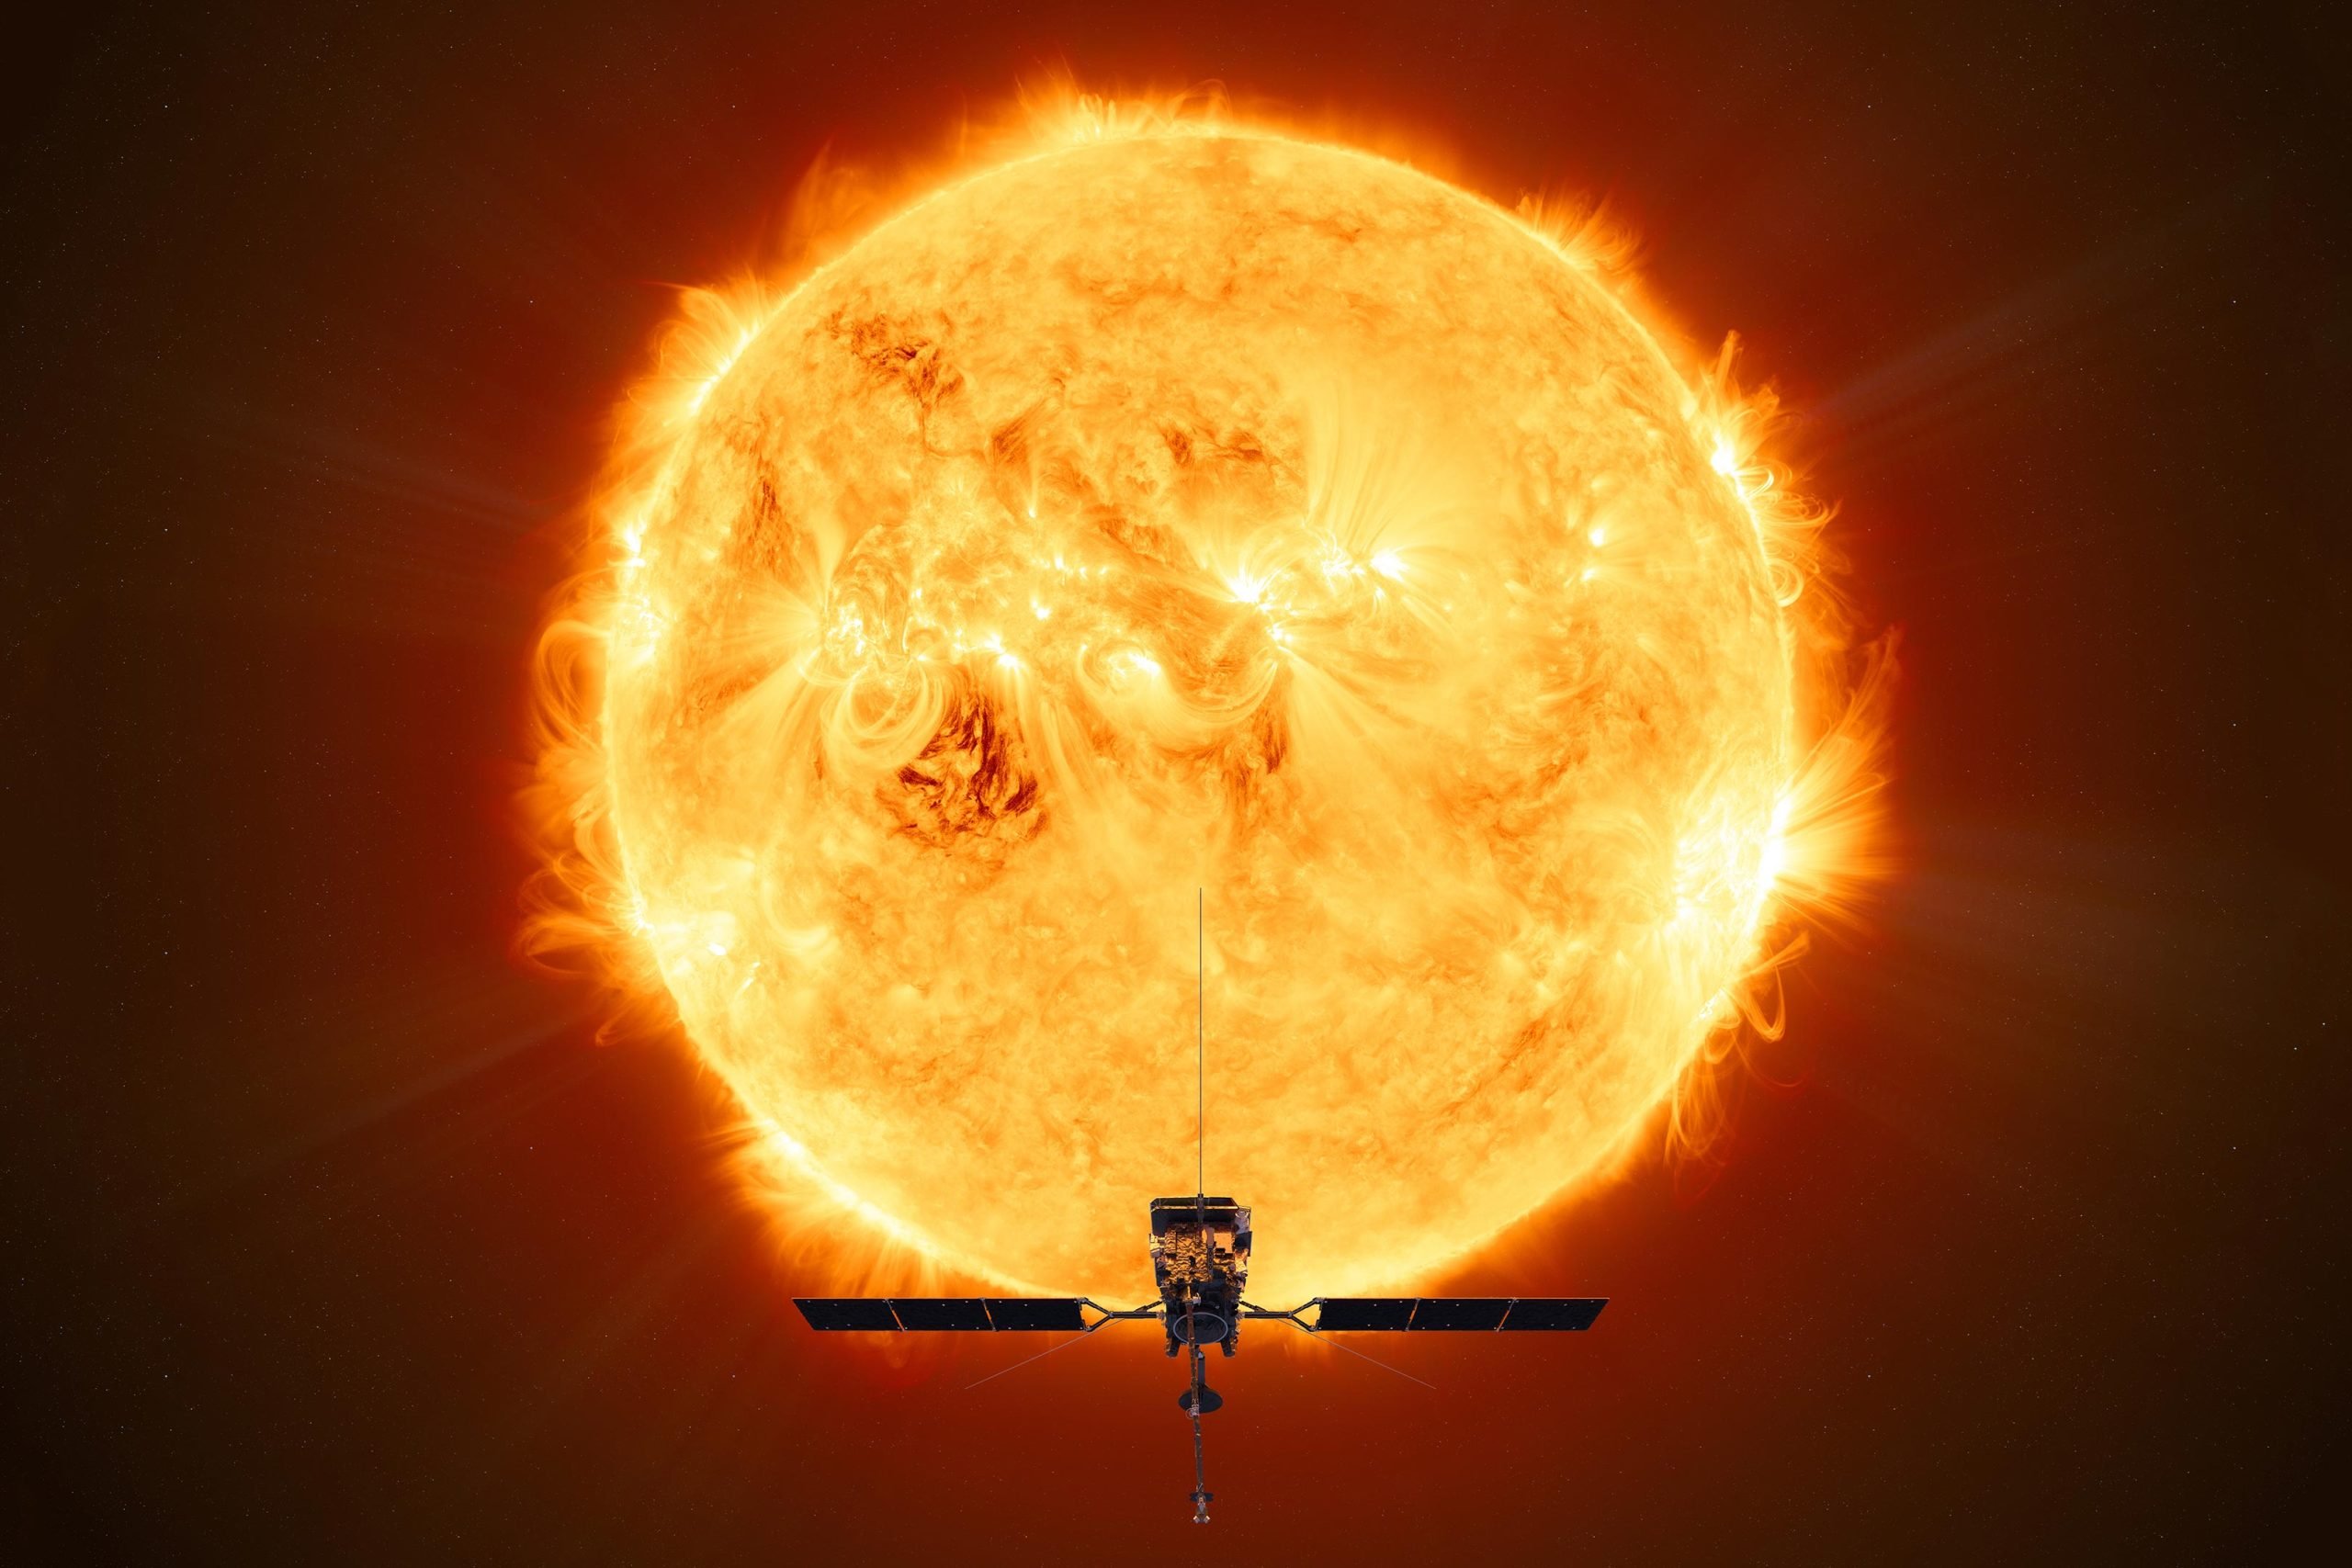
Animation of ESA’s Sun-explorer Solar Orbiter. Credit: ESA/Medialab

Solar Orbiter’s latest images shows the full Sun in unprecedented detail. They were taken on March 7, 2022, when the spacecraft was crossing directly between the Earth and Sun.

One of the images, taken by the Extreme Ultraviolet Imager (EUI) is the highest resolution image of the Sun’s full disc and outer atmosphere, the corona, ever taken.

Another image, taken by the Spectral Imaging of the Coronal Environment (SPICE) instrument represents the first full Sun image of its kind in 50 years, and by far the best one, taken at the Lyman-beta wavelength of ultraviolet light that is emitted by hydrogen gas.

The images were taken when Solar Orbiter was at a distance of roughly 75 million kilometers, half way between our world and its parent star. The high-resolution telescope of EUI takes pictures of such high spatial resolution that, at that close distance, a mosaic of 25 individual images is needed to cover the entire Sun. Taken one after the other, the full image was captured over a period of more than four hours because each tile takes about 10 minutes, including the time for the spacecraft to point from one segment to the next.

Solar Orbiter Captures Sun in Extreme Ultraviolet Light

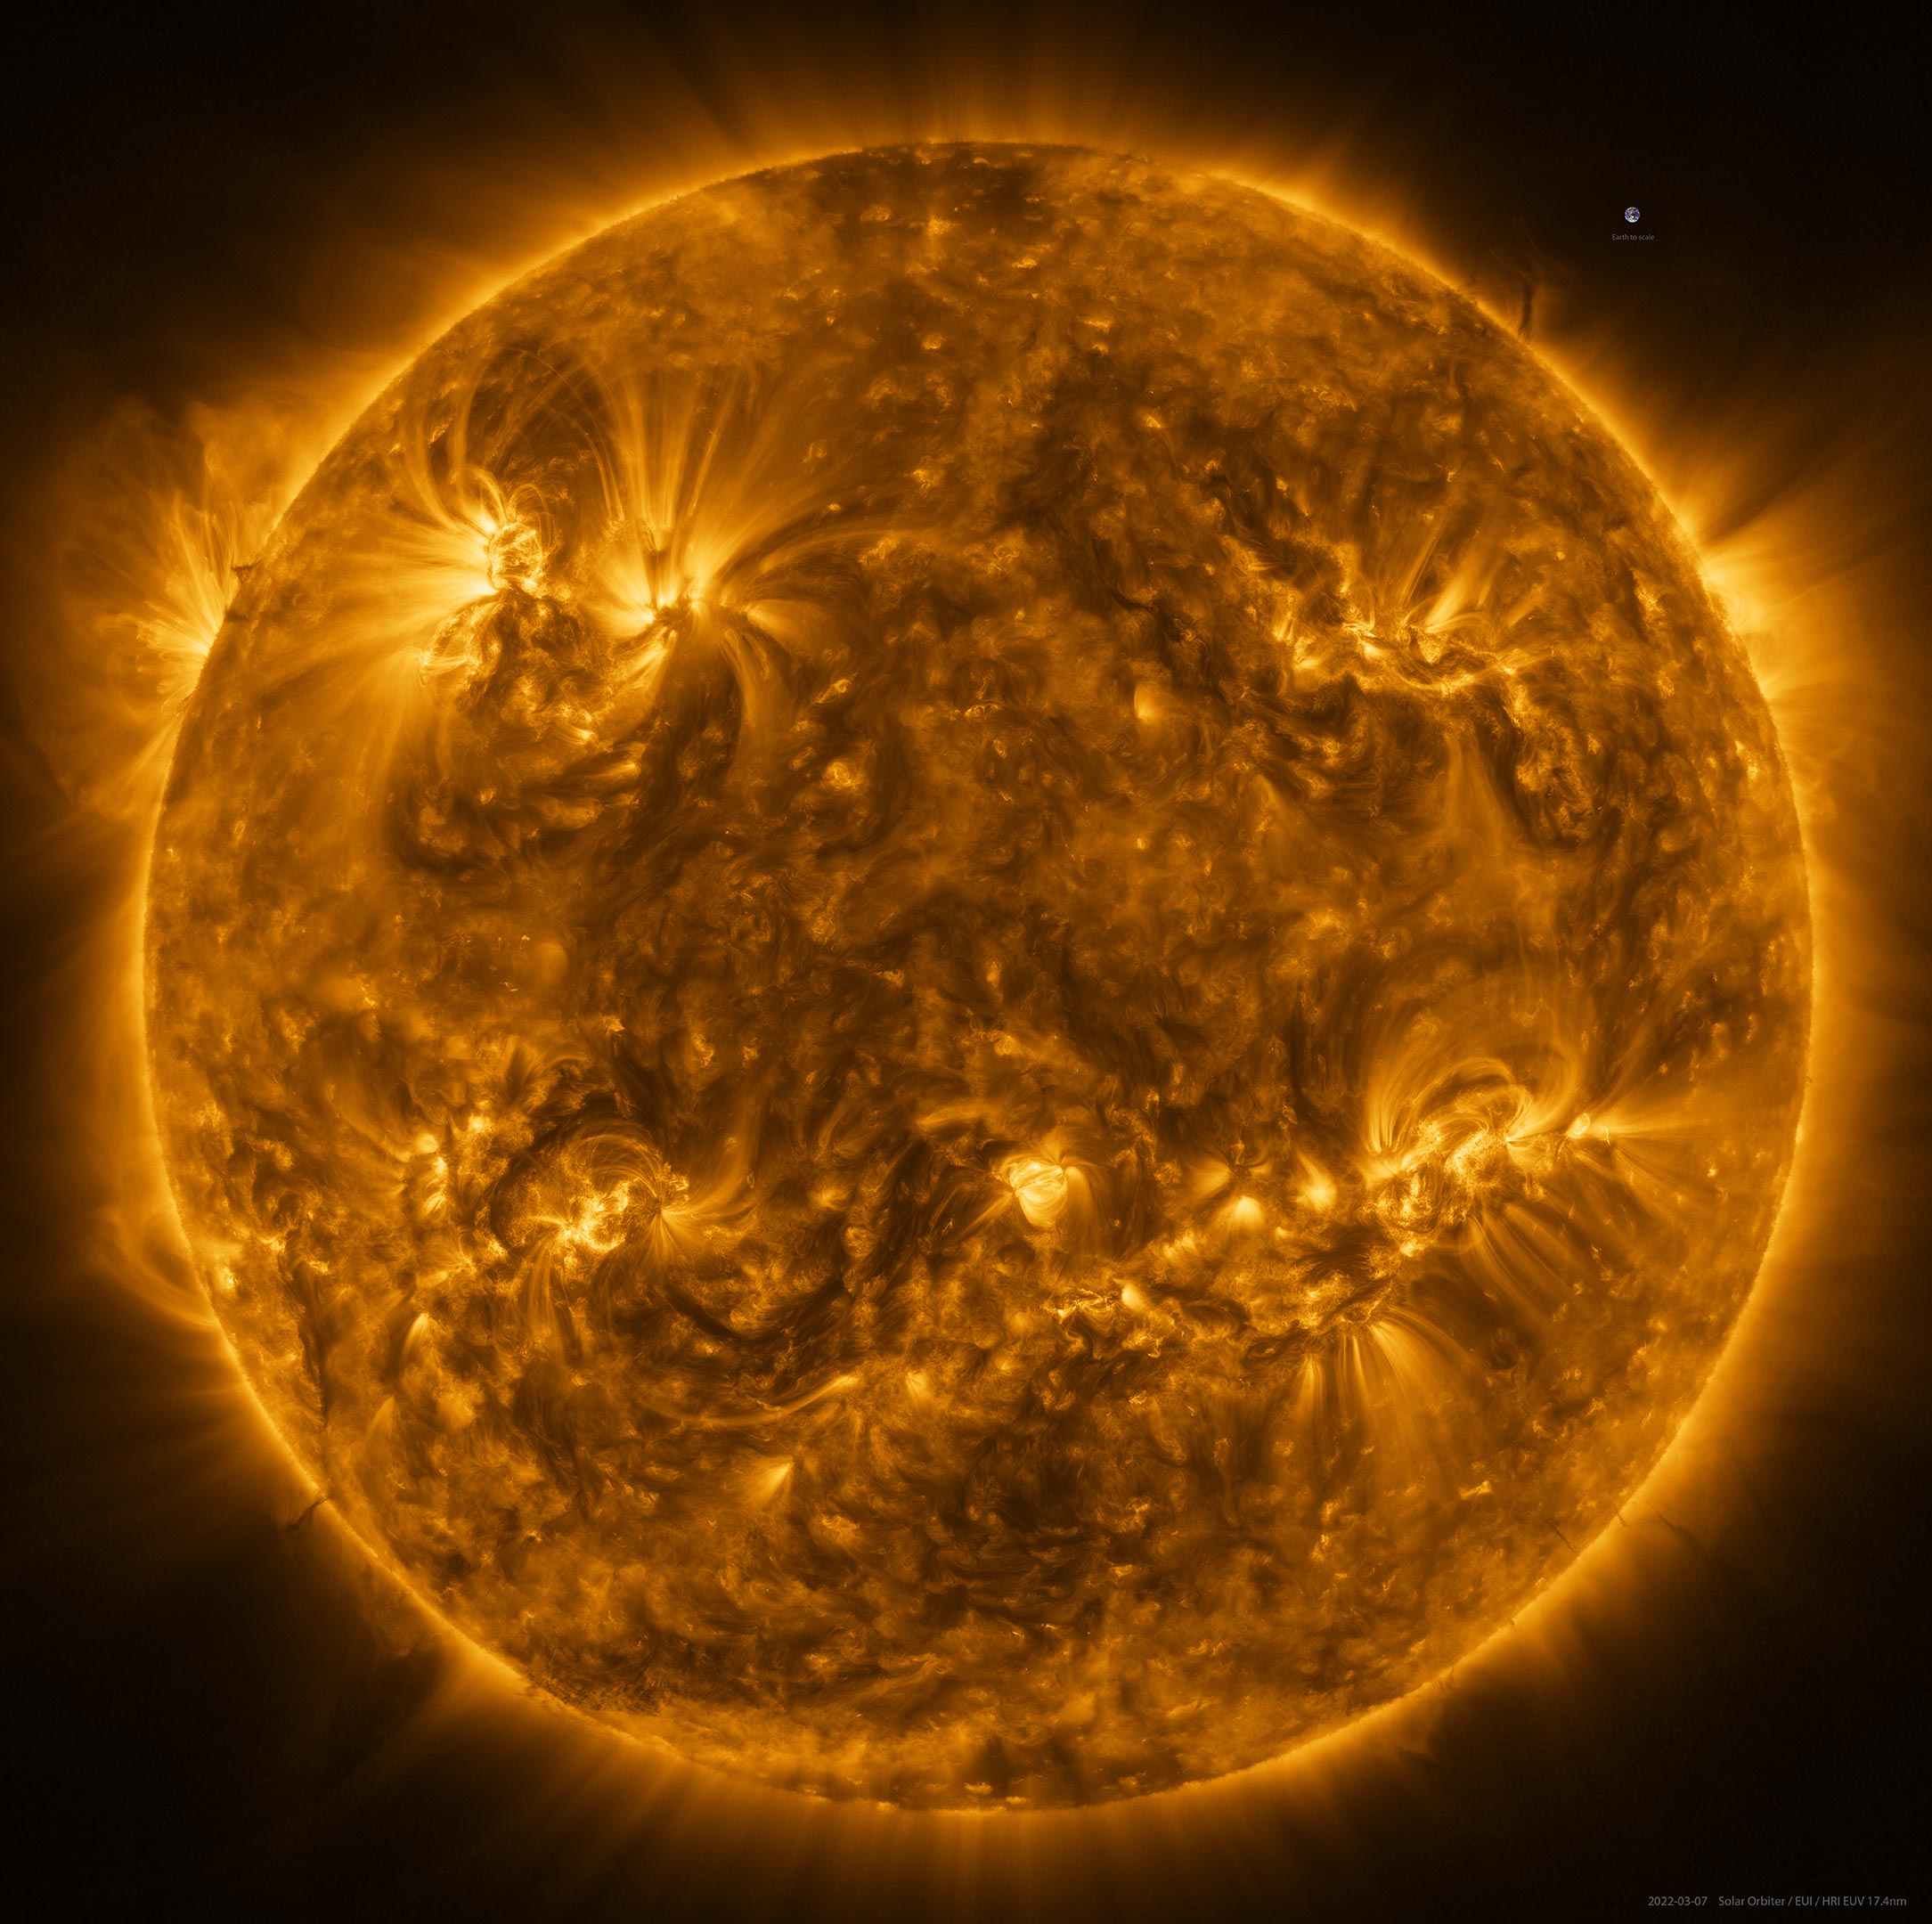
The Sun as seen by Solar Orbiter in extreme ultraviolet light from a distance of roughly 75 million kilometers. The image is a mosaic of 25 individual images taken on March 7, 2022, by the high resolution telescope of the Extreme Ultraviolet Imager (EUI) instrument. Taken at a wavelength of 17 nanometers, in the extreme ultraviolet region of the electromagnetic spectrum, this image reveals the Sun’s upper atmosphere, the corona, which has a temperature of around a million degrees Celsius. An image of Earth is also included for scale, at the 2 o’clock position. Credit: ESA & NASA/Solar Orbiter/EUI team; Data processing: E. Kraaikamp (ROB)

In total, the final image contains more than 83 million pixels in a 9148 x 9112 pixel grid. For comparison, this image has a resolution that is ten times better than what a 4K TV screen can display.

EUI images the Sun at a wavelength of 17 nanometers, in the extreme ultraviolet region of the electromagnetic spectrum. This reveals the Sun’s upper atmosphere, the corona, which has a temperature of around a million degrees Celsius.

Taking the Sun’s Temperature

Solar Orbiter took images of the Sun on March 7, from a distance of roughly 75 million kilometres, using its Spectral Imaging of the Coronal Environment (SPICE) instrument. SPICE takes simultaneous “spectral images” at several different wavelengths of the extreme ultraviolet spectrum by scanning its spectrometer slit across a region on the Sun. The different wavelengths recorded correspond to different layers in the Sun’s lower atmosphere. Purple corresponds to hydrogen gas at a temperature of 10,000°C, blue to carbon at 32,000°C, green to oxygen at 320,000°C, yellow to neon at 630,000°C. Each full-Sun image is made up of a mosaic of 25 individual scans. It represents the best full Sun image taken at the Lyman beta wavelength of ultraviolet light that is emitted by hydrogen gas. Credit: ESA & NASA/Solar Orbiter/SPICE team; Data processing: G. Pelouze (IAS)

At the 2 o’clock (near the image of the Earth for scale) and 8 o’clock positions on the edges of the Sun, dark filaments can be seen projecting away from the surface. These ‘prominences’ are prone to erupt, throwing huge quantities of coronal gas into space and creating ‘space weather’ storms.

In addition to EUI, the SPICE instrument was also recording data during the crossing. These too needed to be pieced together as a mosaic.

SPICE is designed to trace the layers in the Sun’s atmosphere from the corona, down to a layer known as the chromosphere, getting closer to the surface. The instrument does this by looking at the different wavelengths of extreme ultraviolet light that come from different atoms.

Taking the Sun’s Temperature

Taking the Sun’s temperature. Credit: ESA & NASA/Solar Orbiter/SPICE team; Data processing: G. Pelouze (IAS)

In the SPICE sequence of images purple corresponds to hydrogen gas at a temperature of 10,000°C, blue to carbon at 32,000°C, green to oxygen at 320,000°C, yellow to neon at 630,000°C.

This will allow solar physicists to trace the extraordinarily powerful eruptions that take place in the corona down through the lower atmospheric layers. It will also allow them to study one of the most puzzling observations about the Sun: how the temperature is rising through the ascending atmospheric layers.

Usually the temperature drops as you move away from a hot object. But above the Sun, the corona reaches a million degrees Celsius whereas the surface is only about 5000°C. Investigating this mystery is one of the key scientific objectives of Solar Orbiter.

ESA Solar Orbiter Facing Sun

ESA’s Solar Orbiter. Credit: ESA/ATG medialab

The images were taken on 7 March, precisely when Solar Orbiter crossed the Sun-Earth line, so the images can be compared with Earth-bound solar instruments and cross-calibrated. This will make it easier to compare results from different instruments and observatories in future.

On March 26, Solar Orbiter reaches another mission milestone: its first close perihelion. The spacecraft is now inside the orbit of Mercury, the inner planet, taking the highest resolution images of the Sun it can take. It is also recording data on the solar wind of particles that flows outwards from the Sun.

And this is just the start, over the coming years the spacecraft will repeatedly fly this close to the Sun. It will also gradually raise its orientation to view the Sun’s previously unobserved polar regions.

Solar Orbiter is a space mission of international collaboration between ESA and NASA.


Solar Orbiter: Tracking Sunspots Up Close

Tracking Sunspots Up Close Infographic

The ESA/NASA Solar Orbiter spacecraft just made its historic first close pass of the Sun, which happened midday on March 26, 2022.

In the days leading up to and around ‘Perihelion passage’, teams at ESA worked intensively on an observation campaign, and all ten instruments will be operating simultaneously to gather as much data as possible.

This effort will include using its remote sensing instruments, like the Extreme Ultraviolet Imager to image the Sun, as well as in-situ instruments to measure the solar wind as it flows past the spacecraft.

Observing specific targets of scientific interest on the Sun requires close coordination between flight control teams and the flight dynamics experts at ESA’s ESOC mission control centre, in Germany, and teams at the science operations center at ESAC, in Spain.

ESA teams are using the full-disc telescopes on board Solar Orbiter to identify dynamic activity – like moving sunspots – on the surface, then will use these specific locations to calculate accurate pointing of the narrow-angle imager for later detailed observation.

Since the instruments are fixed in place to the spacecraft body, the entire spacecraft must be pointed with high precision to point to specific sunspots.

This cycle of using wide-angle images to select specific narrow-angle targets, then feeding the needed pointing back into flight control instructions takes place daily, with each iteration taking three days from initial imaging to uplink of new pointing instructions.

While such close coordination happens throughout the mission, the cycle is much speeded up during perihelion passage to ensure the best possible scientific value from ‘up close’ to the Sun.

Nearby Star Could Help Explain Sunspot Mystery That Has Baffled Scientists for 300 Years

11 Year Sunspot Cycle

A new study has identified a nearby star whose sunspot cycles appear to have stopped. Studying this star might help explain the period from the mid 1600s to the early 1700s when our sun paused its sunspot cycles. This image depicts a typical 11-year cycle on the sun, with the fewest sunspots appearing at its minimum (top left and top right) and the most appearing at its maximum (center). Credit: NASA

The number of sunspots on our sun typically ebbs and flows in a predictable 11-year cycle, but one unusual 70-year period when sunspots were incredibly rare has mystified scientists for 300 years. Now a nearby sun-like star seems to have paused its own cycles and entered a similar period of rare starspots, according to a team of researchers at Penn State. Continuing to observe this star could help explain what happened to our own sun during this “Maunder Minimum” as well as lend insight into the sun’s stellar magnetic activity, which can interfere with satellites and global communications and possibly even affect climate on Earth.

The star — and a catalog of 5 decades of starspot activity of 58 other sun-like stars — is described in a new paper that appears online in the Astronomical Journal.

Starspots appear as a dark spot on a star’s surface due to temporary lower temperatures in the area resulting from the star’s dynamo — the process that creates its magnetic field. Astronomers have been documenting changes in starspot frequency on our sun since they were first observed by Galileo and other astronomers in the 1600s, so there is a good record of its 11-year cycle. The exception is the Maunder Minimum, which lasted from the mid-1600s to early 1700s and has perplexed astronomers ever since.

“We don’t really know what caused the Maunder Minimum, and we have been looking to other sun-like stars to see if they can offer some insight,” said Anna Baum, an undergraduate at Penn State at the time of the research and first author of the paper. “We have identified a star that we believe has entered a state similar to the Maunder Minimum. It will be really exciting to continue to observe this star during, and hopefully as it comes out of, this minimum, which could be extremely informative about the sun’s activity 300 years ago.”

The research team pulled data from multiple sources to stitch together 50 to 60 years of starspot data for 59 stars. This included data from the Mount Wilson Observatory HK Project — which was designed to study stellar surface activity and ran from 1966 to 1996 — and from planet searches at Keck Observatory which include this kind of data as part of their ongoing search for exoplanets from 1996 to 2020. The researchers compiled a database of stars that appeared in both sources and that had other readily available information that might help explain starspot activity. The team also made considerable efforts to standardize measurements from the different telescopes to be able to compare them directly and otherwise clean up the data.

The team identified or confirmed that 29 of these stars have starspot cycles by observing at least two full periods of cycles, which often last more than a decade. Some stars did not appear to have cycles at all, which could be because they are rotating too slowly to have a dynamo and are magnetically “dead” or because they are near the end of their lives. Several of the stars require further study to confirm whether they have a cycle.

“This continuous, more than 50-year time series allows us to see things that we never would have noticed from the 10-year snapshots that we were doing before,” said Jason Wright, professor of astronomy and astrophysics at Penn State and an author of the paper. “Excitingly, Anna has found a promising star that was cycling for decades but appears to have stopped.”

According to the researchers, the star — called HD 166620 — was estimated to have a cycle of about 17 years but has now entered a period of low activity and has shown no signs of starspots since 2003.

Christoph Scheiner Illustration

Sunspots were first observed in the 1600s by using a modified telescope called a helioscope. The instrument projects an image of the sun onto a surface, where dark sunspots can be observed. This illustration was produced by Christoph Scheiner in the 1600s for his book “Rosa Ursina sive Sol.” Credit: Christoph Scheiner

“When we first saw this data, we thought it must have been a mistake, that we pulled together data from two different stars or there was a typo in the catalog or the star was misidentified,” said Jacob Luhn, a graduate student at Penn State when the project began who is now at the University of California, Irvine. “But we double- and triple-checked everything. The times of observation were consistent with the coordinates we expected the star to have. And there aren’t that many bright stars in the sky that Mount Wilson observed. No matter how many times we checked, we always come to the conclusion that this star has simply stopped cycling.”

The researchers hope to continue studying this star throughout its minimum period and potentially as it comes out of its minimum and begins to cycle once again. This continued observation could provide important information about how the sun and stars like it generate their magnetic dynamos.

“There’s a big debate about what the Maunder Minimum was,” said Baum, who is now a doctoral student at Lehigh University studying stellar astronomy and asteroseismology. “Did the sun’s magnetic field basically turn off? Did it lose its dynamo? Or was it still cycling but at a very low level that didn’t produce many sunspots? We can’t go back in time to take measurements of what it was like, but if we can characterize the magnetic structure and magnetic field strength of this star, we might start to get some answers.”

A better understanding of the surface activity and magnetic field of the sun could have several important implications. For example, strong stellar activity can disable satellites and global communications, and one particularly strong solar storm disabled a power grid in Quebec in 1989. It has also been suggested that sunspot cycles may have a connection to climate on Earth. Additionally, the researchers said that information from this star could impact our search for planets beyond our solar system.

“Starspots and other forms of surface magnetic activity of stars interfere with our ability to detect the planets around them,” said Howard Isaacson, a research scientist at the University of California, Berkeley, and an author of the paper. “Improving our understanding of a star’s magnetic activity might help us improve our detection efforts.”

The curated database of the 59 stars and their starspot activity from this research has been made available for researchers to further investigate.

“This research is a great example of cross-generational astronomy, and how we continue to improve our understanding of the universe by building upon the many observations and dedicated research of astronomers that came before us,” said Wright. “I looked at starspot data from Mount Wilson and Keck Observatory for my thesis when I was a graduate student, Howard looked at starspot data from the California Planet Survey for his master’s thesis, and now Anna has stitched together all the data for a more comprehensive look across the years. We are all excited to continue studying this and other promising stars.”

Reference: “Five Decades of Chromospheric Activity in 59 Sun-like Stars and New Maunder Minimum Candidate HD 166620” by Anna C. Baum, Jason T. Wright, Jacob K. Luhn and Howard Isaacson, 22 March 2022, Astronomical Journal.
DOI: 10.3847/1538-3881/ac5683

Researchers discover a mysterious, new type of wave in the Sun whose speed defies explanation


Date: March 25, 2022
Source: New York University

Researchers from NYU Abu Dhabi's (NYUAD) Center for Space Science have discovered a new set of waves in the Sun that, unexpectedly, appear to travel much faster than predicted by theory.

In the study, "Discovery of high-frequency-retrograde vorticity waves in the Sun," published in the journal Nature Astronomy, the researchers -- led by Research Associate Chris S. Hanson -- detailed how they analyzed 25 years of space and ground-based data to detect these waves. The high-frequency retrograde (HFR) waves -- which move in the opposite direction of the Sun's rotation -- appear as a pattern of vortices (swirling motions) on the surface of the Sun and move at three times the speed established by current theory.

The interior of the Sun and stars cannot be imaged by conventional astronomy (e.g. optical, x-ray etc.), and scientists rely on interpreting the surface signatures of a variety of waves to image the interiors. These new HFR waves may yet be an important puzzle piece in our understanding of stars.

Complex interactions between other well known waves and magnetism, gravity or convection could drive the HFR waves at this speed. "If the HFR waves could be attributed to any of these three processes, then the finding would have answered some open questions we still have about the Sun," said Hanson. "However, these new waves don't appear to be a result of these processes, and that's exciting because it leads to a whole new set of questions."

This research was conducted within NYUAD's Center for Space Science in collaboration with the Tata Institute of Fundamental Research (TIFR) and New York University, using NYUAD and TIFR's computational resources. By studying the Sun's interior dynamics -- through the use of waves -- scientists can better appreciate the Sun's potential impact on the Earth and other planets in our solar system.

"The very existence of HFR modes and their origin is a true mystery and may allude to exciting physics at play," said Shravan Hanasoge, a co-author of the paper. "It has the potential to shed insight on the otherwise unobservable interior of the Sun."

Journal Reference:
Chris S. Hanson, Shravan Hanasoge, Katepalli R. Sreenivasan. Discovery of high-frequency retrograde vorticity waves in the Sun. Nature Astronomy, 2022; DOI: 10.1038/s41550-022-01632-z

Compelling Sign of Alien Life: Methane Could Be the First Detectable Indication of Life Beyond Earth

Abiotic Methane Sources

Methane in a planet’s atmosphere may be a sign of life if nonbiological sources can be ruled out. This illustration summarizes the known abiotic sources of methane on Earth, including outgassing from volcanoes, reactions in settings such as mid-ocean ridges, hydrothermal vents, and subduction zones, and impacts from asteroids and comets. Credit: © 2022 Elena Hartley

A new study assesses the planetary context in which the detection of methane in an exoplanet’s atmosphere could be considered a compelling sign of life.

If life is abundant in the universe, atmospheric methane may be the first sign of life beyond Earth detectable by astronomers. Although nonbiological processes can generate methane, a new study by scientists at UC Santa Cruz establishes a set of circumstances in which a persuasive case could be made for biological activity as the source of methane in a rocky planet’s atmosphere.

This is especially noteworthy because methane is one of the few potential signs of life, or “biosignatures,” that could be readily detectable with the James Webb Space Telescope, which will begin observations later this year.

“Oxygen is often talked about as one of the best biosignatures, but it’s probably going to be hard to detect with JWST,” said Maggie Thompson, a graduate student in astronomy and astrophysics at UC Santa Cruz and lead author of the new study.

Despite some prior studies on methane biosignatures, there had not been an up-to-date, dedicated assessment of the planetary conditions needed for methane to be a good biosignature. “We wanted to provide a framework for interpreting observations, so if we see a rocky planet with methane, we know what other observations are needed for it to be a persuasive biosignature,” Thompson said.

Published today (March 28, 2022) in Proceedings of the National Academy of Sciences, the study examines a variety of non-biological sources of methane and assesses their potential to maintain a methane-rich atmosphere. These include volcanoes; reactions in settings such as mid-ocean ridges, hydrothermal vents, and tectonic subduction zones; and comet or asteroid impacts.

The case for methane as a biosignature stems from its instability in the atmosphere. Because photochemical reactions destroy atmospheric methane, it must be steadily replenished to maintain high levels.

“If you detect a lot of methane on a rocky planet, you typically need a massive source to explain that,” said coauthor Joshua Krissansen-Totton, a Sagan Fellow at UCSC. “We know biological activity creates large amounts of methane on Earth, and probably did on the early Earth as well because making methane is a fairly easy thing to do metabolically.”

Nonbiological sources, however, would not be able to produce that much methane without also generating observable clues to its origins. Outgassing from volcanoes, for example, would add both methane and carbon monoxide to the atmosphere, while biological activity tends to readily consume carbon monoxide. The researchers found that nonbiological processes cannot easily produce habitable planet atmospheres rich in both methane and carbon dioxide and with little to no carbon monoxide.

The study emphasizes the need to consider the full planetary context in evaluating potential biosignatures. The researchers concluded that, for a rocky planet orbiting a sun-like star, atmospheric methane is more likely to be considered a strong indication of life if the atmosphere also has carbon dioxide, methane is more abundant than carbon monoxide, and extremely water-rich planetary compositions can be ruled out.

“One molecule is not going to give you the answer—you have to take into account the planet’s full context,” Thompson said. “Methane is one piece of the puzzle, but to determine if there is life on a planet you have to consider its geochemistry, how it’s interacting with its star, and the many processes that can affect a planet’s atmosphere on geologic timescales.”

The study considers a variety of possibilities for “false positives” and provides guidelines for assessing methane biosignatures.

“There are two things that could go wrong—you could misinterpret something as a biosignature and get a false positive, or you could overlook something that’s a real biosignature,” Krissansen-Totton said. “With this paper, we wanted to develop a framework to help avoid both of those potential errors with methane.”

He added that there is still a lot of work to be done to fully understand any future methane detections. “This study is focused on the most obvious false positives for methane as a biosignature,” he said. “The atmospheres of rocky exoplanets are probably going to surprise us, and we will need to be cautious in our interpretations. Future work should try to anticipate and quantify more unusual mechanisms for nonbiological methane production.”

Reference: “The case and context for atmospheric methane as an exoplanet biosignature” 28 March 2022, Proceedings of the National Academy of Sciences.
DOI: 10.1073/pnas.2117933119

In addition to Thompson and Krissansen-Totton, the coauthors of the paper include Jonathan Fortney, professor of astronomy and astrophysics at UCSC, Myriam Telus, assistant professor of Earth and planetary sciences at UCSC, and Nicholas Wogan at the University of Washington, Seattle. This work was supported by NASA.

Could the Internet Be Driven by Climate-Friendly “Natural Intelligence?”

Sun Exposure at Each Solar Protocol Server

Map of solar exposure over 24 hours at each Solar Protocol sun-powered network server. Credit: Tega Brain, Benedetta Piantella

Global network of solar-powered servers shows how.

The energy requirements of the Internet, the devices and systems using it and the servers that support it are responsible for greenhouse gas emissions equal to that of the global airline industry, and this carbon cost is growing rapidly with the expansion of blockchain-enabled transactions: The carbon footprint of a single Ethereum transaction is equivalent to nearly 329,000 credit card transactions.

A new project, Solar Protocol, developed by a team of researchers at the NYU Tandon School of Engineering, aims both to spotlight how this transglobal trafficking of data through the web is a major consumer of energy and driver of climate change, and to offer a potential solution.

On Tuesday, March 15, 2022, the project, initially supported by the Eyebeam Rapid Response for a Better Digital Future program, and the Code for Science & Society Digital Infrastructure Incubator, receives the Mozilla Creative Media Award from Mozilla, which supports internet health through development of open-source technologies in such areas as online privacy, inclusion and decentralization. Mozilla offers the award to people and projects that illuminate how to reimagine data in a way that shifts power away from big tech platforms and toward individuals and communities.

Developed by NYU Tandon Professors of Technology Culture and Society Tega Brain, who is also an assistant industry professor of integrated digital media, and Benedetta Piantella, a member of the Center for Urban Science and Progress (CUSP); and Adjunct Professor Alex Nathanson, Solar Protocol comprises a web platform hosted across a network of solar-powered servers set up in locations around the world. Besides being a workable system with implications for future servers, it constitutes a global installation that spotlights the politics of the web and different ways to track web traffic.

In stark contrast to large-scale, high-volume web services that algorithmically direct network traffic to whichever server gives the quickest response time, usually the closest geographically, Solar Protocol, with about a dozen volunteer-run server nodes around the world, uses the sun’s interaction with Earth as the cornerstone. How the sun shapes daily behaviors, seasonal activities and the decision-making of almost all life forms becomes the “logic” used to automate decisions in the digital network.

“Solar Protocol is a great opportunity for us as artists to foreground issues of climate change and how technology is driving it,” said Brain. “The project has catalyzed conversations about AI and automation, since in-network user traffic is decided by solar energy, so we are using intelligence from natural and dynamic versus a data-driven machine learning model; it’s an alternative proposition. Why not think of planetary limits as intelligence? Afterall, they will shape the future of life on earth whether we like it or not”

The network takes into consideration the fact that servers, each powered by photovoltaic cells, are located in different time zones and seasons, with different sun exposure and weather systems, and directs internet traffic to wherever the sun is shining. When a browser makes a request to see the Solar Protocol website, it is sent to whichever server in the network is generating the most energy.

“This is in no way an alternative to the internet, so the goal here is not to scale it up. But we are publishing the system as an open standard, which means, theoretically, anyone could launch a similar network — say, a network of art museums,” said Piantella.

Brain pointed out that the project also addresses the language of the Internet, and how we speak of it in terms suggesting it has little to do with the concrete realities of our physical environment.

“We talk about the internet as the cloud, for example, and we tend to use the language of magic to describe it, making no connection to how resource intensive it really is,” she said. “So, people who get involved in the project as server stewards, become very much in touch with its material reality, and what it takes to set up a server powered by the sun. You start making different design decisions; you think about planetary limits and rethink the politics of the internet.”

Added Kofi Yeboah, Creative Media Awards Program Officer at Mozilla, “In our connected world, conversations about power, about inclusion and exclusion, and about ownership often come down to one thing: data. How data is collected, managed, and trains AI systems has an impact on billions of lives. But that impact is often invisible. Creative Media Awards like Solar Protocol make the invisible visible, revealing how data can impact everything from the environment to personal safety. The Creative Media Awards also offer a way forward, modeling ways that data can be better stewarded to empower people and communities.”

An educational component of the project is through the VIP (Vertically Integrated Projects) initiative at NYU Tandon, allowing students to participate in analysis of the network’s functional cycle.

Solar Protocol includes several collaborators from a range of communities, including faculty members in Chile, and arts, cultural and community-based organizations in multiple areas and Indigenous territories in the Caribbean, Australia, and Kenya.

How the Brain Makes Memories and Uses “Time Travel” To Remember

Neuroscience

Cedars-Sinai researchers discover neurons that separate experience into segments, then help the brain ‘time travel’ and remember.

In a study led by Cedars-Sinai, researchers have discovered two types of brain cells that play a key role in dividing continuous human experience into distinct segments that can be recalled later. The discovery provides new promise as a path toward development of novel treatments for memory disorders such as dementia and Alzheimer’s disease.

The study, part of a multi-institutional BRAIN Initiative consortium funded by the National Institutes of Health and led by Cedars-Sinai, was published in the peer-reviewed journal Nature Neuroscience. As part of ongoing research into how memory works, Ueli Rutishauser, PhD, professor of Neurosurgery, Neurology, and Biomedical Sciences at Cedars-Sinai, and co-investigators looked at how brain cells react as memories are formed.

“One of the reasons we can’t offer significant help for somebody who suffers from a memory disorder is that we don’t know enough about how the memory system works,” said Rutishauser, senior author of the study, adding that memory is foundational to us as human beings.

How Human Brain Stores and Retrieves Memories

Researchers have discovered two types of brain cells that play a key role in creating memories. Credit: Sarah Pyle for Cedars-Sinai Medical Center

Human experience is continuous, but psychologists believe, based on observations of people’s behavior, that memories are divided by the brain into distinct events, a concept known as event segmentation. Working with 19 patients with drug-resistant epilepsy, Rutishauser and his team were able to study how neurons perform during this process.

Patients participating in the study had electrodes surgically inserted into their brains to help locate the focus of their epileptic seizures, allowing investigators to record the activity of individual neurons while the patients viewed film clips that included cognitive boundaries.

While these boundaries in daily life are nuanced, for research purposes, the investigators focused on “hard” and “soft” boundaries.

“An example of a soft boundary would be a scene with two people walking down a hallway and talking, and in the next scene, a third person joins them, but it is still part of the same overall narrative,” said Rutishauser, interim director of the Center for Neural Science and Medicine and the Board of Governors Chair in Neurosciences at Cedars-Sinai.

In the case of a hard boundary, the second scene might involve a completely different set of people riding in a car. “The difference between hard and soft boundaries is in the size of the deviation from the ongoing narrative,” Rutishauser said. “Is it a totally different story, or like a new scene from the same story?”

When study participants watched film clips, investigators noted that certain neurons in the brain, which they labeled “boundary cells,” increased their activity after both hard and soft boundaries. Another group of neurons, labeled “event cells,” increased their activity only in response to hard boundaries, but not soft boundaries.

Rutishauser and his co-investigators theorize that peaks in the activity of boundary and event cells—which are highest after hard boundaries, when both types of cells fire—send the brain into the proper state for initiating a new memory.

“A boundary response is kind of like creating a new folder on your computer,” said Rutishauser. “You can then deposit files in there. And when another boundary comes around, you close the first folder and create another one.”

To retrieve memories, the brain uses boundary peaks as what Rutishauser calls “anchors for mental time travel.”

“When you try to remember something, it causes brain cells to fire,” Rutishauser said. “The memory system then compares this pattern of activity to all the previous firing peaks that happened shortly after boundaries. If it finds one that is similar, it opens that folder. You go back for a few seconds to that point in time, and things that happened then come into focus.”

To test their theory, investigators gave study participants two memory tests.

They first showed participants a series of still images and asked them whether or not they had seen them in the film clips they had viewed. Study participants were more likely to remember images that closely followed a hard or soft boundary, when a new “memory folder” would have been created.

Investigators also showed participants pairs of images from film clips they had viewed and asked which of the images appeared first. Participants had difficulty remembering the correct order of images that appeared on opposite sides of a hard boundary, possibly because the brain had segmented those images into separate memory folders.

Rutishauser said that therapies that improve event segmentation could help patients with memory disorders. Even something as simple as a change in atmosphere can amplify event boundaries, he explained.

“The effect of context is actually quite strong,” Rutishauser said. “If you study in a new place, where you have never been before, instead of on your couch where everything is familiar, you will create a much stronger memory of the material.”

The research team included postdoctoral fellow Jie Zheng, PhD, and neuroscientist Gabriel Kreiman, PhD, from Boston Children’s Hospital; neurosurgeon Taufik A. Valiante, MD, PhD, of the University of Toronto; and Adam Mamelak, MD, professor of Neurosurgery and director of the Functional Neurosurgery Program at Cedars-Sinai.

In follow-up studies, the team plans to test the theory that boundary and event cells activate dopamine neurons when they fire, and that dopamine, a chemical that sends messages between cells, might be used as a therapy to strengthen memory formation.

Rutishauser and his team also noted during this study that when event cells fired in time with one of the brain’s internal rhythms, the theta rhythm—a repetitive pattern of activity linked to learning, memory and navigation—subjects were better able to remember the order of images they had seen. This is an important new insight because it shows that deep brain stimulation that adjusts theta rhythms could prove therapeutic for memory disorders.

“Theta rhythms are thought to be the ‘temporal glue’ for episodic memory,” said Zheng, first author of the study. “We think that firing of event cells in synchrony with the theta rhythm builds time-based links across different memory folders.”

For more on this research, see Researchers Discover How the Human Brain Separates, Stores, and Retrieves Memories.

Reference: “Neurons detect cognitive boundaries to structure episodic memories in humans” by Jie Zheng, Andrea G. P. Schjetnan, Mar Yebra, Bernard A. Gomes, Clayton P. Mosher, Suneil K. Kalia, Taufik A. Valiante, Adam N. Mamelak, Gabriel Kreiman and Ueli Rutishauser, 7 March 2022, Nature Neuroscience.
DOI: 10.1038/s41593-022-01020-w

The study was funded by National Institutes of Health Grants number U01NS103792 and U01NS117839, National Science Foundation Grant number 8241231216, and Brain Canada.

MIT Researchers Create a Tool for Predicting the Future

Big Data Predictive Analysis AI Concept

Researchers design a user-friendly interface that helps nonexperts make forecasts using data collected over time.

Whether someone is trying to predict tomorrow’s weather, forecast future stock prices, identify missed opportunities for sales in retail, or estimate a patient’s risk of developing a disease, they will likely need to interpret time-series data, which are a collection of observations recorded over time.

Making predictions using time-series data typically requires several data-processing steps and the use of complex machine-learning algorithms, which have such a steep learning curve they aren’t readily accessible to nonexperts.

To make these powerful tools more user-friendly, MIT researchers developed a system that directly integrates prediction functionality on top of an existing time-series database. Their simplified interface, which they call tspDB (time series predict database), does all the complex modeling behind the scenes so a nonexpert can easily generate a prediction in only a few seconds.

Tool for Predicting the Future

MIT researchers created a tool that enables people to make highly accurate predictions using multiple time-series data with just a few keystrokes. The powerful algorithm at the heart of their tool can transform multiple time series into a tensor, which is a multi-dimensional array of numbers (pictured). Credit: Figure courtesy of the researchers and edited by MIT News

The new system is more accurate and more efficient than state-of-the-art deep learning methods when performing two tasks: predicting future values and filling in missing data points.

One reason tspDB is so successful is that it incorporates a novel time-series-prediction algorithm, explains electrical engineering and computer science (EECS) graduate student Abdullah Alomar, an author of a recent research paper in which he and his co-authors describe the algorithm. This algorithm is especially effective at making predictions on multivariate time-series data, which are data that have more than one time-dependent variable. In a weather database, for instance, temperature, dew point, and cloud cover each depend on their past values.

The algorithm also estimates the volatility of a multivariate time series to provide the user with a confidence level for its predictions.

“Even as the time-series data becomes more and more complex, this algorithm can effectively capture any time-series structure out there. It feels like we have found the right lens to look at the model complexity of time-series data,” says senior author Devavrat Shah, the Andrew and Erna Viterbi Professor in EECS and a member of the Institute for Data, Systems, and Society and of the Laboratory for Information and Decision Systems.

Joining Alomar and Shah on the paper is lead author Anish Agrawal, a former EECS graduate student who is currently a postdoc at the Simons Institute at the University of California at Berkeley. The research will be presented at the ACM SIGMETRICS conference.

Adapting a new algorithm

Shah and his collaborators have been working on the problem of interpreting time-series data for years, adapting different algorithms and integrating them into tspDB as they built the interface.

About four years ago, they learned about a particularly powerful classical algorithm, called singular spectrum analysis (SSA), that imputes and forecasts single time series. Imputation is the process of replacing missing values or correcting past values. While this algorithm required manual parameter selection, the researchers suspected it could enable their interface to make effective predictions using time series data. In earlier work, they removed this need to manually intervene for algorithmic implementation.

The algorithm for single time series transformed it into a matrix and utilized matrix estimation procedures. The key intellectual challenge was how to adapt it to utilize multiple time series. After a few years of struggle, they realized the answer was something very simple: “Stack” the matrices for each individual time series, treat it as a one big matrix, and then apply the single time-series algorithm on it.

This utilizes information across multiple time series naturally — both across the time series and across time, which they describe in their new paper.

This recent publication also discusses interesting alternatives, where instead of transforming the multivariate time series into a big matrix, it is viewed as a three-dimensional tensor. A tensor is a multi-dimensional array, or grid, of numbers. This established a promising connection between the classical field of time series analysis and the growing field of tensor estimation, Alomar says.

“The variant of mSSA that we introduced actually captures all of that beautifully. So, not only does it provide the most likely estimation, but a time-varying confidence interval, as well,” Shah says.

The simpler, the better

They tested the adapted mSSA against other state-of-the-art algorithms, including deep-learning methods, on real-world time-series datasets with inputs drawn from the electricity grid, traffic patterns, and financial markets.

Their algorithm outperformed all the others on imputation and it outperformed all but one of the other algorithms when it came to forecasting future values. The researchers also demonstrated that their tweaked version of mSSA can be applied to any kind of time-series data.

“One reason I think this works so well is that the model captures a lot of time series dynamics, but at the end of the day, it is still a simple model. When you are working with something simple like this, instead of a neural network that can easily overfit the data, you can actually perform better,” Alomar says.

The impressive performance of mSSA is what makes tspDB so effective, Shah explains. Now, their goal is to make this algorithm accessible to everyone.

One a user installs tspDB on top of an existing database, they can run a prediction query with just a few keystrokes in about 0.9 milliseconds, as compared to 0.5 milliseconds for a standard search query. The confidence intervals are also designed to help nonexperts to make a more informed decision by incorporating the degree of uncertainty of the predictions into their decision making.

For instance, the system could enable a nonexpert to predict future stock prices with high accuracy in just a few minutes, even if the time-series dataset contains missing values.

Now that the researchers have shown why mSSA works so well, they are targeting new algorithms that can be incorporated into tspDB. One of these algorithms utilizes the same model to automatically enable change point detection, so if the user believes their time series will change its behavior at some point, the system will automatically detect that change and incorporate that into its predictions.

They also want to continue gathering feedback from current tspDB users to see how they can improve the system’s functionality and user-friendliness, Shah says.

“Our interest at the highest level is to make tspDB a success in the form of a broadly utilizable, open-source system. Time-series data are very important, and this is a beautiful concept of actually building prediction functionalities directly into the database. It has never been done before, and so we want to make sure the world uses it,” he says.

“This work is very interesting for a number of reasons. It provides a practical variant of mSSA which requires no hand tuning, they provide the first known analysis of mSSA, and the authors demonstrate the real-world value of their algorithm by being competitive with or out-performing several known algorithms for imputations and predictions in (multivariate) time series for several real-world data sets,” says Vishal Misra, a professor of computer science at Columbia University who was not involved with this research. “At the heart of it all is the beautiful modeling work where they cleverly exploit correlations across time (within a time series) and space (across time series) to create a low-rank spatiotemporal factor representation of a multivariate time series. Importantly this model connects the field of time series analysis to that of the rapidly evolving topic of tensor completion, and I expect a lot of follow-on research spurred by this paper.”

Reference: “On Multivariate Singular Spectrum Analysis and its Variants” by Anish Agarwal, Abdullah Alomar and Devavrat Shah, 13 February 2021, Computer Science > Machine Learning.
arXiv:2006.13448

We recommend

Your Gut Microbiome Shapes Your Life. But Where Did It Come From?

Microbiome Acquisition

Artist’s concept of this research that probes the odds of a new species being acquired by a microbiome ecosystem. Credit: Navid Marvi, courtesy of the Carnegie Institution for Science

The role of chance in microbiome composition.

The gut microbiome is an ecosystem of hundreds to thousands of microbial species living within the human body. These populations affect our health, fertility, and even our longevity. But how do they get there in the first place?

New collaborative work led by Carnegie’s William Ludington reveals crucial details about how the bacterial communities that comprise each of our individual gut microbiomes are acquired. These findings, published in the Proceedings of the National Academy of Sciences, have major implications for treatments such as fecal transplants and probiotic administration.

“There is a huge amount of variation in microbiome composition between individuals,” Ludington explained. “For example, if you look at the sum total of all of the bacterial species that are adapted to live in the gastrointestinal systems of humans, most of these are not present in a majority of people. That’s how incredibly diverse these gut microbial populations are.”

A combination of elements, including genetics, diet, and environment contribute to the differences between our microbiomes. But there isn’t a direct line between these inputs and the species that successfully colonize our guts. There’s an element of chance at play each time we are exposed to a new microbe as to whether it will be acquired and become a member of our gut ecosystem. Ludington and his collaborators set out to understand the factors that shape the odds of this colonization process.

Although many researchers have studied microbiome compositions in natural populations, there have been few attempts to use a controlled environment to reveal the process by which new species successfully join the gut microbial ecosystem. Ludington and his collaborators—Eric Jones and David Sivak of Simon Fraser University and Jean Carlson of UC Santa Barbara—developed a new ecological model to understand how we acquire the specific mix of microbes that are individual to our own particular gut communities.  

Working in the comparatively much less complicated microbiomes of fruit flies, the team showed that exposure to a microbial species does not guarantee its successful incorporation into the microbiome ecosystem. They found that the state of the microbiome, and interactions between existing microbiome member species, sets the odds for whether a newly encountered bacteria is added into the mix.

“Even among genetically identical flies that lived in the same housing and were fed the same diets, we saw variations in microbiome composition,” Sivak said.

The researchers then used these results to build mathematical models that could probe increasingly complex scenarios by which new microbiome species could be acquired, leading to their breakthrough understanding of the community factors that shape membership in the microbiome ecosystem.

“Think of microbiome composition as a big party where the social dynamics determine who leaves early and who stays until dawn,” said Ludington.

Added Jones, the paper’s first author: “Bacterial colonization depends on a number of complicated factors that we’re just starting to understand.  We showed, for example, that some groups of species facilitate each other’s colonization and are therefore more likely to coexist.”

These group interactions have exciting implications for how microbiomes are transmitted between individuals, including how medical professionals might drive a person’s microbiome towards a desired composition.

“The beauty of the mathematical approach we deployed is that it acknowledges that colonization is a roll of the dice, but we are now able to attribute the weighting of the dice to biological interactions with a molecular basis that has been honed by evolution,” said Carlson.

The team’s findings provide a framework for quantitatively examining the mechanisms that therapies such as fecal transplants and probiotics depend upon, advancing toward the eventual goal of personalized microbiome medicine.        

Reference: “Stochastic microbiome assembly depends on context” by Eric W. Jones, Jean M. Carlson, David A. Sivak and William B. Ludington, 8 February 2022, Proceedings of the National Academy of Sciences.
DOI: 10.1073/pnas.2115877119

This work was supported by the Banting Postdoctoral Fellowship, the Pacific Institute for the Mathematical Sciences Postdoctoral Fellowship, the David and Lucile Packard Foundation, the Institute for Collaborative Biotechnologies, the U.S. Army Research Office, a Natural Sciences and Engineering Research Council of Canada Discovery Grant, the Canada Research Chairs program, a National Institutes of Health grant, National Science Foundation Integrative Organismal Systems award, the Carnegie Institution for Science endowment, and a Carnegie Institution of Canada grant.