These 11 Maps Show How Black People Have Been Driven Out Of Neighborhoods In Five Of The Most Gentrified US Cities
The maps distinctly show neighborhoods where black populations have left and where white people have moved in.
Lam Thuy Vo BuzzFeed News Reporter Posted on February 27, 2020

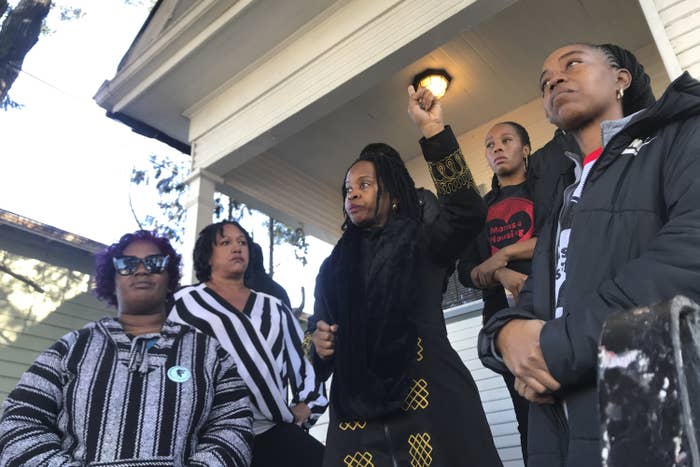
Kate Wolffe / AP
Moms 4 Housing activists stand outside a vacant home on Magnolia Street in West Oakland that they occupied, saying they were unable to find permanent housing in the Bay Area, in December 2019.
We have known for years that gentrification has disproportionately displaced black and Latino people from their homes across the US, “excluding existing residents from the benefits of a revitalizing neighborhood,” as one study put it. The statistics prove it, we make cultural statements about it, and there’s rising activism around it.
To help visualize how minority communities are pushed out by white populations, BuzzFeed News ran an analysis of five of the most gentrified US cities. The results show how the demographics changed between 2000 and 2017 and highlight which census tracts have gentrified in that time.
Here’s how you can read each map: the city is split up into census tracts — a geographic region of a few thousand people. For each major race group in the census, the tracts are shaded according to how that group's representation changed between 2000 and 2017. The more red a tract is, the more that population's shrunk, relative to the tract's total population. Blue-shaded tracts indicate percentage-point increases.
To help you navigate the city’s neighborhoods a bit better, we’ve outlined every tract that has gentrified. There's no universally accepted definition of gentrification, but BuzzFeed News used a methodology developed by Governing magazine and other academic work that relies on census data on income, home prices, and education — but not racial or ethnic demographics. You can read more about how we calculated that here or play around with an interactive map at the end of the article.
Oakland
Gentrification in Oakland has become a focal point as the Bay Area gets increasingly expensive. There have also been viral incidences that made national news, like when a white woman called the police on a black family for having a barbecue.
Below is a map of Oakland that shows just how the historically black city has seen a decrease in its black population, especially in and around gentrifying neighborhoods.
Percentage point change in black population
-30% 30%
Percentage point change in white population
-30% 30%
Washington, DC
Most gentrified tracts in DC are spread throughout the city’s center, with some recording a decrease in the black population by 69 percentage points. The city has also been singled out by a study as one of the few places where gentrification pushes low-income residents out of the city.
Percentage point change in black population
-30% 30%
Percentage point change in white population
-30% 30%
Atlanta
Atlanta, sometimes dubbed the “Black Mecca,” has gentrified throughout the center of the city, based on a lot of real estate speculation, the Guardian has reported. In some of these gentrifying census tracts, the black population has shrunk by more than 45 percentage points — with the white population growing by the same amount.
Percentage point change in black population
-30% 30%
Percentage point change in white population
-30% 30%
New York City
New York City is a place of block-by-block extremes. As such, the city also gentrified in various boroughs, creating what some scholars at UC Berkeley described as “islands of exclusion in Manhattan, Brooklyn, and Queens.”
Some of the most startling changes in demographics in gentrified neighborhoods can be found in central Brooklyn and northern Manhattan in and around historically black Harlem.
Percentage point change in black population
-30% 30%
Percentage point change in white population
-30% 30%
Baltimore
Unlike other cities, Baltimore saw a displacement of black and white populations in gentrifying neighborhoods. In East Baltimore, where the Latino population grew, white people were displaced in neighborhoods where home values and education levels also increased, a researcher told the Baltimore Sun.
Percentage point change in black population
-30% 30%
Percentage point change in white population
-30% 30%
Zoom in and out and toggle between different populations (take a look at the boxes on the top left) with this interactive map:
Gentrified< -30 -25 -20 -15 -10 -5 0 5 10 15 20 25 30 >
Black
White
Asian
Hispanic/Latino
Oakland
Atlanta
NYC
DC
Baltimore
© Mapbox © OpenStreetMap Improve this map © Maxar
Notes: The cities were chosen based on how many census tracts gentrified in those cities, whether people were searching for the term “gentrification” in a particular state, and whether the cities had made headlines related to housing issues in recent years.
BuzzFeed News used a methodology adopted from Governing magazine — similar to a methodology developed by Columbia University's Lance Freeman — to determine whether a census tract had gentrified between 2000 and 2017. While opinions differ on what constitutes gentrification, this methodology examines population size, median income, median home values, and post-secondary educational attainment. More details about the methodology and the data can be found here.
Lo Bénichou from Mapbox contributed reporting and editorial production to the article.

Lam Thuy Vo is a reporter for BuzzFeed News and is based in New York.
No comments:
Post a Comment