By Andrej Flis | Latest news | 26 OCTOBER 2020
Arctic sea ice melt season usually lasts from March till September. After reaching the minimum extent in September, sea ice starts to grow back in October. But this year, the growth is much slower than last year, with almost no growth in some places. How did this unusual situation happen and can it mean something for the weather towards Winter 2020/2021?
THE ARCTIC ICE GROWTH
The Arctic sea ice seasonal cycle can be seen in the image below from the Arctic-ROOS system. It shows the Arctic sea ice extent change over a year. The melt season usually starts in March, after the peak ice extent is reached, lasting all the way to September. The graph shows the last few years of data, where we can see the 2020 Arctic ice extent was second-lowest, only behind 2012, which still holds the record for the lowest ice extent since measurements began.
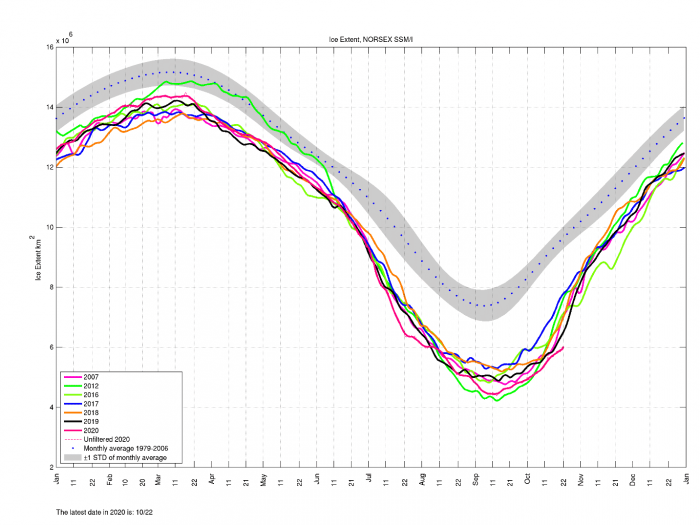
But comparing 2012 and 2020, we can see that this year we are also setting a new record, as the Arctic sea ice is not recovering as expected. The sea ice is refreezing back, but at a much slower rate than normal, meaning that some areas are severely falling behind.
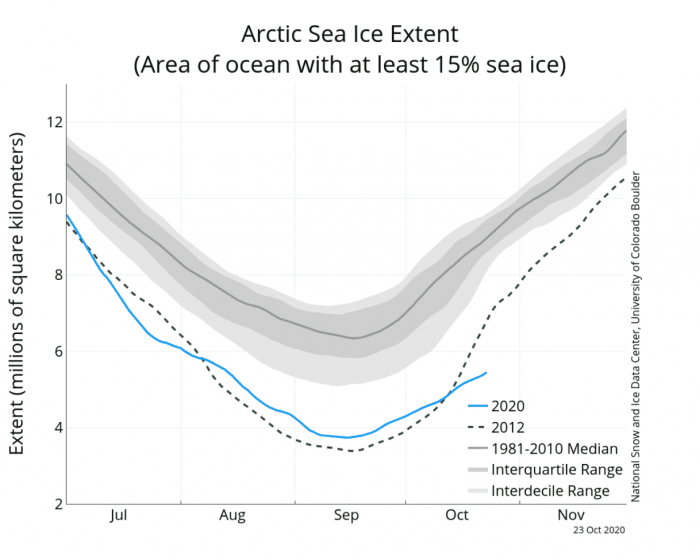
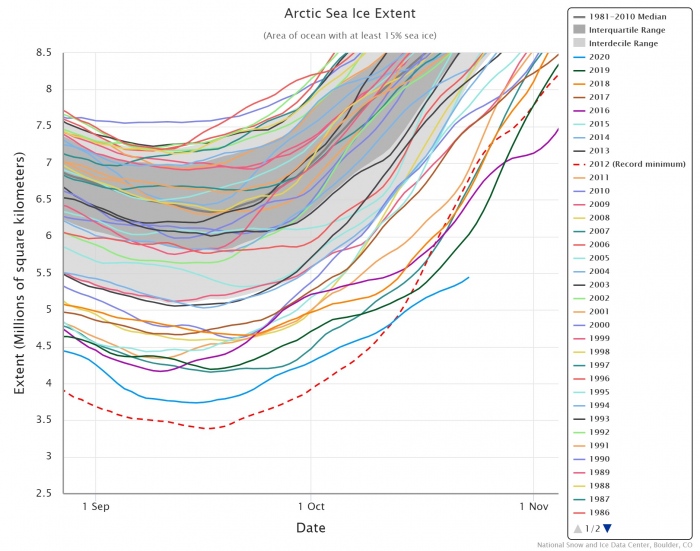
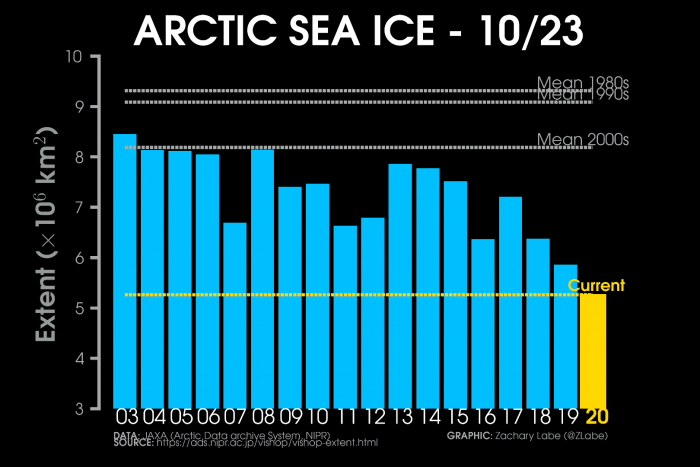
That is even more evident when we look at the comparison of all the years since the active satellite observations began in 1979. This year we observed the second-lowest Arctic sea ice extent on record. But because of the unusually low ice growth in October, the current ice extent is now the lowest for any October in the past 41 years.
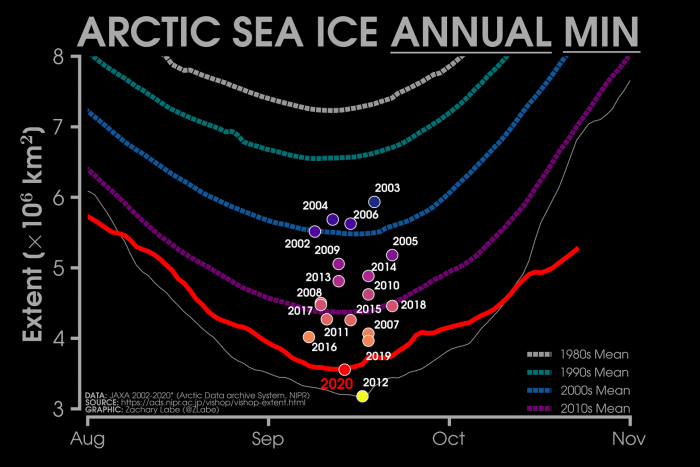
Comparing the minimum extent dates for the past 17 years also shows the 2020 minimum to be second lowest, trailing only the grand minimum of 2012. Graphic provided by Zachary Labe.
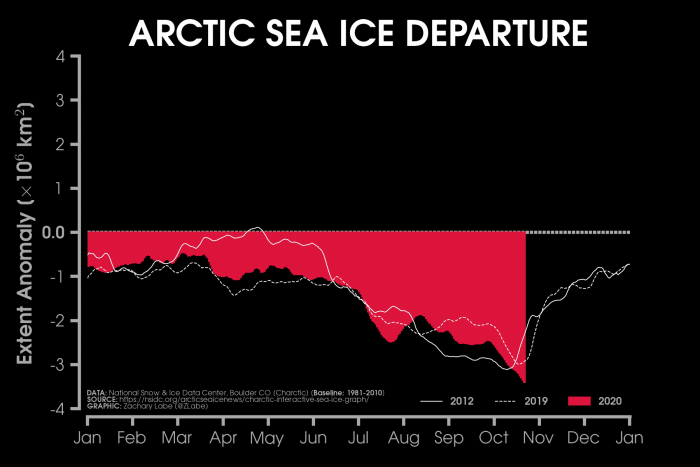
Comparing the years by the current date, we are well the lowest for this time of year. That is also evident by the second image, which shows the sea ice anomaly, compared to the long-term average. It shows the 2020 (red area) ice extent anomaly to continue to increase, while in the previous years (white lines), the anomaly already started to decrease by this point.
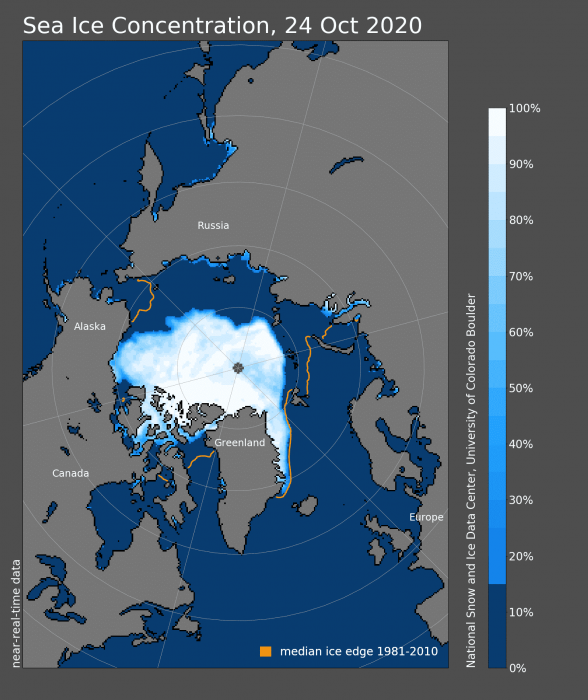
The analysis image by the National Snow and Ice Data Center (NSIDC) below, shows the current ice concentration and the average/normal long term extent in orange lines. Those orange lines show how far the sea ice should be reaching at this point in time, revealing a huge ice deficit.
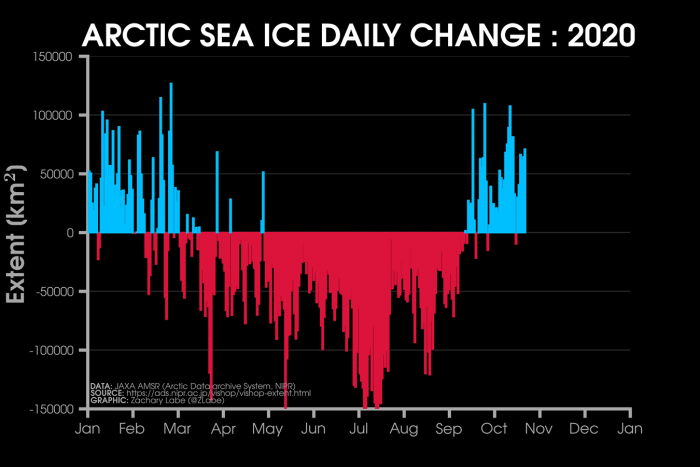
Growth has obviously begun since mid-September, but the rate was rather weak and is not increasing with time, evident by the recent daily increase rate on the image below. At this point, the daily growth should slowly increase over time, but we can see the daily growth area is not increasing and has rather been almost decreasing over time. The second image shows the October growth compared to previous years, where 2020 is severely trailing behind

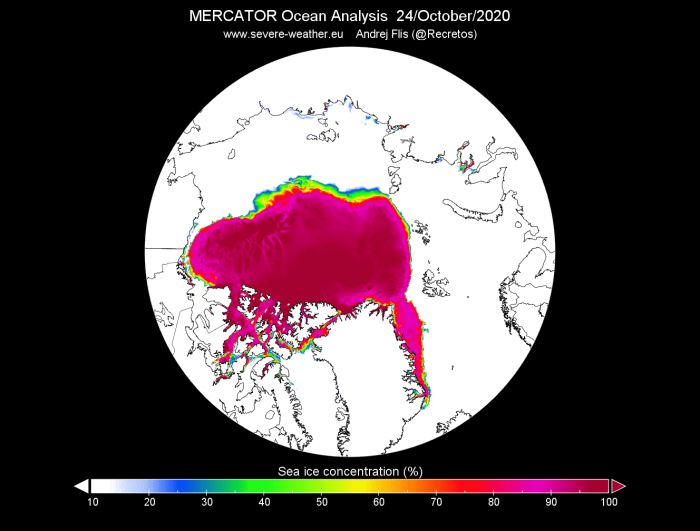
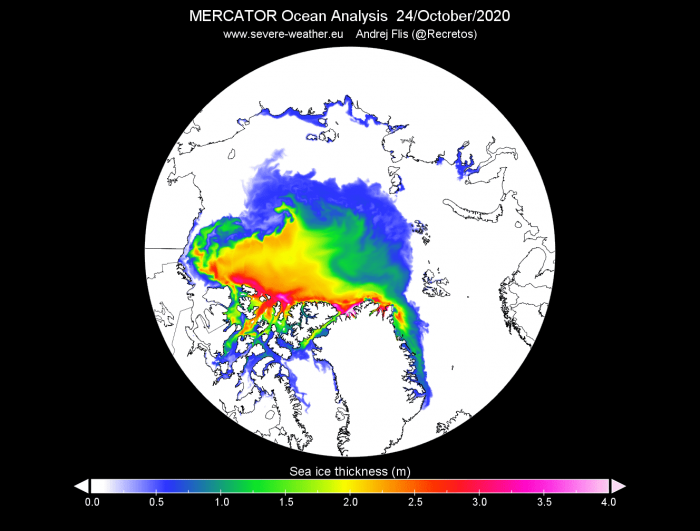
Images below show the current sea ice extent and thickness. We can see that the thickness shows a larger area than the concentration. That is because the concentration shows only the sea ice above 15% concentration. Anything below that means the ice is just too fractured and not compact enough.
So the sea ice thickness image reveals that there is thinner uncompacted ice around the edges, which falls below the 15% concentration threshold. This is usually normal because new sea ice is just starting to form on the edges and takes time to get more compact. But this year the ice is not compacting so fast, and we are now going to look at what is behind this unusual event.
THE VAST ARCTIC OCEAN
The Arctic region is in fact entirely an ocean and has no large-scale landmass. It is the smallest and shallowest of the world’s five major oceans, and also the coldest. It is also the only ocean smaller than the largest country in the world by area, Russia.
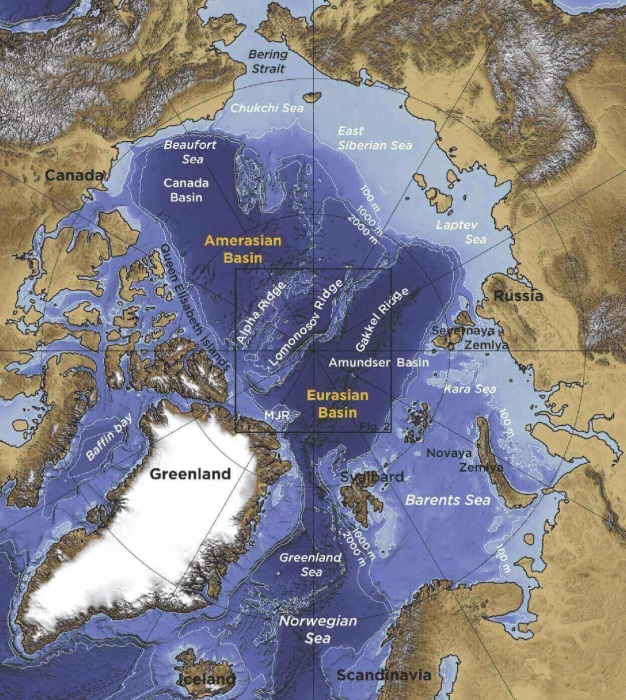
The image below shows the Arctic ocean, as it would look without water, revealing a very complex underwater terrain. To understand the current unusual sea ice anomalies, we need to understand the ocean where all the ice floats on. More specifically, we need to understand the state of the ocean in its eastern region, in the Kara Sea, Siberian Sea, and the Laptev Sea. The image below shows these regions in the Arctic Ocean, found on the side opposite to Greenland. The graphic is from one of the more recent Arctic Ocean studies.
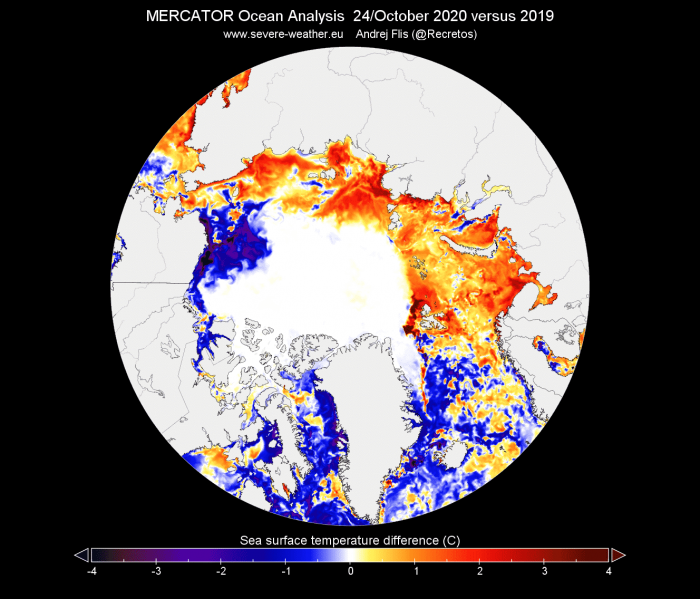
The image below is probably the most important one so far, as it shows the ocean surface temperature anomaly. It shows the ocean temperatures are currently well above normal around the entire Arctic ice sheet. Anomalies of over 2-3 degrees Celsius can be found across all the 3 critical ocean regions we mentioned above.
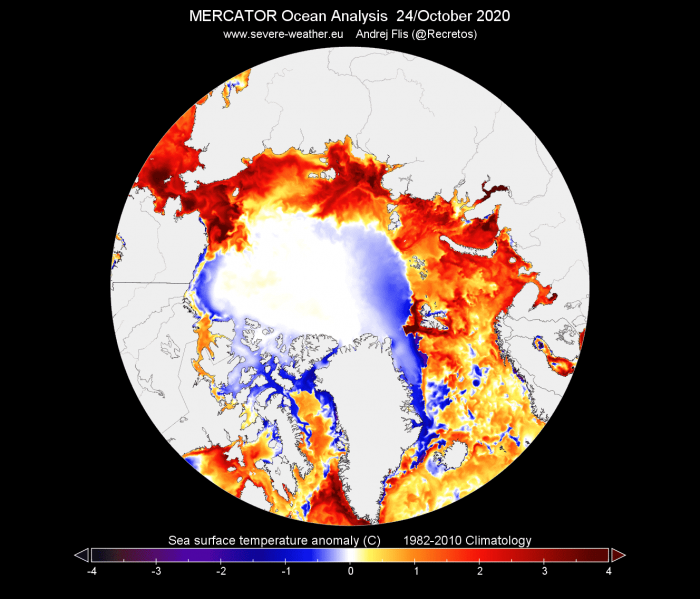
Compared to this time last year, the Atlantic side is actually colder this year, while the eastern Arctic Ocean is obviously much warmer than it was this time last year.
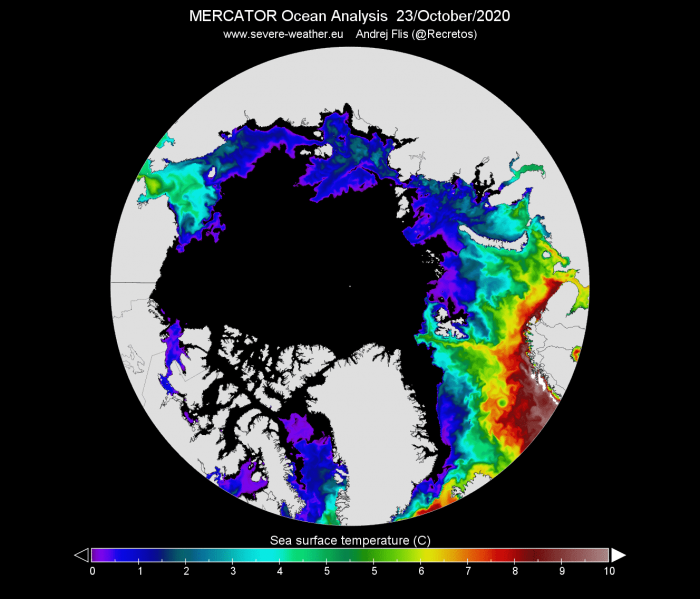
Also looking at the raw temperatures, we can see the eastern Arctic ocean is actually in positive surface temperatures, which means a low to zero chance of freezing over at this point. In normal conditions, almost the entire Arctic ocean should be at or below the freezing point – 0°C (black color) by the end of October.
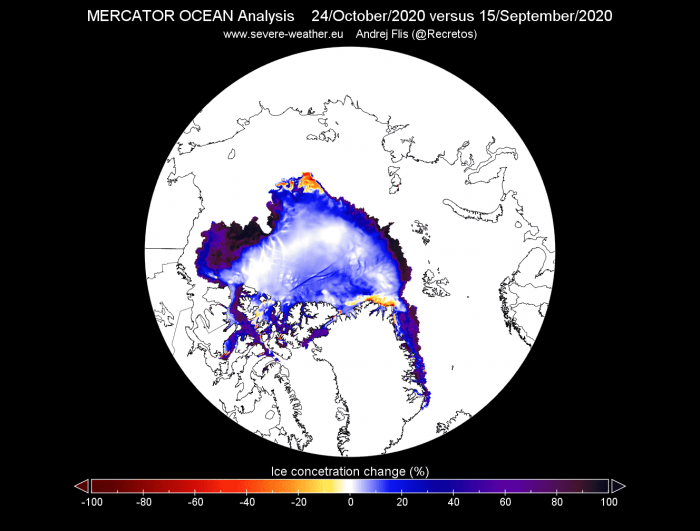
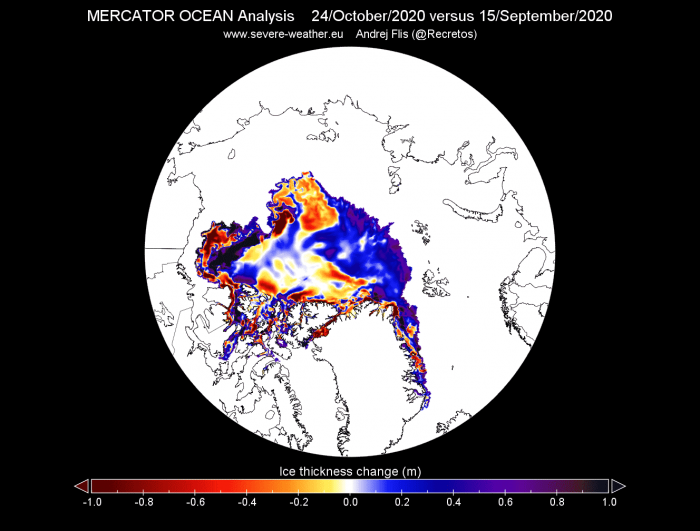
When comparing the current ice concentration and thickness with the lowest ice extent in mid-September, we can see the growth on the edges. But towards Siberia, we can actually see a reduced concentration and reduced thickness (red colors). Ocean and air temperatures were not yet right to allow rapid refreeze towards Siberia at present time.
But temperature is not the only factor here. Ocean salinity also plays a big role in the production of ice. The saltier the water, the colder it needs to get for ice to form. Think of salt being used on the roads to prevent ice buildup.
The image below shows the Arctic ocean salinity, where we can see the fresher water in blue colors, and saltier waters in brownish hues. Transport of saltier water is obvious from the North Atlantic into the Arctic Ocean, specifically towards the eastern parts. Interestingly, we can see the dark colors around the coastal areas, which is very fresh water. That is the freshwater discharge from the Siberian rivers.

We produced a short but very cool high-resolution video animation, which shows the Arctic ocean salinity in the past 5 months. You can see the ocean circulation, ocean currents, and the saltier water transport from the North Atlantic. Also note the freshwater entering the Arctic from the Siberian side, as the rivers discharge into the ocean, and note the freshwater increase during Summer, as melting ice makes the surface waters fresher.
Arctic Ocean salinity flow 2020 (click to play)
Arctic Ocean water salinity and surface currents during 2020 melt season - SWE /FA
SEA ICE ACROSS REGIONS
Many regions have regained ice since the lowest point in mid-September. But as we have shown above, the east Arctic Ocean is unusually warm and prevents fast sea-ice expansion.
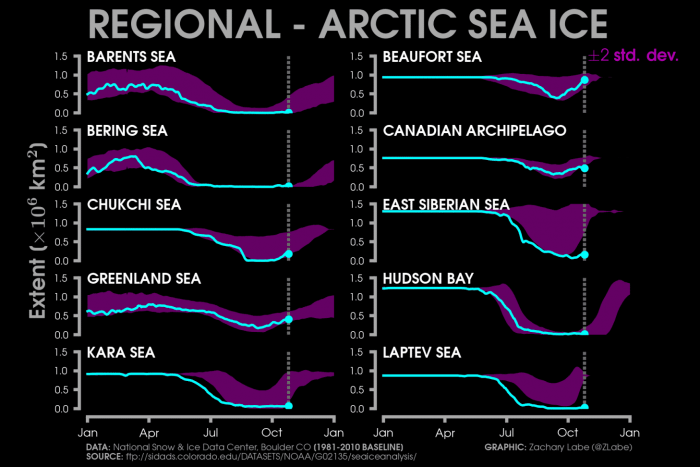
The image below shows the sea ice extent by various regions across the Arctic. While some regions normally start the freezing at a later date, there are 3 regions that stand out, as they should be much higher than they currently are. The Siberian Sea region, the Kara Sea, and the Laptev Sea. These are the regions that we have highlighted higher up in the article, which also face the biggest temperature anomalies.
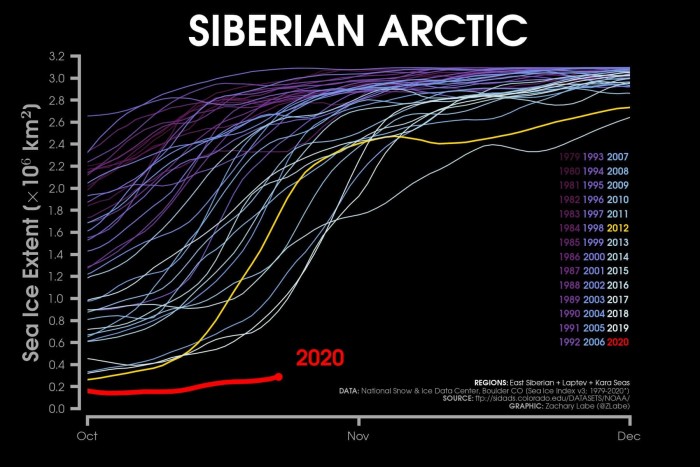
Looking at the Siberian Arctic region, it is struggling to increase the ice extent. It is running really unusually low for this time of year, having just a few % of the normal sea ice extent expected for this date.
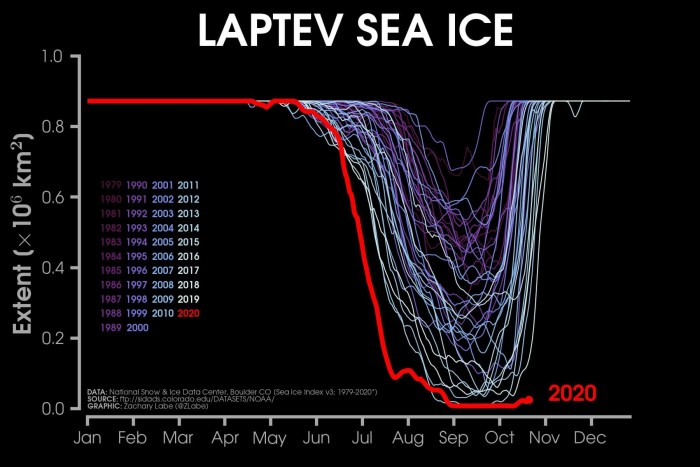
And of course, the Laptev Sea, which has been at record low levels for quite some time now. In the previous decade, the Laptev Sea has been entirely frozen over by this time of year, while this year it simply cannot lift off the ground.
But what is causing this unusual situation in the eastern Arctic Ocean? We have seen the ocean temperature anomalies and ocean salinity. But what has brought the Arctic Ocean into this state? Part of the answer lies in the Atmosphere, which is where we are heading next.
FROM THE OCEAN TO THE ATMOSPHERE
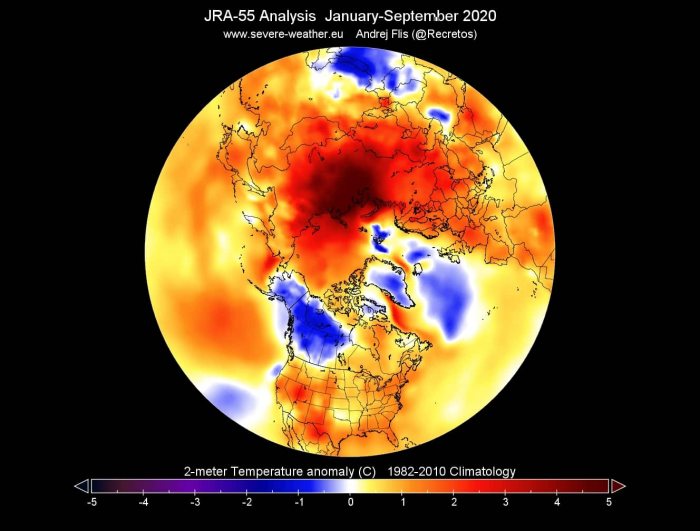
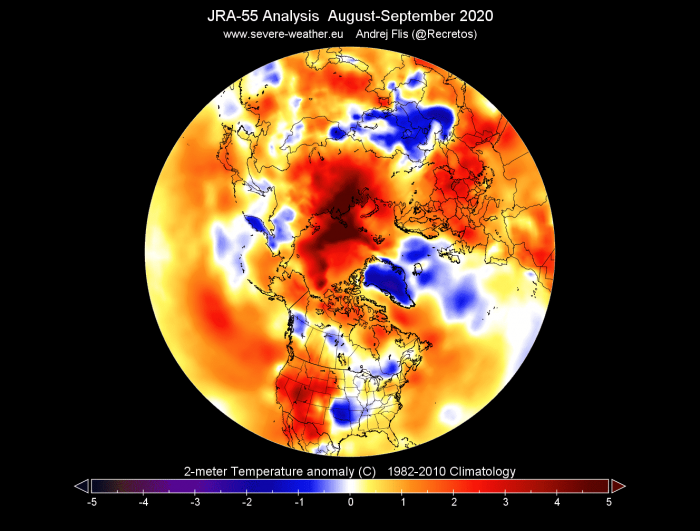
In the atmosphere, we usually always start with the temperatures. Looking at the January-September period, we can see that a hotspot has developed right over Siberia and the eastern Arctic Ocean. We can see a large area of temperatures 4-5°C above the long term average. We wrote about these Arctic heatwaves, which were ongoing since Spring.
A closer look at the August-September period reveals an even stronger hotspot, now expanded further into the Arctic Ocean, as the sea ice melted and more open water was exposed to the warmer weather.
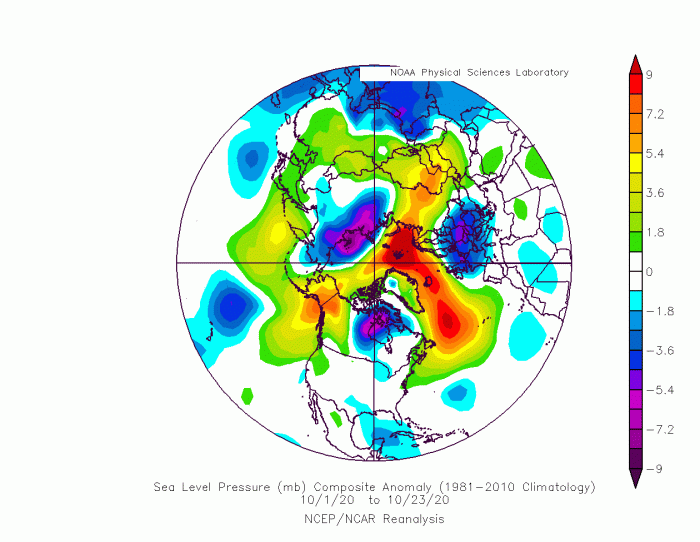
The reason behind this anomaly was a very specific pressure pattern. The October analysis so far, shows the high-pressure area dominating the Arctic region, while we can see a low-pressure system over the Siberian side.
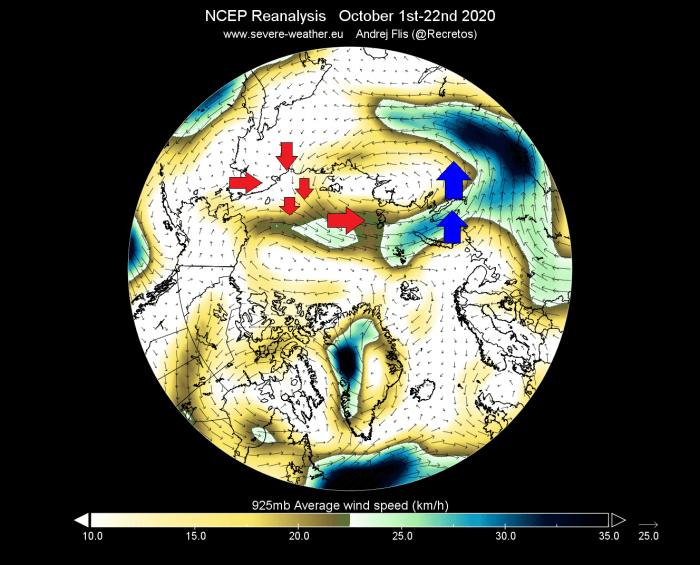
Such a pattern creates a very unique transpolar airflow over the eastern Arctic Ocean. The image below shows the average low-level wind flow in October so far. We can see the air transport across the Arctic, as warmer air enters the Arctic from one side, and cooler air leaving out on the other side.
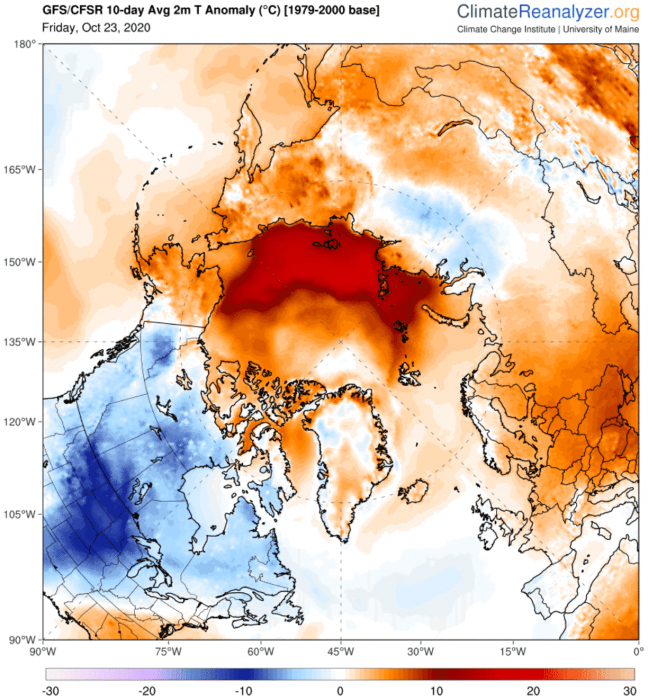
Looking at temperature anomalies in October so far, we can actually see a massive warm anomaly across the Siberian Arctic. That is where the warmer air was entering the region, replacing the colder air moving out into western Siberia.

The past 10 days specifically, have seen anomalies in excess of 15°C across the Siberian Arctic ocean. This, together with the warmer ocean waters, has been a large ice growth inhibitor so far in October.
The forecast is not looking any better. The pressure pattern has now actually reversed, with lower pressure over the Arctic. But this will change the airflow direction, just bringing warmer air from another source region. The first image shows the pressure anomalies next weekend. The second image shows the wind direction and temperature anomalies, revealing a large scale warmer air transport into the Siberian Arctic.
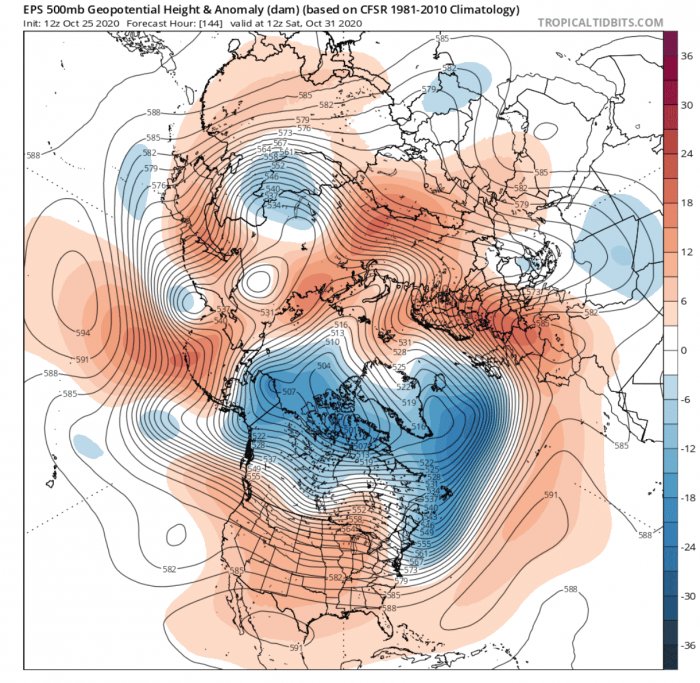
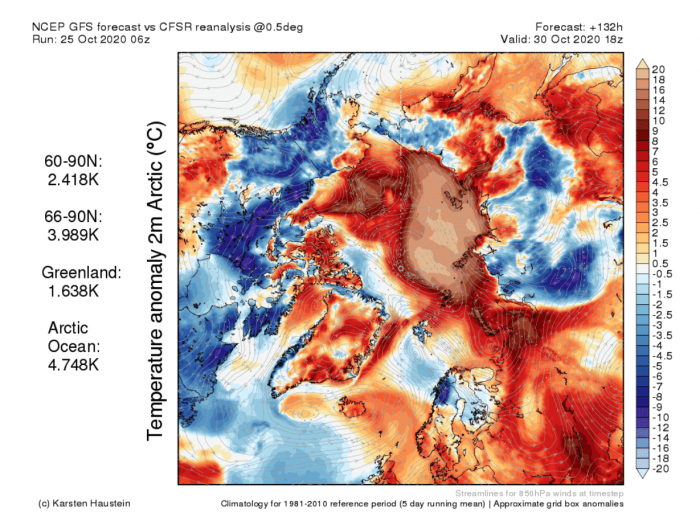
But of course, this does not mean that +20°C temperatures will be measured across the Arctic in October. The normal temperatures for the Siberian region for example should be around -15°C. If the temperatures in this wave will be around 0 to -2°C, that is still 13-15°C above the long-term average.
This is what we are seeing on the last temperature image above. But still, such anomalies mean that the Arctic is not as cold as it is supposed to be at this point in time, creating inhibiting conditions for ice growth.
The images below show the forecast 9-day sea ice extent and thickness change. We can see the expansion of sea ice towards Siberia, but the Siberian Arctic and the Laptev sea are still running very ice-free.
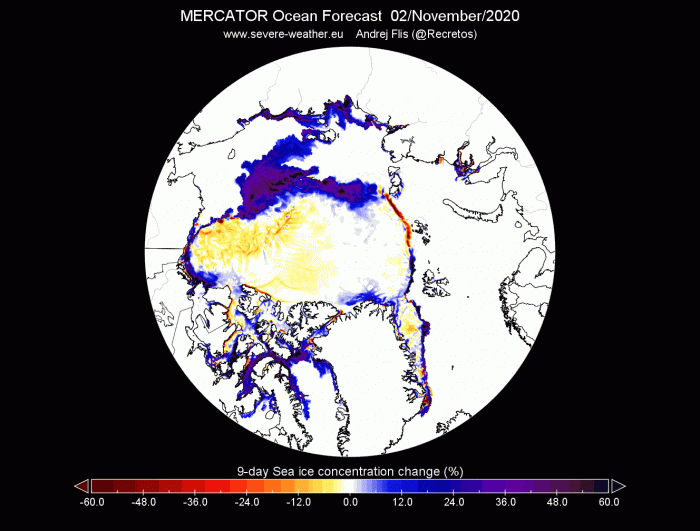
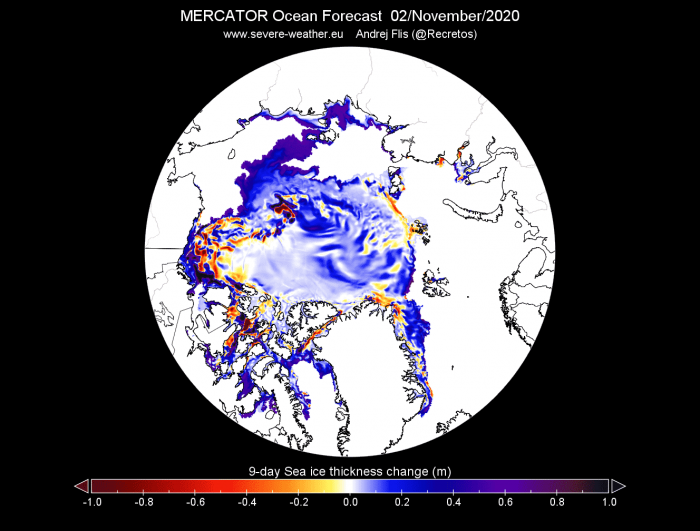
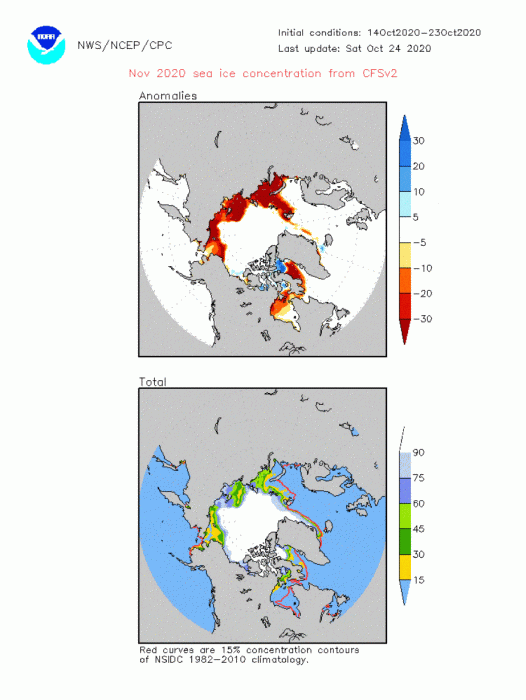
The CFSv2 model forecast for November 2020 shows the slow expansion of sea ice, with unusually low ice concentration (red colors) towards the Siberian side, extending into November.
SEA ICE AND WINTER 2020/2021
There is always a lot of debate about how the lack of sea ice affects weather development. A lot of studies have been made, and all point in a similar direction, of the sea ice deficit having an effect on the jet stream (and vice versa due to feedback mechanisms).
The jet stream is a large and powerful stream of air (wind) at around 8-11km (5-7mi) altitude. It flows west-to-east around the entire hemisphere, affecting the pressure systems, their strength, and thus shaping our weather at the surface.
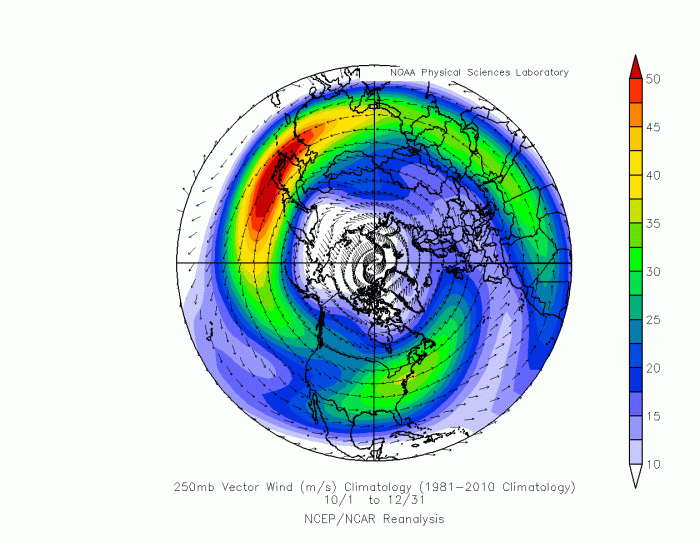
A perfect jet stream circles around the globe, as seen on the long term average image below. A west to east motion is called a zonal flow, which we can see on the image. If the motion is more north to south, that is called a meridional flow.
The secret of the jet stream is that it is fueled by the temperature difference between the cold arctic and the warmer southern/tropical regions. If the Arctic gets warmer, the temperature difference from the north to south decreases, and the jet stream can lose its strength.
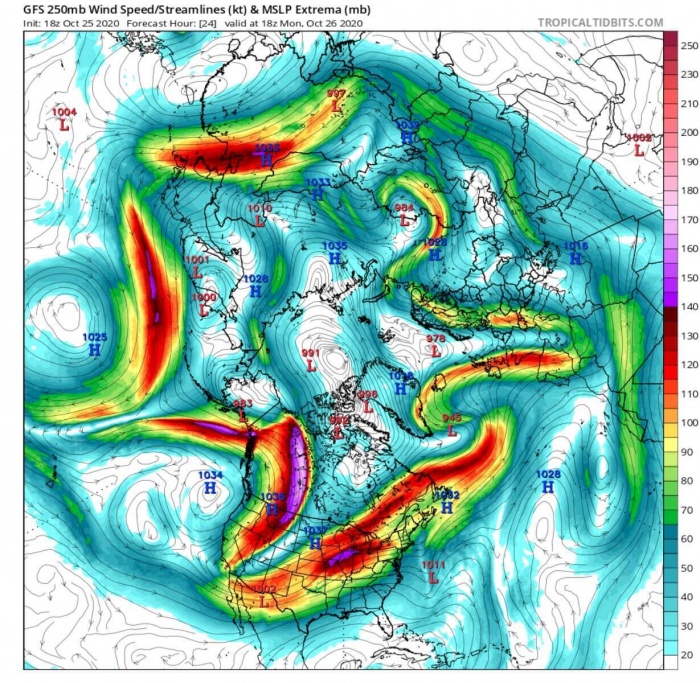
Below is an example of the jet stream in the forecast. Red-violet areas show stronger wind speeds at the 250mb level (~10.5km / 6.5mi). We can see that the strongest jet stream is positioned over the North Pacific, extending directly over North America, where a powerful cold air outbreak is ongoing.
The jet stream dropped down into the continental United States, unloading an Arctic airmass over a large part of the country. We can see that the jet stream is not perfectly in a zonal (west-east) flow, but is quite wavy and also meridional (north-south), especially over North America and Europe.
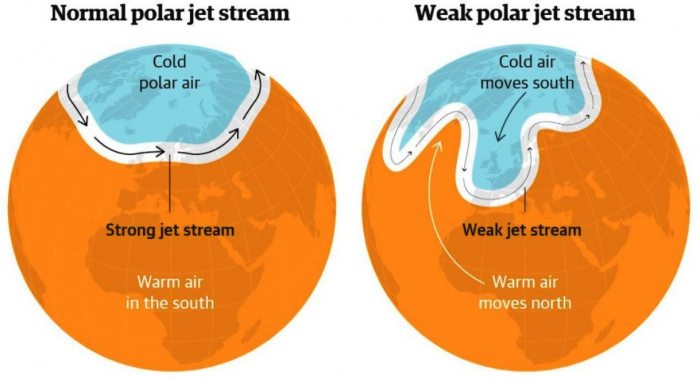
The general idea behind the sea ice melt is that it exposes more open waters. The ice-free open water can get warmer when exposed to the sun and constant higher than normal temperatures. This is something that we are observing this year. It means that the overall Arctic temperatures are getting warmer, potentially reducing the temperature difference between the north and south regions, and overall weakening the jet stream.
If the jet stream is weakened, it means that it can be easily disrupted and can change its flow from perfect west-east to more north-south. That can cause more dynamic weather and extremes, as colder air can move more freely from the north down, and warmer air from the south upwards.
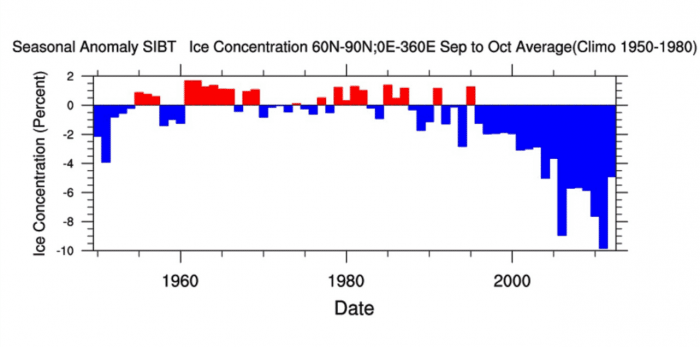
Looking at some past data, we produced two graphs. The first graph shows the Arctic sea ice concentration for the September-October period in the 70 years. We can see a pretty significant ice concentration decrease since the mid-’90s.
The second graph shows the meridional flow (north-south) in the jet stream in the Autumn period (Sep-Oct-Nov). Here we can also observe that there is more north-south meridional flow being detected in the jet stream circulation since the mid-’90s.
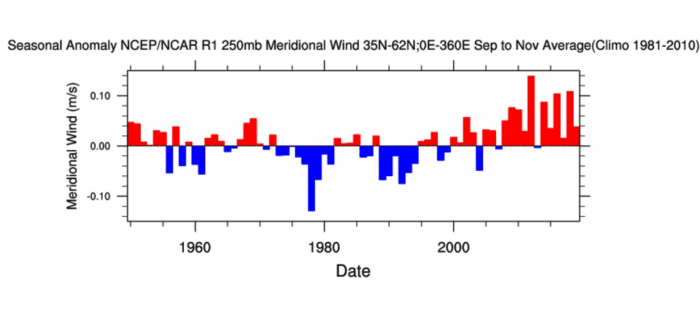
One could argue that this proves the jet stream is getting weaker or more wavy as the Arctic sea ice is reducing. But this needs more research, as it can go both ways. But it is an indication of a very likely and logical connection, that the jet stream is getting weaker or wavier as the sea ice is reducing.
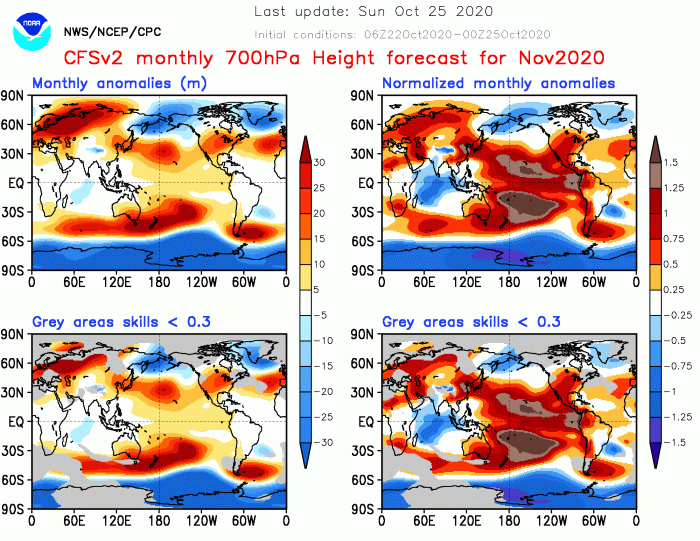
Looking at the November 2020 forecast by the CFSv2 model, we can see strong high and low-pressure systems, producing a very dynamic pattern. This will mean more north-south jet stream flow, with temperature extremes in both directions.
What about Winter 2020/2021? As we head towards winter, the connection/effect of the lack of sea ice is getting blurred or not so clear. There is a known effect on the jet stream, as we discussed. But when winter arrives, we have a lot of external factors that mask or reverse a potential sea ice effect.
The first factor is that by the time winter arrives, the Arctic sea ice is already regrown to a certain extent, not exposing so much (or none) open water. The second factor is the Stratospheric Polar Vortex. A strong polar vortex can influence the jet stream and potentially make it stronger, creating a more west-east flow and milder winter across North America and Europe.
But the strength of the polar vortex is also determined by the weather patterns, so here we have a very delicate feedback loop. The sea ice (or lack thereof) can influence the weather patterns, which affects the polar vortex, which then affects back at the jet stream and the weather patterns.
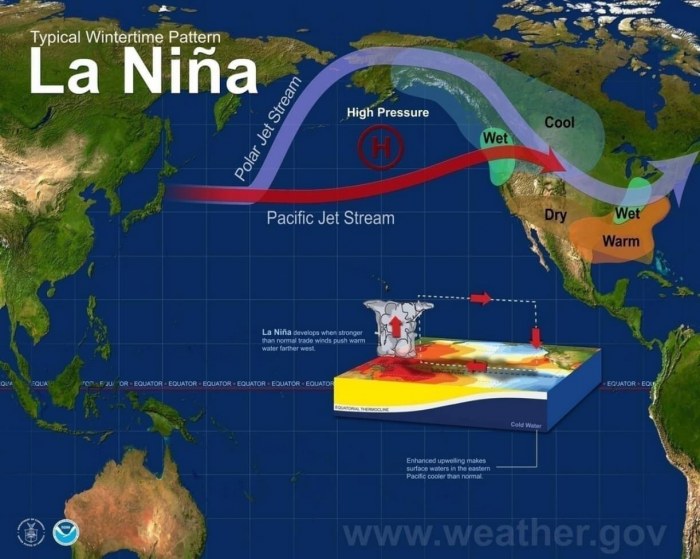
The third factor is the tropical ENSO region, with its developing La Nina phase. A La Nina has a very specific effect on the jet stream, which can override other potential effects from the sea ice. And it can also affect the polar vortex. The image below shows the typical La Nina influence on the jet stream over Canada and the United States during winter.
Sounds complicated? In fact, it is quite simple, as the main takeaway is that everything can influence everything to a varying degree. So the lack of sea ice has an effect on the jet stream, but it gets mixed towards winter with other global factors.
More often than not, a severe lack of sea ice would indicate a tendency for a higher pressure over the North Pole, which means that colder air could move more freely from the Arctic down into the mid-latitudes of the United States and/or Europe. But perhaps not doing it directly, with sea ice deficit being more as a mechanism to weaken the polar vortex, and thus weakening the overall jet stream and creating more north-south flow situations.
So we can know for sure that the current lack of sea ice will have an effect to some degree, but it is quite hard to tell how exactly. Even a small change or a shift in the current conditions can have a cascading effect towards winter, also known as the butterfly effect. Sometimes it is the small changes like this, that can cause a weather season to turn out different than expected, defying all the model forecasts.
We will keep a close eye on the long-range winter forecasts, searching for different trends and indications of potential jet stream fluctuations during Winter 2020/2021.
We wrote an entire article on the La Nina, what it is and what is its winter jet stream influence, so make sure to check it out:
La Nina watch: Exceptional cooling continues in the equatorial Pacific. La Nina now gradually intensifies, on time for Winter 2020/2021
No comments:
Post a Comment