Satellites reveal Arctic rivers are changing faster than we thought

A civil and environmental engineering researcher at the University of Massachusetts Amherst has, for the first time, assimilated satellite information into on-site river measurements and hydrologic models to calculate the past 35 years of river discharge in the entire pan-Arctic region. The research reveals, with unprecedented accuracy, that the acceleration of water pouring into the Arctic Ocean could be three times higher than previously thought.
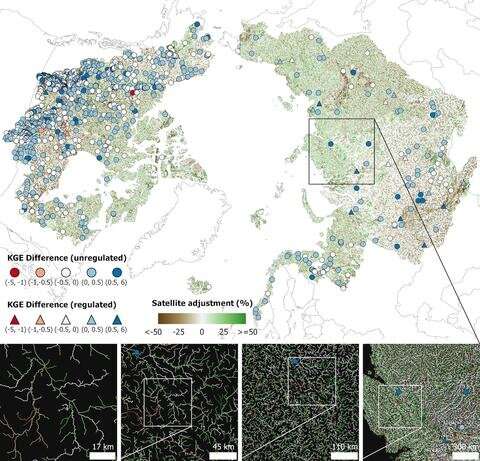
The publicly available study, published recently in Nature Communications, is the result of three years of intensive work by research assistant professor Dongmei Feng, the first and corresponding author on the paper. The unprecedented research assimilates 9.18 million river discharge estimates made from 155,710 orbital satellite images into hydrologic model simulations of 486,493 Arctic river reaches from 1984-2018. The project and the paper are called RADR (Remotely-sensed Arctic Discharge Reanalysis) and was funded by NASA and National Science Foundation programs for early career researchers.
"We recreated the river discharge information all over the pan-Arctic region. Previous studies didn't do this," Feng says. "They only used some gauge data and only for certain rivers, not all of them, to calculate how much water is pouring into the Arctic Ocean."
"This is a new, publicly available daily record of flow across the global North," adds Colin Gleason, civil and environmental engineering professor and principal investigator on the study. "No one has ever tried to do it at this scale: Teaching the models what the satellites saw daily in half a million rivers from millions of satellite observations. It's a very sophisticated data assimilation, which is the process of merging models and data."
River discharge integrates all hydrologic processes of upstream watersheds and defines a river's carrying capacity. It is considered the single most important measurement needed to understand a river, yet the availability of this information is limited due to a lack of reliable, comprehensive, publicly available data, Feng says.
Physically gauging rivers—the "gold standard" for gaining discharge information—is expensive and labor-intensive to install and maintain because gauges need to be physically recalibrated several times a year. Also, rough terrain around some rivers can make gauge installation very difficult. This makes it more practical for studies in this region to focus on larger rivers that empty into the Arctic Ocean, so many small rivers are not gauged at all. Also, some countries don't make their gauge information publicly available. That leaves hydrologists and environmental scientists in the dark about a tremendous number of rivers, Feng says.
"This is one major contribution of our work, because we can provide river discharge information everywhere, especially for the Eurasia region," says Feng. "Satellites are like a gauge in space. If we don't have a gauge in place on the rivers, we can use the satellite to improve the data we have now."
Traditional studies have had to rely on limited gauge information or on simulations based on a representative sample of rivers. Feng's work focuses on all Arctic rivers that eventually drain into the Arctic Ocean, Bering Strait, and the Hudson, James and Ungava bays. It excludes the Greenland Ice Sheet.
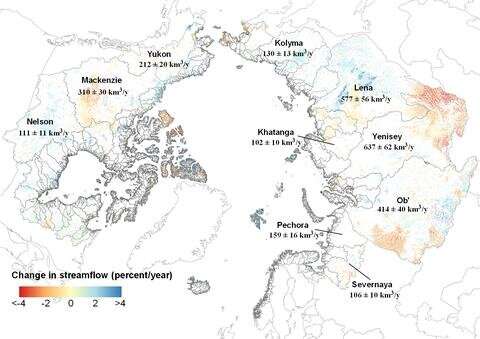
One of RADR's major findings is that the acceleration in pan-Arctic river discharge over the past 35 years is 1.2 to 3.3 times larger than previously estimated.
"This is the new reality that we've actually experienced, rather than a projection of what might happen. RADR looks into the past and shows that up to 17% more water than previously thought has already gone into the Arctic Ocean," Gleason says of RADR's findings.
The increase in water discharge was not homogenous, however.

"We found very significant regional differences," Feng says. "Some places showed an increase, but others showed a decrease. We also found that North America and Eurasia show different patterns."
"For example, Mongolia is actually getting drier, as are parts of the interior Mackenzie River," Gleason says.
As more satellites launch, the data provided by RADR will only become more accurate. "We can improve even more significantly, because we have built up this method and with this framework, we can very easily assimilate more satellite data, and with more data we can for sure improve more," Feng says. "This is an exciting and also promising direction."
Feng is making the system open access in the hopes that those studying other aspects of the Arctic, such as climate change, will use it to obtain new calculations of factors like river sediment, rainfall, and carbon emissions.
"I'm really excited that not only did we do this, but that we're making it public and just putting it out there and anyone can download it and use it," Gleason says. "I'm hoping this becomes a standard global data set for anyone who studies the Arctic across any of the natural sciences."
"This is a really huge amount of information we can use for a lot of applications, like water resource management, hydropower, or other infrastructure impacted by rivers," Feng says. "We can also improve the global river discharge simulation's accuracy significantly."
But the work has implications far beyond the Arctic, she adds.
"Because we show satellites can help us improve the accuracy of [measurements of] river discharge, we can use it to improve the data for river discharge all over the world," she says.
The RADR framework "is a vector-based product, so it looks like a river network, and it's going to be publicly available flow in literally half a million rivers, as narrow as three meters," Gleason says.
Now that RADR has shown that previous predictions of river discharge are inaccurate, models using the new findings will have to be created.
"Now that we know this about the past, how does that change our future predictions? That's where we're going next," Gleason says. "Climate change, ecology, pollution and sediment—those are the big things that will dramatically change."
Water meters help scientists quantify river runoff
More information: Dongmei Feng et al, Recent changes to Arctic river discharge, Nature Communications (2021). DOI: 10.1038/s41467-021-27228-1
Journal information: Nature Communications
Provided by University of Massachusetts Amherst
No comments:
Post a Comment