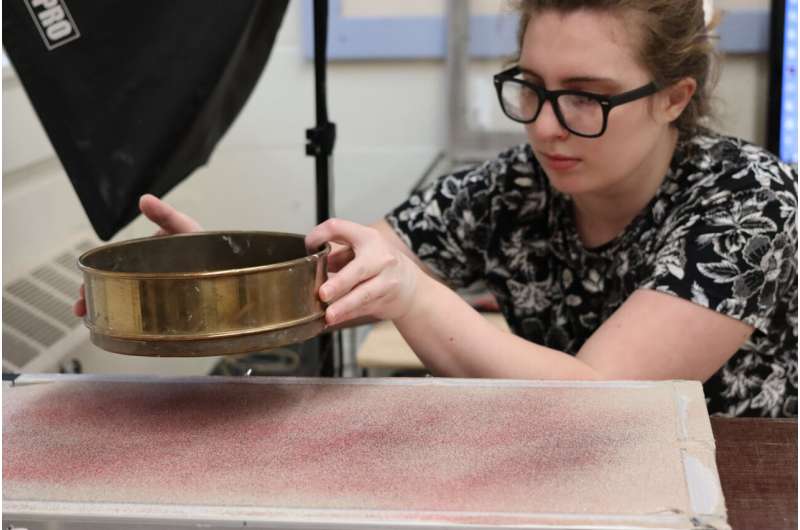
How fault lines in a kitchen sink are changing what we know about geology

In a new paper recently published in the journal Geology, researchers at the University of Massachusetts Amherst unveiled a physical model that yields an unprecedented, high-resolution look at the slip rates of faults, which determine the likelihood of earthquakes.
When most of us picture a fault line, we imagine a giant crack in the earth where two tectonic plates smash into each other. When geologists think of faults, however, they see a branching system made up of thousands of individual faults. "The closer you look," says Michele Cooke, one of the paper's co-authors and a professor of geosciences at UMass Amherst, "the more you find, and when you look in detail, the picture gets very complicated."
Such complexity makes it difficult to accurately understand what is happening at any given place in the system—let alone to predict when an earthquake will occur, and where. To blur the picture even more, the vast majority of individual faults are buried under feet of dirt or obscured by vegetation, and so can't be directly observed. Finally, fault systems evolve over the course of thousands, tens of thousands, or even millions of years. Therefore, geologists have traditionally generated generalized slip rates for entire fault systems and theorized broadly about how fault systems evolve.
In a new study, the authors used a physical model, "about the size of a kitchen sink," says Hanna Elston, the paper's lead author and a graduate student in geosciences at UMass Amherst, and filled it with a carefully composed kaolin clay, "about the consistency of Greek yogurt," that behaves much like the earth's crust. At the bottom of the model are two plates that can be precisely moved. Elston and her co-authors then carefully cut the clay, to form a fault, and, over the course of four hours, which simulated a million years, moved the plates 12 centimeters, all the while taking pictures with an array of overhead cameras, which they could then analyze to uncover the slip rates and mechanics of their modeled faults.
The precision of the first-of-its-kind technique that Elston and her co-authors developed allows them to track slip rates at specific locations along faults, with an unprecedented fidelity, which can then provide a record that researchers can directly compare to field studies to estimate the slip rate at any particular point along a fault.
Not only does the model perform in ways that mirror real-life faults, it allowed Elston and her colleagues, including Cooke and Alex Hatem, now at the U.S. Geological Survey, to observe two different phenomena that no one else has seen before. First, the model shows that slip rates can change at a particular site on the fault as that fault evolves. Second, the team showed that slip rates are interactive: the rate can change at many different points along one fault in response to changing slip rates at other, nearby faults.
"This study gives us the finest-grained picture yet into how faults evolve, which could be used to help the assessments of seismic hazards," says Elston—and it's only the start. The research in this paper, which was supported by the National Science Foundation, represents a proof-of-concept for the team's analytical techniques. Future will detail make 3D reconstructions of different faults' evolution.
A video overview of the team's model is available from YouTube:
More information: Non-steady-state slip rates emerge along evolving restraining bends under constant loading, Geology (2022). DOI: 10.1130/G49745.1
Journal information: Geology
Provided by University of Massachusetts Amherst
No comments:
Post a Comment