Report: LGBTQ Americans tend to be younger and have no religion
The new report from PRRI also found that many religious Americans support LGBTQ nondiscrimination rights, even those who oppose same sex-marriage.

(RNS) — For the most part, religious Americans say their LGBTQ neighbors should be free of discrimination when they are at work, in public or at home.
This is true even among groups that oppose same-sex marriage
One place they disagree is over whether businesses — such as cake bakers or other vendors — ever have the right to refuse service. On that issue, Americans are split along religious and party lines.
Meanwhile, almost half of LGBTQ Americans are young and claim no religion.
Those are among the findings of a new report on polarization and LGBTQ rights from the Washington, D.C.-based Public Religion Research Institute. The report, based on data from PRRI’s 2022 American Values Atlas, looked at the views of 22,984 adults living in all 50 states.
PRRI’s researchers found that about 10% of Americans overall — almost half (46%) of them under the age of 30 — identify as LGBTQ: 3% as gay or lesbian, 4% as bisexual and 2% as something else. Nearly one-quarter of Americans under 30 identify as LGBTQ (23%).
According to the report, LGBTQ Americans are more likely to have no religious affiliation (50%) than Americans in general (26%). They are also much more likely to be Democrats (48%) than Republicans (8%).
Among non-Christian Americans, about 1 in 5 identify as LGBTQ, according to the report.
“This includes 19% of Unitarian Universalists, 19% of the religiously unaffiliated, 15% of Buddhists, 11% of Jews, 9% of Muslims, 5% of Hindus, and 32% of members of other non-Christian religions,” according to the report. “Members of Christian religious traditions are less likely to identify as LGBTQ, with the exception of Hispanic Protestants (12%).”

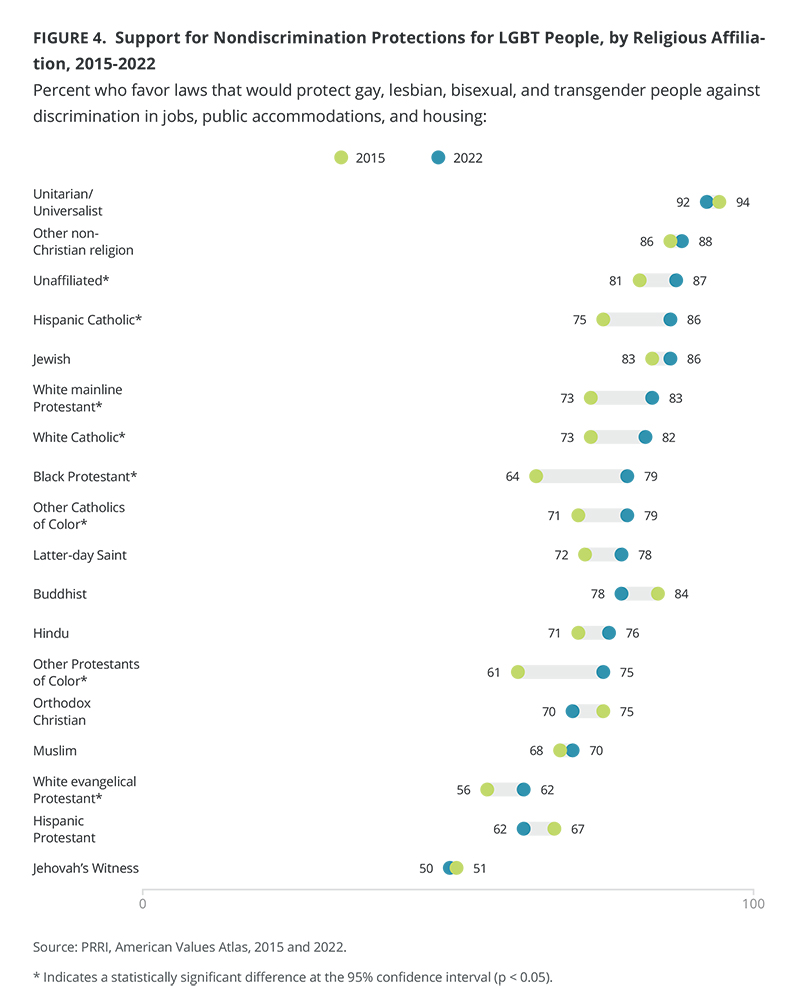
“Support for Nondiscrimination Protections for LGBT People, by Religious Affiliation, 2015-2022” Graphic courtesy of PRRI
Researchers from PRRI found that most religious groups, from 92% of Unitarian Universalists to 62% of white evangelical Protestants, support anti-discrimination laws. This includes Jews (86%), Hispanic Catholics (86%), Black Protestants (79%), Latter-day Saints (78%), Hindus (76%) and Hispanic Protestants (62%). Jehovah’s Witnesses (50%) are the religious group least likely to support such laws.
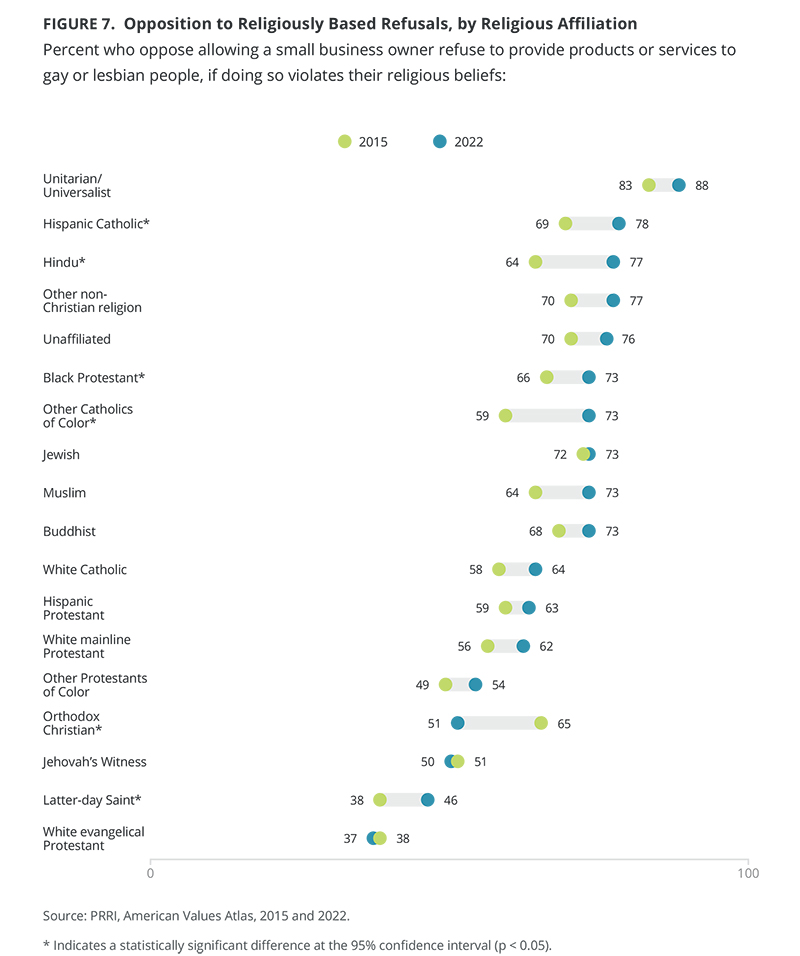
When it comes to views of small businesses that want to refuse to provide products or services to lesbian or gay people, faith groups were more divided. Unitarian Universalists (88%), Hispanic Catholics (78%), Hindus (77%) and people of other non-Christian faiths (77%) were most likely to oppose the idea of refusing service. White evangelical Protestants (37%), Latter-day Saints (46%), Jehovah’s Witnesses (50%) and Orthodox Christians (51%) were less likely.
The PRRI’s report found a wide variation in views along political lines. Ninety percent of Democrats said they favor nondiscrimination laws that protect LGBTQ people in jobs, public accommodations and housing. Fewer Republicans (66%) favor such laws.
Democrats are twice as likely to oppose rules that allow small businesses to refuse service to gays or lesbians (86% compared with 41% of Republicans).

“Opposition to Religiously Based Refusals, by Religious Affiliation” Graphic courtesy of PRRI
“Nationally, PRRI continues to find that most Americans broadly support LGBTQ rights in 2022,” said Melissa Deckman, CEO of PRRI. “At the same time, partisan polarization is growing on some measures, including on religiously based refusals of service to LGBTQ Americans by business owners.”
Deckman noted that these differences are striking amid the current politicization of issues involving LGBTQ rights and with a major ruling expected from the U.S. Supreme Court this term in regard to religious refusals by business owners.
In 2018, the Supreme Court ruled in favor of Colorado baker Jack Phillips, who refused to make a wedding cake for a same-sex couple; the court said the Colorado Civil Rights Commission mishandled the case. Phillips lost a state court appeal earlier this year on a different case concerning his refusal to make a cake for a transgender customer.
The court is currently considering the case of Lorie Smith, a graphic designer who wants to expand her business to make websites for weddings but said she would not make websites for same-sex weddings. Smith’s attorneys have argued that making a website is an exercise of free speech.

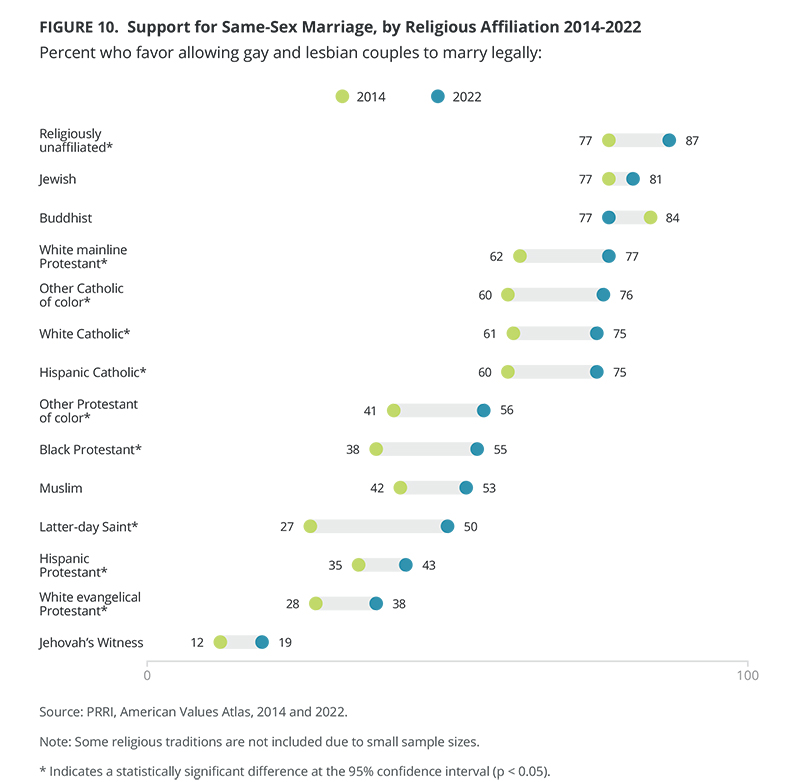
“Support for Same-Sex Marraige, by Religious Affiliation, 2014-2022” Graphic courtesy of PRRI
Researchers at PRRI also found continued disagreement among religious groups over same-sex marriage. Jews (81%), Buddhists (77%), white mainline Protestants (77%), and both white and Hispanic Catholics (75%) are among the most likely to support same-sex marriage. Jehovah’s Witnesses (19%), white evangelical Protestants (38%), Hispanic Protestants (43%) and Latter-day Saints (50%) are less likely.
Despite the opposition to same-sex marriage among Latter-day Saints, leaders in The Church of Jesus Christ of Latter-day Saints played a key role in supporting the Respect for Marriage Act, which was signed by President Joe Biden in late 2022. The law provided federal recognition of both same-sex marriage and interracial marriage — both of which had been previously made legal by court decisions.
No comments:
Post a Comment