by Hokkaido University

Associate Professor Yoshi N. Sasaki, Faculty of Science, Hokkaido University. Credit: Hokkaido University
Associate Professor Yoshi N. Sasaki, a specialist in Physical Oceanography, is involved in research into rising sea levels—particularly in coastal areas of Japan. He spoke about what he has learned so far about the relationship between ocean currents, sea level and climate change, what research he is currently focusing on, and the appeal of research that uses numerical modeling to uncover natural phenomena.
It is a common view among researchers that the global mean sea level is rising. The only question now is, by how much will it rise?
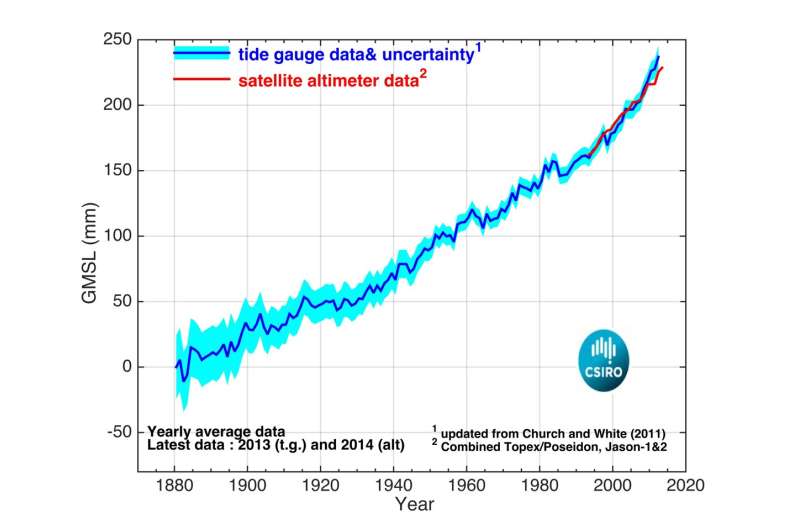
The graph below shows global average sea level, with tide-gauge data since 1880 and satellite data since 1993. It shows that the water level rose at a rate of about 1.5 to 2 millimeters per year in the 20th century, but has increased at a faster rate of about 3 millimeters per year in the 21st century. This speed is expected to increase further in the future as global warming continues.

Global mean sea level (1880-2014).
Credit: Copyright CSIRO Australia
Indeed, on the US coast, for example in Florida, many people live on low land, and sea levels are rising faster than in other areas of the ocean. In such areas, dike building and migration are already being considered.
Researchers are now focusing on detailed predictions of what will cause sea level changes, when, in which areas, and to what extent.
As this graph is a "global average," the actual situation at different locations is much more nuanced than this alone reveals. To clarify this, simulations using numerical models are being carried out.
Sea level is the sum of multiple factors
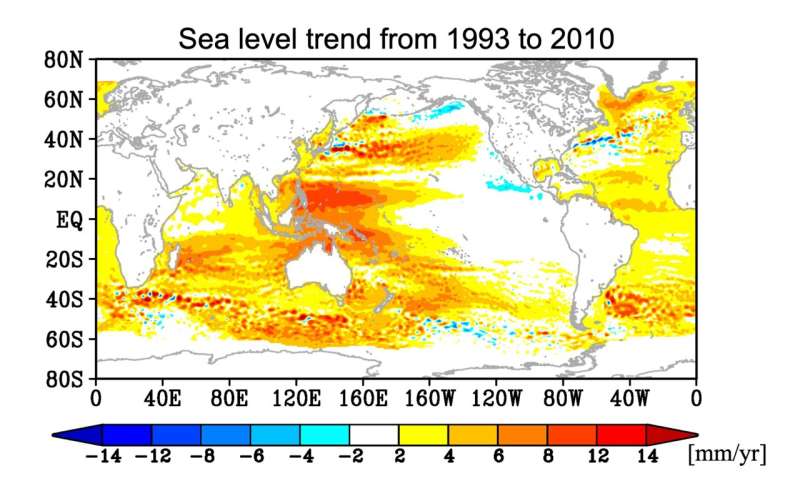
Sea level rise does not occur uniformly across the globe, but varies greatly from one ocean region to another. The causes also vary between global changes and changes in some ocean regions.
There are two main causes of sea level rise on average across the globe. The first is the thermal expansion of seawater due to warming caused by global warming. The second is the melting of glaciers and ice sheets due to global warming. Water that was previously trapped on land as ice flows into the sea, increasing the mass of seawater and causing sea levels to rise.
Play15 questions for climate change researcher Dr. Yoshi N. Sasaki.Credit: Space Time for Hokkaido University
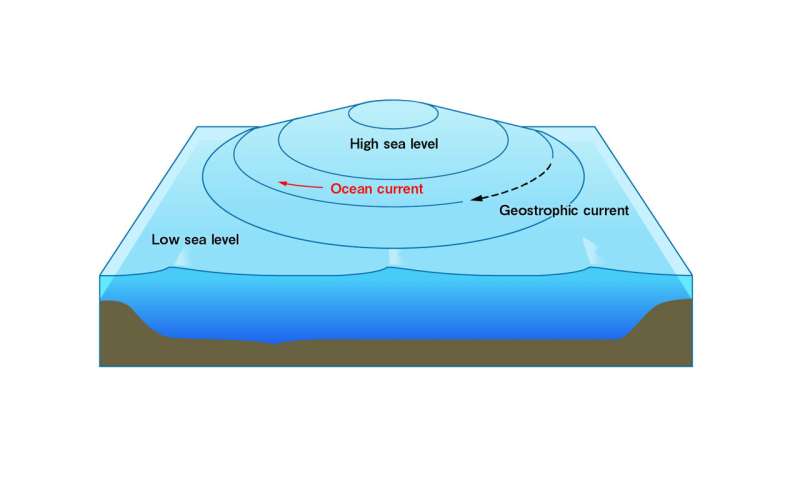
There are many different mechanisms by which sea level changes in different ocean regions. To give a few examples: one, variations in ocean circulation. Due to the physics of geostrophic currents, the sea level in the Northern Hemisphere is higher on the right side and lower on the left side in relation to the direction of the ocean currents. Two, changes in atmospheric pressure. Three, changes in the ground—the ground also sinks and rises, which changes the height of the coastal water table.
In other words, to predict sea level in an area, a combination of these factors needs to be taken into account. Specifically, the effects of each of these factors can be added together to estimate the actual rise in sea level, to some extent.
Understanding natural mechanisms using numerical models
My research involves computer simulations, using regional ocean models of the US. In principle, the model can reproduce the state of the ocean by feeding it with observed data such as atmospheric winds and temperatures.
For example, if we know that a change in water levels is caused by wind fluctuations, we can make predictions of future changes in water levels by knowing what the winds will be like in the future.
Although I simply said "By wind fluctuations," it is about understanding the mechanisms of nature. For me, it's something very enjoyable that satisfies my intellectual curiosity.
Naturally, it is not a straightforward process. Models are very complex, and to understand the mechanism, the model must first be able to reproduce the phenomena accurately. Once that is done, a "simpler model" that reproduces the same situation can be developed, revealing new principles hidden in nature. We need to look at the results of the complex models to find the essence of what is important.
When I was doing research in the US, I discovered a new mechanism that changed the ocean circulation. To someone outside the field, it would have looked like just a diagram, but after working on it for a very long time, it suddenly looked like important information that no one had ever seen before. This is the best part of research.

Sea level fluctuations vary from sea area to sea area.
Credit: Yoshi N. Sasaki
Water level fluctuations along the coast of Japan
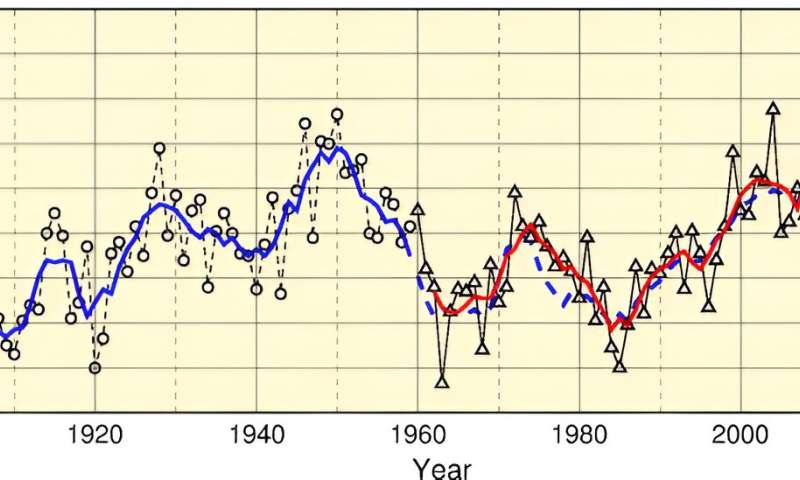
Water levels along the Japanese coast are also currently rising, but it is known that they did not rise all the way through the 20th century—they peaked once around 1950 and then fell.
Our research has shown that the peak around 1950 was dominated by wind effects. In particular, it seems to have been caused by fluctuations in ocean circulation due to wind fluctuations from a low-pressure system called the Aleutian Low. On the other hand, the rise in recent years has been found to be primarily due to the effects of heat and other factors at the sea surface.
Assessing the impact of typhoons and storm surges
In the future, typhoons and extratropical cyclones are predicted to become stronger. So far, research has been conducted on how sea level changes on long-term time scales of a decade or more, but the possibility that short-term fluctuations, such as storm surges, could cause major damage cannot be ignored.
In order to assess such impacts, we need to know exactly how typhoons and extra-tropical cyclones will strengthen in the future, and how this will affect sea levels. I am currently working on this with students, and we are hoping to get this project off the ground.

Mean sea level anomalies along the coast of Japan (1906-2020). Source: website of the Japan Meteorological Agency. Credit: Japan Meterological Agency


The sea level in the Northern Hemisphere is higher on the right side and lower on the left side in relation to the direction of the ocean currents. Credit: Yoshi N. Sasaki
Sea level rise is one aspect of the wider ocean
Right now, the resolution of ocean models for global warming simulations is approximately 100 kilometers, and can be narrowed down to 10 kilometers at the finest. This may be sufficient for some ocean regions, but it is not sufficient at all for some topographies, so I would like to create more detailed models and incorporate methods such as statistics and machine learning to estimate.
On the other hand, there is also a conflict between effective measures and the economic aspects. For example, in the US, there were very specific discussions about the cost of migration to avoid the influence of sea level rise and the cost of building dikes, and which is better. Once you know certain things, the rest is no longer in the field of science, but in the field of politics or in the field of society. It's about how much accuracy society demands.
I myself would like to go back to the theme of ocean currents and look for more interesting and important phenomena caused by ocean currents once I have gone through sea level rise. I think there are still many interesting phenomena caused by ocean currents, such as ocean circulation. My dream for the future is to elucidate the mechanisms of these phenomena.
Provided by Hokkaido University
No comments:
Post a Comment