A diaspora-based model of human migration

How do migrants choose their destinations? Existing models, known as "gravity models," use population size and travel distance as explanatory variables—and often fail, especially at the neighborhood scale. Many migrants prefer to move to a location near friends, family, or co-nationals.
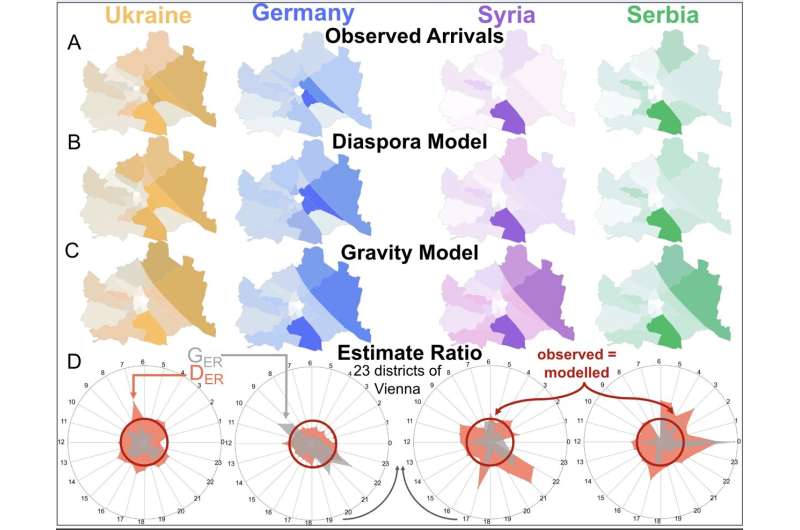
This pattern might be partly driven by factors that repeat (such as the cost of living) and partly driven by homophily, the tendency to interact with others who are similar. Early migrants tend to reduce uncertainty and provide information for later arrivals. Building on these observations, Rafael Prieto-Curiel and colleagues construct a migration model based on the power of the diaspora to shape migration flows.
In one study, published in PNAS Nexus, the authors explore arrivals to Austria from other parts of the world, estimating that 10,000 individuals of a given nationality will attract roughly 1,204 new arrivals from that same nationality to the same postcode each year.

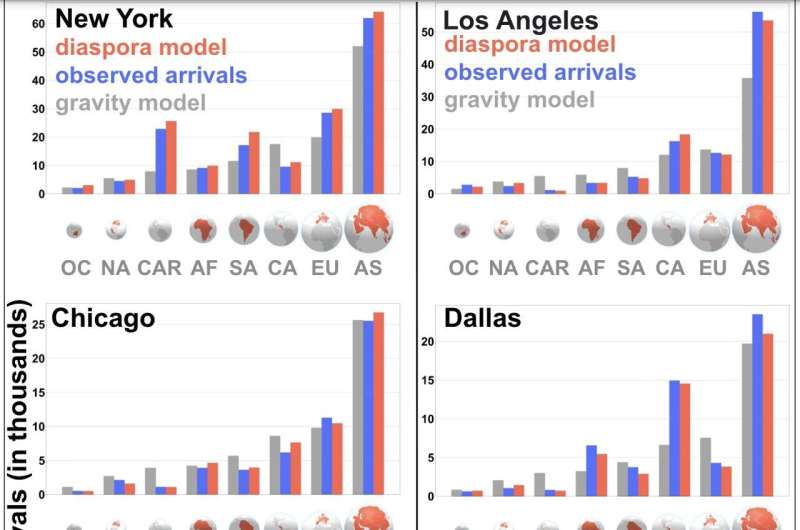
In the United States, the model can predict arrivals from a given country to a given city from previous migration figures from that country to that city.
The model helps explain why people from South America are four times more likely to move to Miami than to Houston, despite the cities being roughly similar in size and roughly equidistant to both regions of origin. The diaspora model outperforms the gravity model at the city and neighborhood scale and can be used to inform infrastructure planning and policy.
More information: Rafael Prieto-Curiel, The diaspora model for human migration, PNAS Nexus (2024). DOI: 10.1093/pnasnexus/pgae178. academic.oup.com/pnasnexus/art … /3/5/pgae178/7674968
Journal information: PNAS Nexus
Provided by PNAS Nexus
No comments:
Post a Comment