It’s possible that I shall make an ass of myself. But in that case one can always get out of it with a little dialectic. I have, of course, so worded my proposition as to be right either way (K.Marx, Letter to F.Engels on the Indian Mutiny)
Friday, August 08, 2025
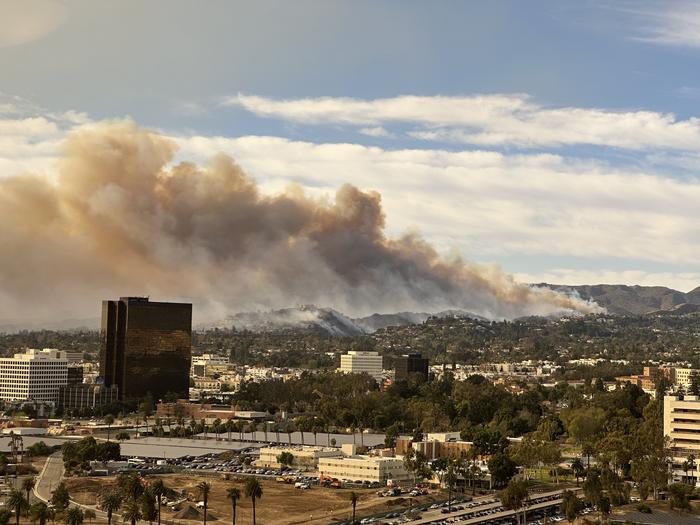
Wildfire collaborative responds to community concerns about air quality
New study seeks to answer Los Angeles residents’ questions about how to find reliable air quality information during fires
When several wildfires ignited in Los Angeles in early January of 2025, Miriam Marlier’s friends and neighbors came to her with questions about how to find reliable air quality information.
During the January fires, “people were urgently trying to find out whether the air was safe to breathe, where to find information about air quality, and whether the information was comprehensive enough for them to make decisions to protect themselves and their families,” explained WFFRC postdoctoral associate Claire Schollaert.
In response to these urgent questions, Schollaert, Marlier, and colleagues quickly launched a study to assess whether publicly available data sources captured an increase in air pollution during the fires, how air quality changed over space and time, and how the trends differed between data sets. The findings were published inEnvironmental Science and Technology Letters in July, and provide insights into how these tools can better support public health response during smoke events.
“This study is the first to my knowledge that quantifies how the LA Fires affected air quality at very fine spatial and temporal resolutions,” said Hansen. “It serves as a valuable baseline from an extraordinary event.” The study analyzed hourly data from nearly 750 low-cost and regulatory air pollution air pollution sensors throughout LA.
During large wildfires, government agencies generally recommend that residents check the Environmental Protection Agency’s air quality index, which is fed by data from regulatory monitors. The AirNow Fire and Smoke Map, another commonly recommended tool, relies on data from EPA monitors, low-cost PurpleAir sensors, and satellite data. But these tools utilize different data sources and often consider different time periods, potentially leaving residents confused.
“Smoke exposure is the main way that most people are impacted by fires,” said Schollaert. “Providing the public with understandable and accurate air quality information is crucial to reducing risk.”
For the study, the researchers compared Los Angeles air quality data from EPA regulatory monitors, low-cost PurpleAir sensors, and satellites. “We wanted to understand the smoke plume dynamics from the perspective of multiple, often complementary, air quality data sources,” explains Marlier.
Findings confirmed that the fire events did degrade air quality in the city, particularly on January 8 and 9. But air quality varied markedly from hour to hour and day to day during the course of the fires, and “the Santa Ana winds, which played a role in spreading the fires, also did a decent job of pushing smoke from the Palisades fire offshore pretty quickly,” said Schollaert. Those same winds, however, spread smoke from the Eaton fire across the most populated parts of the county before pushing the plume out over the Pacific.
The team found that while regulatory monitors are essential, they often miss local variability due to limited spatial coverage. Integrating low-cost sensors and satellite data on public risk communication platforms can help fill critical gaps. This growing network of sensors can work with regulatory systems, to strengthen them, offering more responsive public health strategies and better community protection.
Satellite observations capture broader patterns of smoke movement through the atmosphere and could help to further fill in gaps between on-the-ground monitors, but the data are not as accessible to the public.
Smoke impacts were largely consistent across these different data sources, the team found, but differences in spatial distribution and averaging times could lead to discrepancies in air quality readings, which could be confusing to users.
Based on their findings, the authors call for more ground-based sensors to improve air pollution monitoring, and for the improved integration of satellite data into user-friendly air quality platforms. Preferably, these additional sensors and data sources would be integrated into the most commonly used air quality index resources, said Schollaert.
“People want one number that lets them know whether it’s safe to go running outside or take their kid to the playground,” said Schollaert. “It’s our job as researchers to try to figure out how to make that information as reliable as possible.”
“We live in an era of data saturation,” said Hansen. “Often these datasets tell us slightly different things at different resolutions of space and time. Now more than ever, effective actionable science is about harmonizing and synthesizing these diverse datasets to provide consistent, robust, and digestible insights to the public, managers, and policy makers.”
Responsiveness to real-world needs is baked into the WFFRC approach, and the new study provides one example of how this strategy can lead to meaningful impacts and important scientific insights.
Daily hazard mapping system data, LA Fires, January 7–12
Daily hazard mapping system smoke plumes with average daily PM2.5 concentrations from AirNow (large circles) and PurpleAir (small circles) from the first 6 days of the fire impacted period (January 7–12).
Credit
Schollaert et al; graphic compiled by Leslie Tumblety / Cary Institute of Ecosystem Studies
This research was made possible, in part, by funding from the Gordon and Betty Moore Foundation under grant #11974. The paper is a contribution of the Western Fire and Forest Resilience Collaborative and the Climate and Wildfire Research Initiative at UCLA.
Western Fire and Forest Resilience Collaborative (WFFRC) is an interdisciplinary research program of Cary Institute of Ecosystem Studies focused on advancing fire ecology and forest resilience science across the western U.S. By connecting science with practice, WFFRC aims to advance fire and forest resilience strategies that are ecologically sound, science-informed, and adaptable to rapidly changing environmental conditions.
Cary Institute of Ecosystem Studies is an independent nonprofit center for environmental research. Since 1983, our scientists have been investigating the complex interactions that govern the natural world and the impacts of climate change on these systems. Our findings lead to more effective resource management, policy actions, and environmental literacy. Staff are global experts in the ecology of: forests, freshwater, disease, and cities.
In early 2025, wildfires spread in Los Angeles, destroying tens of thousands of homes and businesses. During the fires, smoke blanketed the region and online maps provided residents with rapid air quality information. Now, a study in ACS’ Environmental Science & Technology Letters compares the data that went into the maps from federal monitoring stations, low-cost sensors and satellites. Their results highlight the importance of combining multiple data sources to form easily accessible information for the public.
“Timely and accurate air quality information is crucial for the public to reduce their smoke exposure during wildfire events,” says Claire Schollaert, the study’s corresponding author. “Combining federal monitors, low-cost sensors, and satellite data can provide a more complete picture of local air quality, which can help people make safer choices in real time.”
Wildfires create smoke and haze that can be harmful to breathe. To reduce smoke exposure and mitigate potential health risks, public health experts recommend checking the local Air Quality Index (AQI) before stepping outside. The AQI ranks outdoor air from “Good” to “Hazardous,” calculating values from the levels of air pollutants present, including fine particulate matter (PM2.5). The U.S. Environmental Protection Agency’s (EPA) AirNow Fire and Smoke Map and the PurpleAir low-cost sensor network are online platforms that provide AQI information from ground monitors. Additionally, the AirNow Fire and Smoke Map provides smoke plumes from the National Oceanic and Atmospheric Administration’s (NOAA) Hazard Mapping System. Satellite observations of near-real time air pollution are also collected but aren’t readily available on these popular online platforms. In a retrospective of the January 2025 LA wildfires, Schollaert and colleagues compared the data provided in these three publicly available datasets to understand where overlaps and informational gaps may occur.
The researchers obtained air quality monitoring data for LA County from eight EPA stations in the AirNow network, 728 low-cost particulate matter sensors, and satellite data of smoke plume outlines and pollutant concentrations. During the fire period, when the Eaton and Palisades wildfires ignited and intensified (Jan. 7-12, 2025):
EPA stations detected elevated PM2.5 levels in downtown LA and Compton, reaching “Unhealthy” and “Unhealthy for Sensitive Groups” AQI categories, respectively.
Twelve of the low-cost sensors located closer to the fires (within 4.7 miles, 7.5 kilometers) had PM2.5 levels in the “Hazardous” AQI range.
Satellite images tracked the movement of light- to heavy-density smoke in the atmosphere, which generally matched places on the ground with elevated PM2.5 levels.
The stationary ground monitors showed that high AQI values generally aligned with the locations of thick smoke plumes seen by the satellites, though this was not always the case. Additionally, each data source has its advantages and disadvantages: The EPA monitors are highly accurate but limited in number, the low-cost sensors are less accurate but more prolific, and the satellites cover even more ground but don’t always reflect the conditions on the ground. But combined, these tools could be useful for people in smoke-impacted areas to make informed decisions about their exposure risks in near real time, the researchers say.
The authors acknowledge funding from the Gordon and Betty Moore Foundation and Climate and Wildfire Research Initiative at the University of California, Los Angeles.
###
The American Chemical Society (ACS) is a nonprofit organization founded in 1876 and chartered by the U.S. Congress. ACS is committed to improving all lives through the transforming power of chemistry. Its mission is to advance scientific knowledge, empower a global community and champion scientific integrity, and its vision is a world built on science. The Society is a global leader in promoting excellence in science education and providing access to chemistry-related information and research through its multiple research solutions, peer-reviewed journals, scientific conferences, e-books and weekly news periodical Chemical & Engineering News. ACS journals are among the most cited, most trusted and most read within the scientific literature; however, ACS itself does not conduct chemical research. As a leader in scientific information solutions, its CAS division partners with global innovators to accelerate breakthroughs by curating, connecting and analyzing the world’s scientific knowledge. ACS’ main offices are in Washington, D.C., and Columbus, Ohio.
Looking down the Leavens Creek watershed, where a fatal debris flow event occurred following the Eagle Creek Fire. Notice the steep, rocky channels and waterfalls that debris flows travel down.
In the wake of a wildfire, there’s often an assumption that burned landscapes will be more susceptible to landslides. But new research from the University of Oregon suggests it’s not always that simple.
An analysis of the Columbia River Gorge, which runs along the border between Oregon and Washington, shows that steep, rocky watersheds in that area have been prone to debris flows and rockfall for thousands of years. Those events didn’t measurably increase after the Eagle Creek Fire, which scorched 47,000 acres of the gorge over the course of three months in 2017.
UO geologist Josh Roering and members of his lab published their findings Aug. 8 in Science Advances, highlighting the importance of context and geological history in landslide risk assessments. The study also could help inform safety and hazards awareness projects in the gorge, in both burned and nonburned areas.
After the Eagle Creek Fire, Oregon land managers were concerned about landslides, especially in the vicinity of the Interstate 84 transportation corridor that runs through the gorge. Their fears were, in large part, informed by what’s transpired in places like Southern California, where post-fire slides have caused devastating casualties and millions of dollars in damage.
That phenomenon can happen because as wildfire destroys vegetation and groundcover, slopes become more prone to debris movement, erosion and rock fall, Roering said, which can be more easily triggered by rain and storm events.
“When Eagle Creek burned up such a massive area of the Columbia River Gorge, the natural question was: Is that going to happen here?” Roering said. “The gorge provided a great laboratory to examine how fire affects steep and rocky landscapes.”
In his lab’s latest project, Roering and doctoral student Maryn Sanders analyzed recent debris flows in the gorge to better understand the likelihood of slope movement after a fire and to explore how to predict when debris flows will occur. Debris flows occur when loose sediment — like mud, rocks and other debris — rapidly moves down a slope, often fueled by a storm or heavy rain.
Sanders and her team turned to a remote-sensing technology known as airborne lidar, or light detection and ranging, which allows them to see through the tree cover so they can analyze physical changes on the ground below, like where erosion has occurred. That tool, alongside field observations, helped them map out debris flows so they could assess movement across the study area.
As Sanders mapped the data, she found that many debris flows were concentrated in the watersheds near Dodson, just a few miles east of Multnomah Falls on the Oregon side of the gorge. Those are some of the steepest and fastest eroding watersheds in the state.
The debris flows in that region have been especially frequent and destructive. They’ve caused fatalities and threatened additional human lives, homes and infrastructure, which make them even more vital for state agencies to understand.
Sanders noticed a few interesting characteristics of the landscape as she studied the data, which suggested fire might not be the most significant cause of slope movement in that area. It also hinted that steep, rocky terrain behaves differently than slopes in a place like Southern California.
The researchers found massive amounts of sediment accumulation in fan-like formations at the base of the rocky catchments in gorge watersheds. At first glance, those features looked unassuming because they were covered in vegetation, but with lidar imaging it was clear something more notable was going on beneath the surface.
“The size and makeup of the fans suggest that frequent debris flows have been happening in these watersheds for a really long period of time, in the magnitude of thousands of years,” Sanders said.
She also observed that the slopes were collecting sediment much faster than more stable terrain does, likely through temperature fluctuations that cause rockfall. That sets them up to produce debris flows more frequently, typically every few decades.
Sanders took a closer look and analyzed the erosion rates in the area. She found frequent debris flows throughout its geological history and saw that the landscape had behaved in a consistent manner over thousands of years, something that remained relatively unchanged after the 2017 fire.
“Because we found similar rates of erosion before and after the fire, we believe the rocky environment was not as sensitive to fire,” she said. “Our analysis suggests that fire plays a relatively small role in triggering these events and emphasizes how important it is to consider the history of place.”
Still, the frequency, size and nature of debris flows in the gorge remains an ongoing cause for concern. The researchers are in the final stages of developing a tool that could help the Oregon Department of Transportation and other stakeholders predict debris flows in the gorge. That would help them make better use of safety features like roadside warning signs and closures, alerting travelers about the heightened risk of landslides during intense storms.
“These watersheds are highly active and inherently hazardous, irrespective of fire,” Sanders said. “We want our research to help agencies like ODOT better understand this geologically-complex landscape."
Journal
Science Advances
Article Title
The influence of wildfire on debris flows in a landscape of persistent disequilibrium: Columbia River Gorge, OR, USA
Article Publication Date
8-Aug-2025
Surveying Tumalt Creek, a debris flow channel near Dodson, OR. Note the large boulders that are moved around by powerful debris flows.
Credit Brook Hunter
Looking up the Leavens Creek watershed, with the deposit of the fatal Leavens Creek debris flow in the foreground.
The steep, rocky Rock of Ages Creek that was burned, but no debris flows occurred.
No comments:
Post a Comment