Wednesday, January 01, 2020


Forecasting El Niño with entropy—a year in advance

This would beat 6-month limit of current forecasts.

SCOTT K. JOHNSON - 12/28/2019, arstechnica.com 
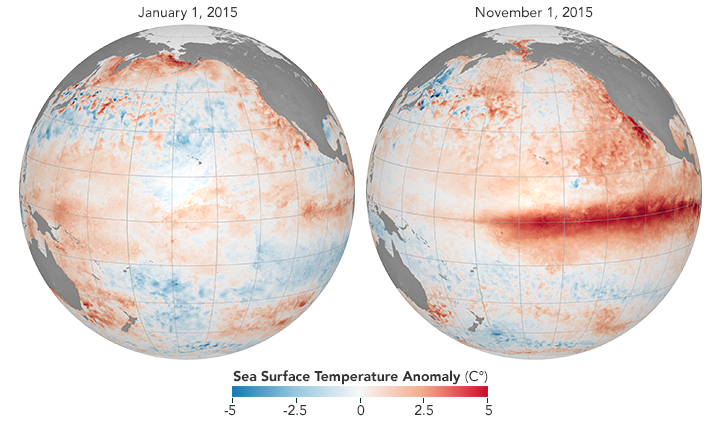
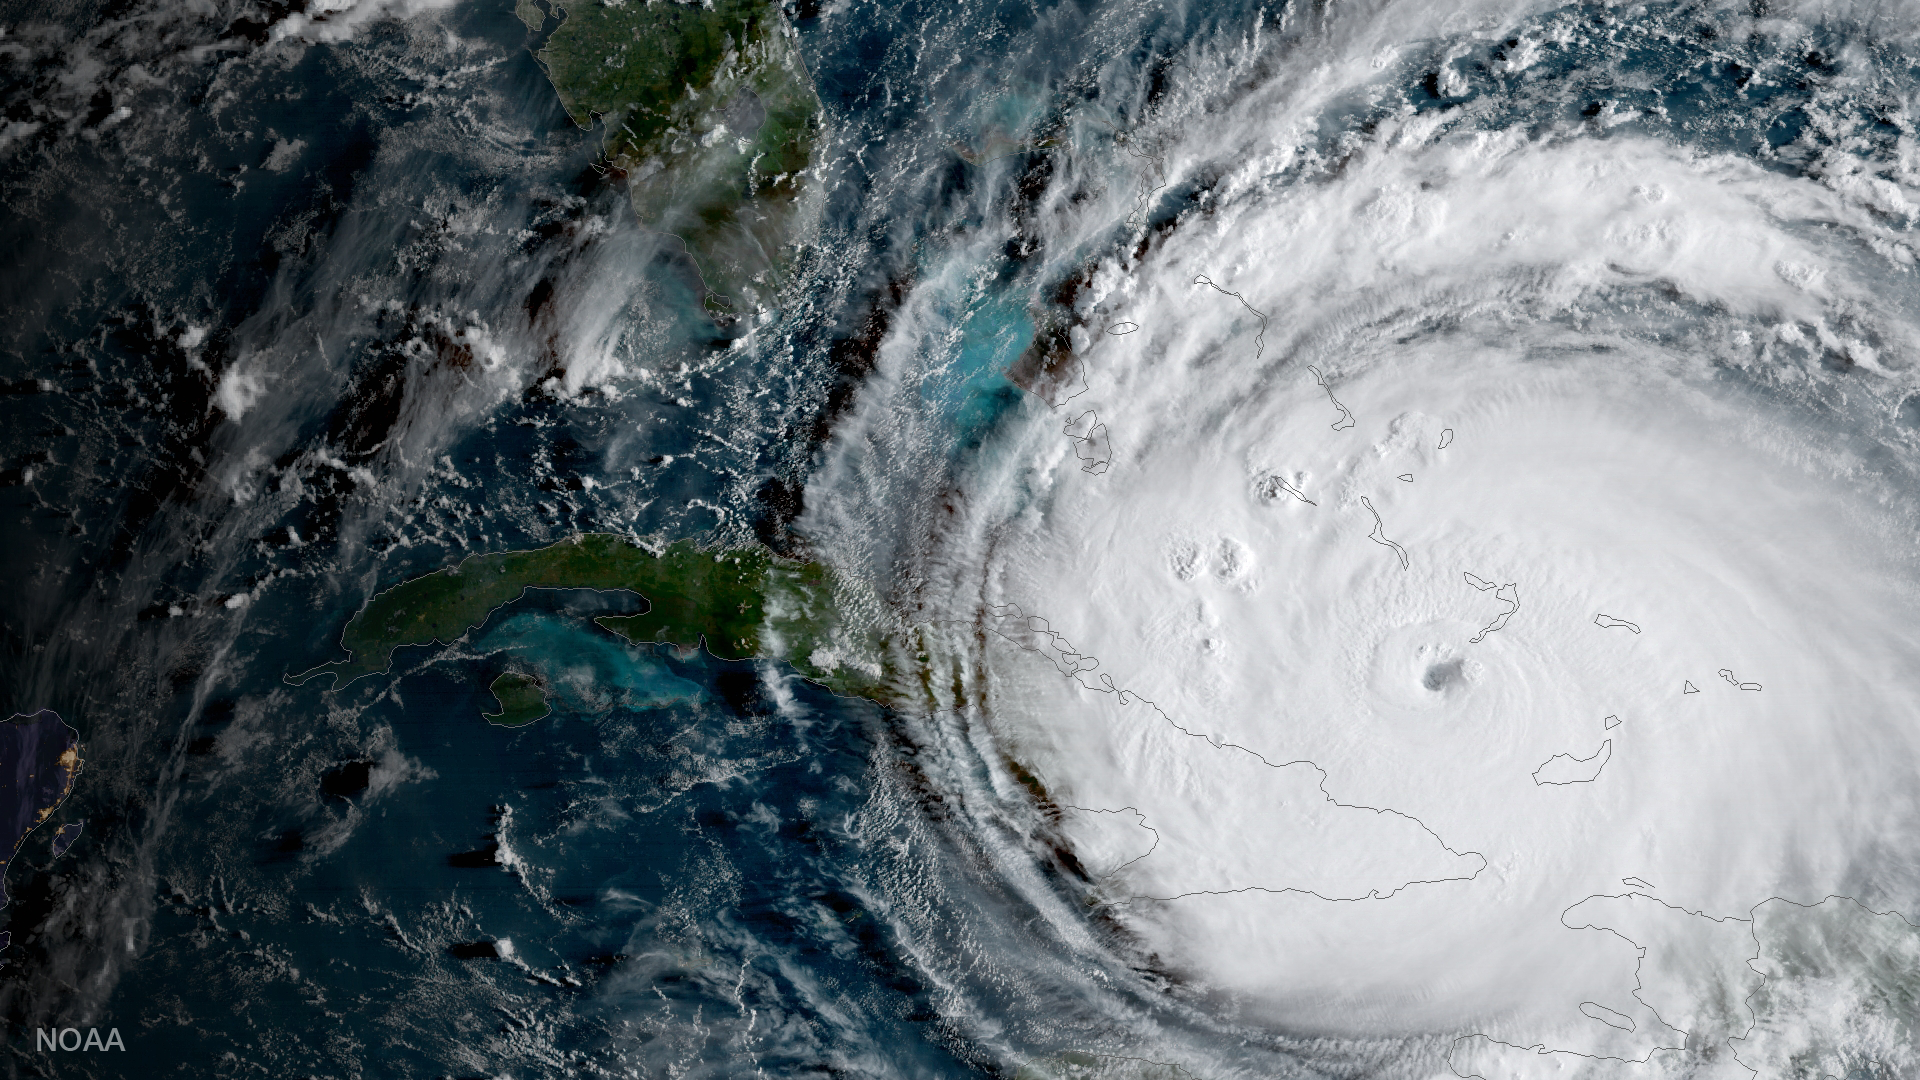
Enlarge / A strong El Niño developed in 2015, visible here from temperature departures from average.

We generally think of weather as something that changes by the day, or the week at the most. But there are also slower patterns that exist in the background, nudging your daily weather in one direction or another. One of the most consequential is the El Niño Southern Oscillation—a pattern of sea surface temperatures along the equatorial Pacific that affects temperature and precipitation averages in many places around the world.

In the El Niño phase of this oscillation, warm water from the western side of the Pacific leaks eastward toward South America, creating a broad belt of warm water at the surface. The opposite phase, known as La Niña, sees strong trade winds blow that warm water back to the west, pulling up cold water from the deeps along South America. The Pacific randomly wobbles between these phases from one year to the next, peaking late in the calendar.

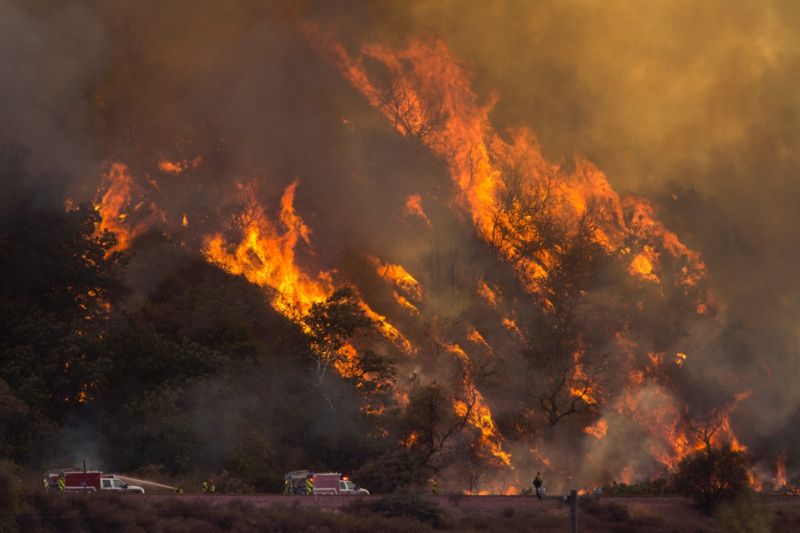
Since this oscillation has such a meaningful impact on weather patterns—from heavy precipitation in California to drought in Australia—forecasting the wobble can provide useful seasonal outlooks. And because it changes fairly slowly, current forecasts are actually quite good out to about six months. It would be nice to extend that out further, but scientists have repeatedly run into what they've termed a “spring predictability barrier.” Until they see how the spring season plays out, the models have a hard time forecasting the rest of the year.

A new study led by Jun Meng, Jingfang Fan, and Josef Ludescher at the Potsdam Institute for Climate Impact Research showcases a creative new method that might hop that barrier.

This method doesn’t involve a better simulation model or some new source of data. Instead, it analyzes sea surface temperature data in a new way, generating a prediction of the strength of El Niño events a full year in advance. That analysis, borrowed from medical science, measures the degree of order or disorder (that is, entropy) in the data. It turns out that years with high disorder tend to precede strong El Niño events that peak a year later.

What does it mean for the data to be disorderly? Essentially, the analysis looks for signs that temperatures in different locations across the relevant portion of the Pacific are changing in sync with each other. The researchers broke the area into 22 grid boxes, comparing temperature in each box to the others for consistent patterns.
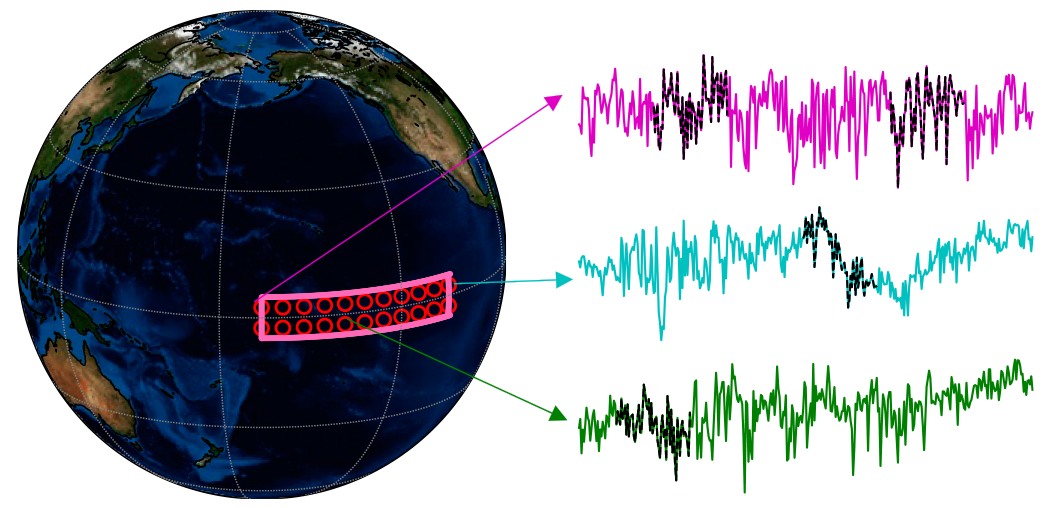
Enlarge / An example of temperature data from different grid boxes within the region used to measure the El Niño Southern Oscillation.

For a very simple example of how this works, they first tested the method on similar pairs of grid boxes—but using some pairs of neighboring boxes and some pairs that were in different parts of the world. Locations right next to each other tend to behave similarly, while distant locations experienced completely unrelated ups and downs.

When they set this method loose on past Pacific temperature data going back to 1985, it worked surprisingly well. For the ten El Niño years in the dataset, their method indicated high disorder in the year previous nine times, missing only one of them. And for the rest of the years in the dataset, it only had three false positives, where it indicated a coming El Niño that never materialized.


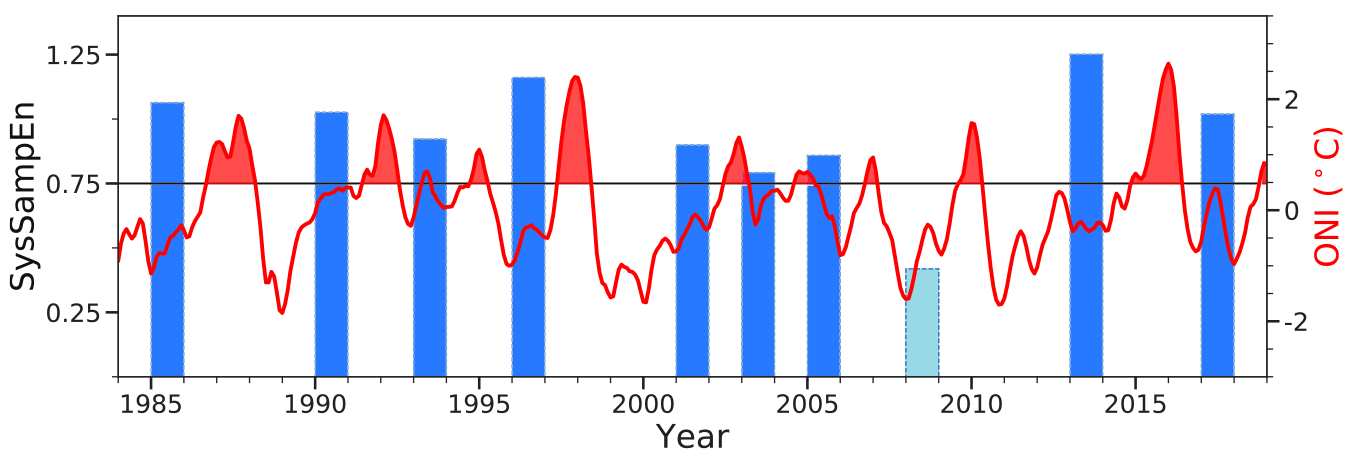
Enlarge / Forecasts of El Niño strength (blue bars) based on data in the year preceding actual El Niños (red).

What’s more, the degree of disorder correlated with the strength of the El Niño, allowing them to forecast the Pacific temperature within a couple tenths of a degree C. Most recently, the researchers calculated a 2018 forecast using the 2017 temperature data. El Niño/La Niña is measured by the average temperature across that region of the Pacific, with anything at least 0.5°C above normal qualifying as an El Niño. The 2018 forecast, calculated about 12 months ahead, comes in at +1.11°C (±0.23). The data show that 2018 actually hit about +0.9°C.

Statistics-based forecasts can be problematic, falling for meaningless correlations that have no physical basis and don’t hold up in the future. But in this case, the statistics don’t come from searching for correlations or fitting to existing data. It’s simply a real measurement that seems to pass the test pretty well. And there’s a plausible mechanism behind it, the researchers say.


Orderly temperature patterns could result from turbulent mixing of the ocean that helps temperature diffuse across the area. That is a common pattern during El Niño years, and it tends to see-saw. If temperatures are very orderly one year, they’re likely to become very disorderly the next, and vice versa. That sort of behavior has been noticed before, and this new method may be picking up on it.

If nothing else, efforts like this show the spring predictability barrier probably won’t stand forever. Seasonal weather outlooks might someday be a part of annual outlooks, though the task of forecasting next Tuesday’s weather will remain a separate endeavor.

PNAS, 2019. DOI: 10.1073/pnas.1917007117 (About DOIs).


Team that made gene-edited babies sentenced to prison, fined
China cracks down on researchers who edited genes in fertilized human eggs.

JOHN TIMMER - 12/30/2019, arstechnica.com
Enlarge / Chinese geneticist He Jiankui speaks during the Second International Summit on Human Genome Editing at the University of Hong Kong days after he claimed to have altered the genes of the embryo of a pair of twin girls before birth, prompting outcry from scientists of the field.


On Monday, China's Xinhua News Agency reported that the researchers who produced the first gene-edited children have been fined, sanctioned, and sentenced to prison. According to the Associated Press, three researchers were targeted by the court in Shenzhen, the most prominent of them being He Jiankui. He, a relatively obscure researcher, shocked the world by announcing that he had edited the genomes of two children who had already been born by the time of his public disclosure.

He Jiankui studied for a number of years in the United States before returning to China and starting some biotech companies. His interest in gene editing was only disclosed to a small number of advisers, and his work involved a very small team. Some of them were apparently at his companies, while others were at the hospital that provided him with the ability to work with human subjects. After his work was disclosed, questions were raised about whether the hospital fully understood what He was doing with those patients. The court determined that He deliberately violated Chinese research regulations and fabricated ethical review documents, which may indicate that the hospital was not fully aware.


He's decision to perform the gene editing created an ethical firestorm. There had been a general consensus that the CRISPR technology he used for the editing was too error-prone for use on humans. And, as expected, the editing produced a number of different mutations, leaving us with little idea of the biological consequences. His target was also questionable: He eliminated the CCR5 gene, which is used by HIV to enter cells but has additional, not fully understood immune functions. The editing was done in a way that these mutations and their unknown consequences would be passed on to future generations.

His goal was to provide protection against HIV infection, modeling it on known human mutations in CCR5; the embryos chosen for editing were from couples in which the father was HIV positive. There are, however, many ways to limit the possibility of HIV infection being transmitted from parents to children. And, if infected, there are many therapies that limit the impact of an HIV infection.

Ethicists and most researchers had suggested that gene editing be limited to cases where the edited genes would not be inherited. The only potential exceptions that were considered were lethal mutations for which there were no treatments. He's targets and methods violated all of these principles.

But until now, it wasn't clear whether those violations would have consequences. It had been rumored that He was placed under arrest even as a third gene-edited child was born. The legal action suggests that both of these were accurate.

He received a three-year prison sentence, a ¥3 million ($430,000) fine, and has had limits placed on any further research activities. Zhang Renli and Qin Jinzhou, who reportedly worked at the medical institutions where the work took place, were given shorter sentences and lesser fines.


Teach the Conspiracy: GMOs

Recent studies show the general public and the scientific community are deeply divided on the perceived safety of GMOs. Ars Technica's John Timmer explains why this rift exists and why GMOs are much safer than most people realize.


    Transcript

    00:00
    [dramatic, scary music]
    00:04
    A little while back, two polls were done.
    00:06
    One sampled the US public, while the second sampled members
    00:09
    of an organization that include scientists
    00:12
    and people interested in the science.
    00:14
    The pollsters used the results to determine
    00:16
    where scientists and the public kept
    00:18
    the biggest differences in opinion.
    00:20
    You might expect it to be something political,
    00:22
    like evolution or climate change, but it wasn't.
    00:25
    It was whether GMO foods are safe.
    00:27
    [Woman] Asparagus, mashed potatoes,
    00:30
    and a special treat for them, chocolate layer cake pills.
    00:35
    Are they?
    00:35
    [riveting, dramatic music]
    00:39
    We use genetic engineering to give plants useful traits.
    00:42
    We've made crops that resist viruses
    00:45
    or make proteins that kill the insect pests that eat them.
    00:48
    We've made other crops that aren't harmed by a weed killer.
    00:51
    We've engineered rice to make an important vitamin.
    00:54
    [Woman] Golden rice is being marketed as the cure
    00:57
    to vitamin A deficiency, a leading cause
    00:59
    of blindness in the world.
    01:01
    These crops have lowered pesticide use
    01:03
    and increased farmers' income in developing countries.
    01:06
    While an engineered crop is undoubtedly different,
    01:09
    all of our crops are very different from how they started.
    01:12
    Our crops are hybrids of different strains
    01:14
    with many random mutations,
    01:16
    both natural and made using radiation.
    01:19
    Or here are two mutations in maize.
    01:21
    GMOs have smaller and far more targeted changes
    01:24
    than a crop strain does compared to its natural relatives.
    01:27
    But people have always been uneasy with genetic engineering,
    01:31
    starting back when we applied it to bacteria in the 1970s.
    01:35
    You know what kind they are? All I know is that they came
    01:37
    out of that test tube that you gave me.
    01:39
    They're the ones with kinds of bacteria
    01:40
    that cause food to spoil.
    01:43
    The controversy over genetic engineering followed
    01:45
    to crops.
    01:46
    People worry about the spread of engineered genes
    01:49
    into the environment, the way GMO crops provide an advantage
    01:53
    to large agricultural companies and our increasing reliance
    01:56
    on just a few strains of plants for our food.
    02:00
    Combined, these worries have led
    02:01
    to decades of protests, including arson and destroyed crops.
    02:05
    Due to all this, the use of GMOs in Europe
    02:08
    has been severely limited, and the US has even passed a law
    02:12
    requiring foods containing GMOs to be labeled.
    02:15
    But politics isn't driving the problems.
    02:17
    Polls show equal concerns about GMO foods
    02:20
    between conservative Republicans and liberal Democrats.
    02:24
    So why are they wrong?
    02:26
    Some of the controversy rises from issues related
    02:29
    to whether a few companies have too much control
    02:31
    over modern agriculture.
    02:33
    Other issues focus on the danger of relying
    02:36
    on a limited number of high-yield crop strains.
    02:38
    That's not a problem specific to GMOs, though.
    02:41
    It's just how agriculture works now.
    02:44
    Genetic engineering involves inserting a short stretch
    02:46
    of DNA into the genome of an organism, in this case a plant.
    02:51
    That DNA will typically encode a couple of genes,
    02:53
    at least one of which provides a useful function,
    02:56
    like virus resistance.
    02:58
    The modified DNA itself isn't dangerous
    03:01
    since the DNA of anything we eat gets broken up
    03:04
    in our digestive tract.
    03:05
    We also digest the proteins that the gene encodes.
    03:09
    But, just in case, we've tested whether these proteins
    03:12
    cause allergies before the engineering goes ahead.
    03:16
    If GMO critics were right, wouldn't we be seeing lots
    03:19
    of health problems tied to their use?
    03:21
    Yet GMO crops have now undergone decades
    03:23
    of testing and use, and no problems have been discovered.
    03:27
    While a few small studies have suggested a link
    03:29
    between GMOs and cancers, these studies
    03:32
    have had glaring flaws: too few animals,
    03:35
    inconsistent results, and they've been impossible to repeat.
    03:39
    If the engineered proteins were doing anything
    03:41
    in our bodies, we'd probably see the effects
    03:44
    during animal testing.
    03:46
    Then we'd be seeing it in our cells along
    03:48
    with all the other plant and animal DNA from our food.
    03:51
    Absolutely none of these things have been seen.
    03:54
    While it is possible to make a GMO crop that isn't safe,
    03:58
    what economic reason would a company have for doing that?
    04:01
    Sure, there could be risks if people use the crops poorly.
    04:06
    It's possible that the engineered genes
    04:07
    could spread to the wild relatives of the crops.
    04:10
    Insects could develop resistance to some
    04:13
    of the crops we've engineered.
    04:14
    But all things considered, these risks can be managed,
    04:18
    and they're not risks to human health.
    04:20
    [monster roaring]
    04:21
    So why are people so afraid of GMOs?
    04:23
    [woman screaming]
    04:24
    One thing to consider is that fewer people than ever
    04:27
    are involved in farming, which means
    04:29
    that fewer people directly reap the benefits of GMO crops.
    04:33
    Most of those benefits go to farmers.
    04:35
    Lots of people don't trust the companies
    04:37
    that dominate modern agriculture.
    04:40
    Finally, some people may view genetic engineering
    04:43
    as playing God and are uncomfortable with it.
    04:46
    [Narrator On TV] There is in this at least a hint
    04:47
    of the moral problems posed by modern genetics.
    04:51
    The leading poets, professors,
    04:52
    and politicians could furnish genetic material
    04:55
    for generations of offspring.
    04:57
    Who is to decide?
    04:59
    Religious dietary laws are the result
    05:01
    of a deep-seated desire for food that's pure and natural.
    05:06
    Some of that's reasonable.
    05:07
    We all want our food processed under clean conditions.
    05:10
    But there's nothing natural about any of our crops.
    05:13
    Remember what the ancestor of corn looks like?
    05:16
    Given all these issues, it's unlikely the public
    05:19
    will accept the science any time soon.
    05:21
    [dramatic music]


    Hurricanes, climate change, and the decline of the Maya
    A sinkhole near Mayan ruins contains 2000 years of data on nearby hurricanes.
    RACHEL FRITTS - 12/31/2019 arstechnica.com 

    The year is 150 CE. It’s a humid summer day in Muyil, a coastal Mayan settlement nestled in a lush wetland on the Yucatan Peninsula. A salty breeze blows in from the gulf, rippling the turquoise surface of a nearby lagoon. Soon, the sky darkens. Rain churns the water, turning it dark and murky with stirred-up sediment. When the hurricane hits, it strips leaves off the mangroves lining the lagoon’s sandy banks. Beneath the tumultuous waves, some drift gently downward into the belly of the sinkhole at its center.

    Nearly two millennia later, a team of paleoclimatologists have used sediment cores taken from Laguna Muyil’s sinkhole to reconstruct a 2,000-year record of hurricanes that have passed within 30 kilometers of the site. Richard Sullivan of Texas A&M presented the team's preliminary findings this month at AGU’s Fall Meeting. The reconstruction shows a clear link between warmer periods and an increased frequency of intense hurricanes.

    This long-term record can help us better understand how hurricanes affected the civilization that occupied the Yucatan Peninsula for thousands of years. It also provides important information to researchers hoping to understand how hurricanes react to long-term climate trends in light of today’s changing climate.
    Sinkholes are ideal record-keepers

    Today, the Muyil Ruins still peek over the trees at Laguna Muyil, which is located within the Sian Ka’an Bioreserve in Quintana Roo, Mexico. Sullivan’s team retrieved two 40-feet-long sediment cores from the bottom of a 60-feet-deep sinkhole on the southern end of the lagoon. The cores were collected using a floating raft equipped with a vibrating tube that dug into the sediment.

    After collection, the team compared the top layers of the cores to the 150-year instrumental record maintained by NOAA to understand how close and intense a hurricane needed to be to show up as a band in their samples. Sullivan’s team found that Category 3 and higher hurricanes that passed within 30 kilometers of the site leave a clear visual record as layers of coarse sediment.

    “When a storm comes through, that high-energy system is going to mobilize denser and heavier particles and transport them into these holes,” Sullivan said. “Looking for those transitions between coarse-grained and fine-grained material is how we start to detangle this record of environmental change.”

    The next step was to radiocarbon date the layers using leaves, sticks, and seeds that were blown into the hole. The more organic debris present, the more confident the researchers could be about the precise timing of intense hurricane activity. In the Muyil cores, each centimeter of sediment roughly corresponded to 1.5 years, providing a high-resolution record extending back nearly 2,000 years.
    The benefit of the long view

    Since instrumental hurricane records only go back 150 years, they don’t tell us much about how long-term climate trends affect hurricane activity. Research like Sullivan’s, and similar work taking place in the Bahamas, can extend our knowledge back much further and help us gain a better understanding of how these storms are influenced by climate change.

    “The modern record is simply too short … and there is great potential for paleohurricane records to give us more insight into the influences of climate on hurricanes,” said Jason Smerdon, a paleoclimatologist with Columbia University’s Lomont-Doherty Earth Observatory who was not involved in the study. “This kind of paleohurricane research is exciting and vital for our understanding of hurricane variability in regions like the Atlantic Basin.”

    The Muyil sediment core reconstruction indicates that storm activity increased during the the North Atlantic’s Medieval Warm Period, and decreased during the period of slight global cooling called the Little Ice Age. These periods align with the movement of something called the Intertropical Convergence Zone (ITCZ), a band of warm air that circles the equator and oscillates between the northern and southern hemispheres. We have a 13,000-year-record of the ITCZ, and when it moves north, the sediment record shows a clear uptick in storm activity. It’s moving north right now.
    The Mayan connection

    Linking up the hurricane data to archeological Mayan records can serve as a reminder of the effects that periods of intense storms can have on human civilizations. The Maya Terminal Classic Phase that occurred 800-1,000 years ago came at the tail end of a prolonged drying period. This period of drought was likely brought about, in part, by deforestation driven by intense agriculture in the region. Researchers consider it a major culprit in the end of the Mayan Classic Phase, the period during which Mayan civilization is often regarded as having reached its peak.

    Sullivan’s paleohurricane reconstruction adds to our understanding of the relationship between this period of Mayan history and climate change. It appears that when the rains returned, they came back with a vengeance. Increased storm activity identified in the cores coincides with the end of the Terminal Classic Period and decline of Chichen Itza.

    “You have a culture that's already sort of reeling from long-term drought and then getting hammered again,” Sullivan said. “It doesn't stretch the imagination to envision a population recovering from drought being further stressed by frequent storms damaging crops or supply lines.”

    Smerdon said he finds it “very exciting to consider how past storm activity may have influenced cultures like the Maya.” But he cautions that with just one location, it is difficult to tease out how much the fluctuations observed in the sediment are influenced by broader climate impacts on hurricanes rather than random differences in each hurricane’s path.

    Sullivan is still analyzing the data and is hoping to link the sediment record to additional climate fluctuations, like El Niño. He also plans to compare this record to other cores he has collected in locations throughout the Yucatan Peninsula. Some of these extend as far back as 8,000 years, but record storm events at a lower resolution.

    “The overall potential of these studies and the important insights that they can provide are well established and point to a lot of exciting work in this field over the years to come,” Smerdon said.

    ---30---

    WHAT'S NEW YEARS WITHOUT A GOOD VAMPIRE TALE 
    DNA analysis revealed the identity of 19th century “Connecticut vampire”


    HOW THEY USED THE 24&ME GENETIC MARKER KIT THEY GOT FOR XMAS 
    Genetic markers were cross-referenced to a genealogy database to help ID the remains
    JENNIFER OUELLETTE - 12/31/2019
    Enlarge / The 19th century grave of "JB55" in Griswold, Connecticut, showing the remains arranged in a manner to prevent the "vampire" from rising and "feeding" off the community. The man is likely local laborer John Barber.
    Connecticut Office of State Archaeology 


    There's rarely time to write about every cool science-y story that comes our way. So this year, we're once again running a special Twelve Days of Christmas series of posts, highlighting one science story that fell through the cracks each day, from December 25 through January 5. Today: Scientists determined the identity of "JB55," one of the 19th century New England "vampires" whose remains were disturbed to prevent them from rising to afflict the community.

    Back in 1990, children playing near a gravel pit in Griswold, Connecticut, stumbled across a pair of skulls that had broken free of their graves in a 19th century unmarked cemetery. Subsequent excavation revealed 27 graves—including that of a middle-aged man identified only by the initials "JB55," spelled out in brass tacks on his coffin. Unlike the other burials, his skull and femurs were neatly arranged in the shape of a skull and crossbones, leading archaeologists to conclude that the man had been a suspected "vampire" by his community. Scientists finally found a likely identification for JB55, describing their findings in a paper published this summer in the journal Genes.

    Analysis of JB55's bones back in the 1990s indicated the man had been a middle-aged laborer, around 55 when he died (hence, JB55, the man's initials and age at death). The remains also showed signs of lesions on the ribs, so JB55 suffered from a chronic lung condition—most likely tuberculosis, known at the time as consumption. It was frequently lethal in the 1800s, due to the lack of antibiotics, and symptoms included a bloody cough, jaundice (pale, yellowed skin), red and swollen eyes, and a general appearance of "wasting away." The infection frequently spread to family members. So perhaps it's not surprising that local folklore suspected some victims of being vampires, rising from the grave to sicken the community they left behind.

    Hence the outbreak of the so-called Great New England Vampire Panic in the 19th century across Rhode Island, Vermont, and eastern Connecticut. It was common for families to dig up the bodies of those who had died from consumption to look for signs of vampirism, a practice known as "therapeutic exhumation." If there was liquid blood in the organs (especially the heart), a bloated abdomen, or if the corpse seemed relatively fresh, this was viewed as evidence of vampirism. In such cases, the organs would be removed and burned, the head sometimes decapitated, and the body reburied. Given JB55's lung condition and the fact that there were signs of decapitation, he was likely a suspected vampire.


    Photograph of JB55 showing bones arranged in a skull and crossbones.
    J. Daniels-Higginbotham/Genes
    JB55's ribs showed signs of lesions, indicating a chronic lung infection like tuberculosis.
    J. Daniels-Higginbotham/Genes
    A fragment of the coffin that held the remains of the man believed to be John Barber is hardwood, decorated with brass tacks hammered into the initials "JB55."
    Courtesy of Connecticut State Archaeologist


    A diagram of the cemetery where the desecrated grave of the alleged vampire was found.
    Bill Keegan/Connecticut State Archaeologist

    “This was being done out of fear and out of love,” co-author Nicholas F. Bellantoni, a retired Connecticut state archaeologist who worked on the case in the early 1990s, told the Washington Post. “People were dying in their families, and they had no way of stopping it, and just maybe this was what could stop the deaths. They didn’t want to do this, but they wanted to protect those that were still living."

    Researchers at the National Museum of Health and Medicine (NMHM) took a sample from one of JB55's femurs in the early 1990s. The DNA was analyzed, but it wasn't possible at the time to glean sufficient information to make reliable identification. “This case has been a mystery since the 1990s,” Charla Marshall, a forensic scientist with SNA International in Virginia, told the Washington Post. “Now that we have expanded technological capabilities, we wanted to revisit JB55 to see whether we could solve the mystery of who he was.”

    For this most recent analysis, the researchers used Y-chromosomal DNA profiling and cross-referenced the genetic markers with an online genealogy database. The closest match had the last name of "Barber." A newspaper notice from 1826 recorded the death of a 12-year-old boy named Nathan Barber, son of one John Barber of Griswold. It just so happens that a grave near that of JB55 bore the initials "NB13" on the coffin lid. That's strong evidence that JB55 is probably John Barber, while NB13 was his son. But there was no other historical or genealogical information about either of them.

    "To our knowledge this is the first study that applies DNA testing to identify the remains of a historical case with no presumed identity," the authors wrote, unlike DNA analysis for such high-profile historical figures as Richard III or the Romanov family, where the DNA profiles can be compared to that of living relatives. "Future work involving genetic genealogy may lead to living descendants of JB55, and possibly verify the identity of the Griswald, Connecticut vampire as John Barber."

    DOI: Genes, 2019. 10.3390/genes10090636 (About DOIs).


    arstechnica.com 
    Scientists model dynamic feedback loop that fuels the spread of wildfires
    Interaction between rising air, ambient winds determines how quickly a fire spreads.

    JENNIFER OUELLETTE - 12/28/2019  arstechnica.com

     Flames spread up a hillside near firefighters at the Blue

     Cut Fire on August 18, 2016 near Wrightwood, California.
    David McNew/Getty Images


    There's rarely time to write about every cool science-y story that comes our way. So this year, we're once again running a special Twelve Days of Christmas series of posts, highlighting one science story that fell through the cracks each day, from December 25 through January 5. Today: How scientists at Los Alamos National Laboratory are modeling the complicated dynamic feedback loop between wildfires and the atmosphere to help prevent and control the spread of devastating wildfires in the future.

    From a physics and chemistry standpoint, fire is an incredibly complicated phenomenon—so much so that 19th century physicist Michael Faraday built an entire series of six lectures around the flame of a single candle at the Royal Institution in 1848. Fuel, heat, and oxygen, combined under the right conditions, ignite into a sustained chemical reaction: fire. Add in factors like conduction, convection, radiation, and any number of environmental factors, and that fire can rapidly spread out of control.

    Scientists have been trying to better delineate how wildfires spread for decades, and understanding the complicated fluid dynamics at work is key to those efforts. Rodman Linn, an atmospheric scientist at Los Alamos National Laboratory, does computational modeling of how fires interact with the surrounding atmosphere to predict how a given fire behaves. It's a challenging phenomenon to model, since it involves the interaction of several different processes. Linn describes the various factors that influence how a wildfire spreads in an article in the November issue of Physics Today.

    Most models currently in use are based on seminal work done back in 1972 by Richard Rothermel, an aeronautical engineer who developed the first quantitative tool for predicting the spread of wildfires. Every kind of fuel has an ignition point (also known as a flash point), a measure of how much energy is required to ignite that fuel. Rothermel's model determined that ignition point and then factored in wind speed, the slope of the ground, and other critical factors to calculate the rate of ignition required for a nascent wildfire to spread quickly.
    Enlarge / Computer simulation showing stream traces 
    of winds reaching the left flank and head of a fire spreading 
    up a steep slope.
    Alexandra Jonko/Los Alamos National Laboratory

    But it's a simplified model, akin to a fire spreading through a uniform field, whereas wildfires tend to spread through landscapes dotted with trees, shrubs, underbrush, and so forth. When the situation starts to deviate strongly from the basic underlying fire scenario—a wind-driven fire and homogenous fuels on a homogenous slope—the so-called BEHAVE model becomes less accurate. "The minute you get something that's complex in terms of fuel structure, or the topography—or even worse if you have multiple fire lines—you're adding complexity to the coupling between the fire and the atmosphere that was not present in the development of those early models," Linn told Ars.

    That's why Linn's research focuses on the dynamic feedback loop between the fire and its interaction with the atmosphere, especially winds. "The interaction between rising air and ambient winds controls the rate at which surrounding vegetation heats up and whether it ignites," he wrote. "The interaction thus determines how quickly a fire spreads."

    According to Lin, something you won't see in a more accurate model of a wildfire is a solid advancing wall of flame. "Convective cooling would prevent the wall of flame from spreading by radiation alone, and for convective heating to spread the fire, the wind would have to be strong enough to lean the flame to the point where it touches the unburned fuel," he wrote. A more accurate depiction of what a wildfire looks like from the front would show several strong updrafts, creating towers of flame separated by gaps or troughs. The updrafts carry heat up, and ambient wind is pushed through the troughs, heating up as it travels and possibly igniting any available fuel in front of the fire.

    The shape of the fireline can also influence how a fire spreads. There may be flanking fires trailing behind the fast-moving headfire, according to Linn, forming a horseshoe shape, which can determine how much wind reaches the headfire. If the horseshoe of flanking fires is narrow, more wind will be diverted to the flanks and the wind that actually reaches the headfire will be moving more slowly, resulting in a slower spread rate.


    A computer-generated snapshot of a grass fire showing updraft towers and troughs, with wind-speed vectors. R. Linn/Los Alamos National Laboratory


    An experimental grass fire shows what the towers and troughs look like in reality.
    Mark Finney/US Forest Service, Missoula Fire Sciences Laboratory

    One common means of preventing the outbreak of devastating wildfires is prescribed burns, which can restore some balance to the ecosystem. Historically, fires have proven beneficial in terms of clearing out brush and other excessive fuels. But to perform prescribed burns effectively requires factoring in variable winds, the unique terrain, and vegetation patterns. "When firefighters place a new fire line downwind of a fire, they often hope that the indrafts will pull the so-called 'counter fire' toward the wildfire and remove fuel in front of it," Linn wrote. "Unfortunately, the maneuver requires a good understanding of the wildfire's indraft strength. Too weak an indraft could turn the counter fire into a second wildfire."

    There are regional differences, too. The way firefighters in the Southeast set prescribed burns might not work well in California. "The fuels are a little bit different, the topography can be more extreme," Linn told Ars. "The humidity can be different." And that requires a different approach to prescribed burns.

    Linn and his LANL colleagues have drawn on the lessons they've learned to develop new computer programs for simulating the spread of wildfires, with an aim toward achieving better prevention and more effective firefighting strategies. For instance, FIRETEC specifically models a fire's interactions with the atmosphere. The user just needs to feed in information about the landscape, ignition pattern, and ambient wind conditions, and the program will calculate how the fire is likely to evolve and spread through that landscape.

    Linn et al. are now developing another software program called QUIC-FIRE, which will be able to operate on a laptop. It will incorporate such variables as weather, terrain, fuels, aerodynamics, combustion, turbulence, and heat transfer to help firefighters devise the best strategies for implementing prescribed burns.

    DOI: Physics Today, 2019. 10.1063/PT.3.4350 (About DOIs).

    Courtesy of Los Alamos National Laboratory.