Wednesday, January 01, 2020

WHY AMAZON WANTS DRIVERS TO BE CONTRACTORS, NOT EMPLOYEES 

DELIVER AT YOUR OWN RISK —
Driver training was reportedly too much of “a bottleneck” for Amazon
Time you use to train thousands of drivers is time they aren't making deliveries.

KATE COX - 12/26/2019 ARSTECHNICA.COM
Enlarge / An Amazon Prime-branded delivery van and driver.

Amazon is rapidly dispensing with carriers such as FedEx for its retail deliveries, bringing the logistics business in-house to ship more Prime packages more quickly. The speed and money savings, though, seem to be coming at the cost of health and safety concerns—and a new report says the company is well aware, and Amazon is letting it happen anyway.

Internal documents show the company had plans to implement driver safety training courses but scrapped them in order to get drivers up and running faster, ProPublica and BuzzFeed News report.

FURTHER READING Amazon delivery contractors operate with little oversight, report finds

"We chose not to have onroad practical training because it was a bottleneck" to getting drivers on the road, a senior manager wrote.

It was just one of many examples the reporters found of Amazon ignoring evidence its logistics business was overburdened.

Amazon said back in 2016 it wanted to bring last-mile delivery under its own enormous roof, and it has done just that. The company today is happily bragging about the performance of its logistics business this Christmas season, revealing that it delivered more than 3.5 billion packages with its in-house delivery business in 2019 to date.

But that "in-house" business is mostly outsourced. Hundreds of small firms—more than 800 now, according to Amazon—work under contract to provide those Prime delivery services. Some of those contractors no doubt do focus on worker safety. Several reports in the past year, though, have highlighted many that emphatically do not. NBC News in November published a report describing Amazon logistics as a "chaotic environment" where all-but-impossible delivery quotas put unmanageable and unsafe demands on drivers.

"You don't take your lunch break. You don't use the bathroom... There were guys peeing in bottles in the van," one driver told NBC at the time, including himself in that category. "You speed. You run stop signs in a neighborhood... You start conditioning yourself to just go as fast as possible."

In September, ProPublica and BuzzFeed also published separate independent reports detailing a lack of oversight with several delivery contractors. Both reports detailed several instances of severe injuries and deaths tied to crashes involving Amazon transport vans.

Amazon strenuously objected to the new story, calling the report "another attempt by ProPublica and BuzzFeed to push a preconceived narrative that is simply untrue."

The company told ProPublica it provided more than 1 million hours of safety training to employees and contractors in the last year but did not say how many of its 750,000 worldwide employees participated in said training. Amazon also said it spent $55 million on "safety improvement projects" last year—"about one-fifth of 1% of the $27.7 billion the company spent on shipping last year," the reporters write.

"Nothing is more important to us than safety," the company added.

---30---

Why the 2010s were the Facebook Decade 

Facebook grew 600% in 10 years, worming its way into basically everything. How? 

KATE COX - 12/26/2019 ARSTECHNICA.COM

Enlarge / Facebook CEO Mark Zuckerberg testifying before Congress

 in April 2018. It wasn't his only appearance in DC this decade. 


By the end of 2009, Facebook—under the control of its then 25-year-old CEO, Mark Zuckerberg—was clearly on the rise. It more than doubled its subscriber base during the year, from 150 million monthly active users in January to 350 million in December. That year it also debuted several key features, including the "like" button and the ability to @-tag your friends in posts and comments. The once-novel platform, not just for kids anymore, was rapidly becoming mainstream.

Here at the end of 2019, Facebook—under the control of its now 35-year-old CEO, Mark Zuckerberg—boasts 2.45 billion monthly active users. That's a smidge under one-third of the entire human population of Earth, and the number is still going up every quarter (albeit more slowly than it used to). This year it has also debuted several key features, mostly around ideas like "preventing bad nation-state actors from hijacking democratic elections in other countries."

Love it or hate it, then, Facebook is in arguably a major facet of life not just in the United States but worldwide as we head into the next roaring '20s. But how on Earth did one social network, out of the many that launched and faded in the 2000s, end up taking over the world?


The Social Network debuted in 2010. 

Setting the stage: From the dorms to "The Facebook Election"

Zuckerberg infamously started Facebook at Harvard in February 2004. Adoption was swift among Harvard undergrads, and the nascent Facebook team in the following months began allowing students at other Ivy League and Boston-area colleges to register, followed by a rapid roll-out to other US universities.

By summer of 2004, Facebook was incorporated as a business and had a California headquarters near Stanford University. It continued growing through 2005, allowing certain high schools and businesses to join, as well as US and international universities. The company wrapped up 2005 with about 6 million members, but it truly went big in September 2006, when the platform opened up to everyone.

But the advent of the smartphone era, which took off in 2007 when the first iPhone launched, really kicked Facebook up several gears. In 2008, the company marked two major milestones.

First, Facebook reached the 100 million user mark—a critical mass where enough of "everyone" was using the platform that it became fairly easy to talk anyone who wasn't using it yet into giving it a try. Second: Facebook found its niche in political advertising, when Barack Obama won what pundits started to call "The Facebook Election."

"Obama enjoyed a groundswell of support among, for lack of a better term, the Facebook generation," US News and World Report wrote at the time, describing Obama's popularity with voters under 25. "He will be the first occupant of the White House to have won a presidential election on the Web."


"Like a lot of Web innovators, the Obama campaign did not invent anything completely new," late media columnist David Carr wrote for The New York Times. "Instead, by bolting together social networking applications under the banner of a movement, they created an unforeseen force to raise money, organize locally, fight smear campaigns and get out the vote that helped them topple the Clinton machine and then John McCain and the Republicans."

"Obama's win means future elections must be fought online," The Guardian declaimed, adding presciently:


Facebook was not unaware of its suddenly powerful role in American electoral politics. During the presidential campaign, the site launched its own forum to encourage online debates about voter issues. Facebook also teamed up with the major television network, ABC, for election coverage and political forums. Another old media outlet, CNN, teamed up with YouTube to hold presidential debates.


If the beginning of the Obama years in 2008 was one kind of landmark for Facebook, their end, in 2016, was entirely another. But first, the company faced several other massive milestones.

2012: The IPO

Facebook took the Internet world by storm in 2004, but it didn't take on the financial world until 2012, when it launched its initial public offering of stock.

After months of speculative headlines, the Facebook IPO took place Friday, May 18, 2012 to much fanfare. The company priced shares at $38 each, raising about $16 billion. The shares hit $42.05 when they actually started trading. A good start, to be sure, but then everything went pear-shaped.

FURTHER READING


Right off the bat, the NASDAQ itself suffered technical errors that prevented Facebook shares from being sold for half an hour. Shares finally started to move at 11:30am ET, but then the overall market promptly fell, leaving FB ending the day just about where it began at $38.23. Everything about it was considered a flop.

The failures at NASDAQ and among banks prompted a series of investigations, lawsuits, settlements, and mea culpas that lingered for years. But post-mortems on the IPO eventually made clear that one of the many problems plaguing the NASDAQ in the moment was simply one of scale: Facebook was too big for the system to handle. The company sold 421.2 million shares in its IPO—the largest technology IPO ever at that time and still one of the ten highest-value IPOs in US history.

In August 2012, Facebook stock dropped to about $18. "Social media giant struggles to show that it can make money from mobile ads," an Ars story said at the time. "Facebook has struggled in recent months to show that it can effectively make money on mobile devices—even though some analysts, in the wake of the company’s adequate quarterly earnings report, said that they expected Facebook to turn things around."

The company did, indeed, turn things around, and the flop was soon forgotten.

Enlarge / Obvious example of an Instagram influencer. 


2012: Instagram

In April 2012, Facebook said it would pay a whopping $1 billion to acquire an up-and-coming photo service: Instagram.

The fledgling photo service had about 27 million loyal iOS users at the time, and the company had recently launched an Android version of the app. "Zuckerberg didn't say how Facebook will make money on Instagram, which doesn't yet have advertising," Ars reported at the time.

The headline TechCrunch ran with, however, has proven to be the most relevant and prescient: "Facebook buys Instagram for $1 billion, turns budding rival into its standalone photo app," the tech business site wrote.

Instagram passed the 1 billion user mark in 2018, and advertising on the platform is now an enormous business, chock-full of "influencers" who flog legacy brands and new upstarts alike. An entire business model based on the Instagram influencer aesthetic flourished, launching new companies selling all things aspirational: fashion, luggage, lingerie, and more.


2013: Atlas

Among the company's dozens of acquisitions, one in particular stands out for allowing Facebook to solidify its grip on the world and its advertising markets.

In 2013, Facebook announced it would acquire a product called the Atlas Advertiser Suite from Microsoft; media reports pegged the purchase price around $100 million.

FURTHER READING


In Facebook's words, the acquisition provided an "opportunity" for "marketers and agencies" to get "a holistic view of campaign performance" across "different channels."

Translated back out of marketese and into plain English, Facebook acquired Atlas to basically solve the holy grail of online advertising: tracking its effectiveness in the physical world. Facebook absorbed what it needed from Atlas and then relaunched the platform in 2014 promising "people-based marketing" across devices and platforms. As yours truly put it at the time, "That’s a fancy way of saying that because your Facebook profile is still your Facebook profile no matter what computer or iPad or phone you’re using, Facebook can track your behavior across all devices and let advertisers reach you on all of them."

Facebook phased out the Atlas brand in 2017, but its products—the measurement tools that made it so valuable to begin with—did not. Instead, they were folded into the Facebook brand and made available as part of the Facebook advertiser management tools, such as the Facebook Pixel.


2013-2014: Onavo and WhatsApp

Late in 2013, Facebook spent about $200 million to acquire an Israel-based startup called Onavo. The dry press release at the time described Onavo as a provider of mobile utilities and "the first mobile market intelligence service based on real engagement data."

One of the mobile utilities Onavo provided was a VPN called Onavo Protect. In 2017, however, the Wall Street Journal reported that Onavo wasn't keeping all that Web traffic to itself, the way a VPN is supposed to. Instead, when users opened an app or website inside the VPN, Onavo was redirecting the traffic through Facebook servers that logged the data.

Facebook used that data to spot nascent competition before it could bloom. In the same report, the WSJ noted that the data captured from Onavo directly informed Facebook's largest-ever acquisition: its 2014 purchase of messaging platform WhatsApp for $19 billion.

FURTHER READING


"Onavo showed [WhatsApp] was installed on 99 percent of all Android phones in Spain—showing WhatsApp was changing how an entire country communicated," sources told the WSJ. In 2018, Facebook confirmed the WSJ's reporting to Congress, admitting that it used the aggregated data gathered and logged by Onavo to analyze consumers' use of other apps.

Apple pulled Onavo from its app store in 2018, with Google following suit a few months later. Facebook finally killed the service in May of this year.

The WSJ this year found that competitor Snapchat kept a dossier, dubbed "Project Voldemort," recording the ways Facebook used information from Onavo, together with other data, to try quashing its business.

WhatsApp, meanwhile, reached the 1.5 billion user mark in 2017, and it remains the most broadly used messaging service in the world.

2016: The Russia Election

The 2016 US presidential campaign season was... let's be diplomatic and call it a hot mess. There were many, many contributing factors to Donald Trump's eventual win and inauguration as the 45th president of the United States. At the time, the idea that extensive Russian interference might be one of those factors felt to millions of Americans like a farfetched tinfoil hat conspiracy theory, floated only to deflect from other concerns.
FURTHER READING Massive scale of Russian election trolling revealed in draft Senate report
By the weeks after the election, however, the involvement of Russian actors was well known. US intelligence agencies said they were "confident" Russia organized hacks that influenced the election. CNN reported in December 2016 that in addition to the hacks, "There is also evidence that entities connected to the Russian government were bankrolling 'troll farms' that spread fake news about Clinton."

And boy, were they ever. Above you can see a selection of Russian-bought Facebook and Instagram ads—released to the public in 2018 by the House of Representatives' Permanent Select Committee on Intelligence—designed to sow doubt among the American population in the run-up to the election. And earlier this year, the Senate Intelligence Committee dropped its final report (PDF) detailing how Russian intelligence used Facebook, Instagram, and Twitter to spread misinformation with the specific goal of boosting the Republican Party and Donald Trump in the 2016 election.

The Senate report is damning. "The Committee found that Russia's targeting of the 2016 US presidential election was part of a broader, sophisticated, and ongoing information warfare campaign designed to sow discord in American politics and society," the report said:

Russia's history of using social media as a lever for online influence operations predates the 2016 US presidential election and involves more than the IRA [Internet Research Agency]. The IRA's operational planning for the 2016 election goes back at least to 2014, when two IRA operatives were sent to the United States to gather intelligence in furtherance of the IRA's objectives.

Special Counsel Robert Mueller's probe into the matter has resulted in charges against eight Americans, 13 Russian nationals, 12 Russian intelligence officers, and three Russian companies. As we head into 2020, some of those cases have resulted in plea deals or guilty findings, and others are still in progress.

FURTHER READING

Facebook itself faced deep and probing questions related to how it handled user data during the campaign, particularly pertaining to the Cambridge Analytica scandal. Ultimately, Facebook reached a $5 billion settlement with the Federal Trade Commission over violations of user privacy agreements.


The revelations had fallout inside Facebook, too. The company's chief information security officer at the time, Alex Stamos, reportedly clashed with the rest of the C-suite on how to handle Russian misinformation campaigns and election security. Stamos ultimately left the company in August, 2018.

Gallery Thumbnail 4Gallery Thumbnail 5
Gallery Thumbnail 3Gallery Thumbnail 6Gallery Thumbnail 7

Everything Facebook allegedly did do in the past decade but shouldn't have, or didn't do but should have, basically hit the regulatory fan all at once in 2019. Facebook spent so much time in the spotlight this year that it's easiest to relate in a timeline:
March 8: Sen. Elizabeth Warren (D-Mass.) announces a proposal to break up Amazon, Facebook, and Google as one of the policy planks of her 2020 presidential run.

May 9: Facebook co-founder Chris Hughes pens a lengthy op-ed in The New York Times making the case for breaking up Facebook sooner rather than later.
June 3: The House Antitrust Subcommittee announces a bipartisan investigation into competition and "abusive conduct" in the tech sector.
June 3: Reuters, The Wall Street Journal, and other media outlets report that the FTC and DOJ have settled on a divide-and-conquer approach to antitrust probes, with the DOJ set to take on Apple and Google, and the FTC investigating Amazon and Facebook.
July 24: The Department of Justice publicly confirms it has launched an antitrust probe into "market-leading online platforms." The DOJ does not name names, but the list of potential targets is widely understood to include Apple, Amazon, Facebook, and Google.
July 24: The FTC announces its $5 billion settlement over user privacy violations.
July 25: Facebook confirms it is under investigation by the FTC.
September 6: A coalition of attorneys general for nine states and territories announce a joint antitrust probe into Facebook.
September 13: The House Antitrust Subcommittee sends an absolutely massive request for information to Apple, Amazon, Facebook, and Google, requesting 10 years' worth of detailed records relating to competition, acquisitions, and other matters relevant to the investigation.
September 25: Media reports indicate the DOJ is also probing Facebook.
October 22: An additional 38 attorneys general sign on to the states' probe of Facebook, bringing the total to 47.
October 22: Zuckerberg testifies before the House Financial Services Committee about Facebook. The hearing goes extremely poorly for him. 

2020: Too big to succeed?

We wrap up this decade and head into the next with Facebook in the crosshairs not only of virtually every US regulator, but also of regulators in Europe, Australia, and other jurisdictions worldwide. Meanwhile, there's another presidential election bearing down on us, with the Iowa Democratic Caucus kicking off primary season a little more than a month from now.

Facebook is clearly trying to correct some of its mistakes. The company has promised to fight election disinformation, as well as disinformation around the 2020 census. But it's a distinctly uphill battle.

The company's sheer scale means targeting any problematic content, including disinformation, is extremely challenging. And yet, even though the company has three different platforms that each boasts more than 1 billion daily users, inside Facebook, the appetite for growth apparently remains insatiable.

"[F]or Facebook, the very word 'impact' is often defined by internal growth rather than external consequences," current and former Facebook employees recently told BuzzFeed News.

Performance evaluation and compensation changes (i.e., raises) are still tied to growth metrics, sources told BuzzFeed—so it's no wonder that the company still seems more focused on a narrow set of numbers rather than on the massive impact its services can have worldwide. The company recently "tweaked" its bonus system to include "social progress" as a metric—but it's anyone's guess whether internal forces or external regulators will be the first to make changes at Facebook stick.

---30---

This timeless piece of “body art” of people having sex in an MRI turns 20
Oh, yes, there is (slightly NSFW) video footage.


JENNIFER OUELLETTE - 12/26/2019


Video courtesy of Improbable Research


There's rarely time to write about every cool science-y story that comes our way. So this year, we're once again running a special Twelve Days of Christmas series of posts, highlighting one science story that fell through the cracks each day, from December 25 through January 5. Today: celebrating the 20-year anniversary of the most viewed article (and accompanying video) in the history of the British Medical Journal.

Christmas just wouldn't be the same for lovers of science without the annual Christmas issue of the British Medical Journal (BMJ). The tradition began in 1982, originally as a one-off attempt to bring a bit of levity to the journal for the holidays. While the papers selected for inclusion evinced a quirky sense of humor, they were also peer-reviewed and scientifically rigorous.

Some of the more notable offerings over the last 37 years included the side effects of sword-swallowing; a thermal imaging study on reindeer offering a possible explanation for why Rudolph's nose was so red; and an analysis of the superior antioxidant properties of martinis that are shaken, not stirred. (Conclusion: "007's profound state of health may be due, at least in part, to compliant bartenders.")

But by far the most widely read Christmas issue paper was a 1999 study that produced the very first MRI images of a human couple having sex. In so doing, the researchers busted a couple of long-standing myths about the anatomical peculiarities of the male and female sexual organs during sex. Naturally, the study was a shoo-in for the 2000 Ig Nobel Prize for Medicine.

Leonardo da Vinci famously studied cadavers to learn about human anatomy. He even drew an anatomical image of a man and woman in flagrante delicto, noting "I expose to men the origin of their first, and perhaps second, reason for existing." However, "The Copulation" (circa 1493) was based not on his own studies, but on ancient Greek and Arabic texts, with, shall we say, some highly dubious assumptions. Most notably, Leonardo depicted a ramrod straight penis within the vagina.


The Copulation as imagined 

by Leonardo da Vinci.
The Royal Collection via MBJ


Midsagittal image of the anatomy of

 sexual intercourse envisaged by
 RL Dickinson and drawn by
 RS Kendall
W.W. Schultz et al./BMJ (1999)


Left: Midsagittal image of the 

anatomy of sexual intercourse
 (labelled). Right: Midsagittal
 image of the anatomy of sexual
 intercourse.
W.W. Schultz et al./BMJ (1999)


The modern era of the science of sex arguably began in the 1930s with gynecologist Robert Dickinson, who sought to dispel the absurd notion of "coital interlocking," whereby the penis penetrates the cervix like a key fitting into a lock. Dickinson's experiments involved inserting a penis-sized glass tube into the vaginas of female subjects aroused via clitoral stimulation, as well as making plaster casts of women's vulvas and vaginas. (His work influenced Alfred Kinsey, whose own research produced the famous Kinsey scale to describe sexual orientation.)

Masters and Johnson revolutionized the field in the 1960s with their own provocative series of experiments on sexual response. Volunteers would have sex while hooked up to instruments in the lab. Masters and Johnson famously participated personally in their experiments, becoming lovers—a development that inspired the 2013 Showtime series Masters of Sex. They identified four stages of the Human Sexual Response Cycle: excitement, plateau, orgasmic, and resolution. Most relevant for the current discussion: they used an artificial penis for some experiments, noting among their findings that the volume of a woman's uterus increased by as much as 50-100 percent during orgasm. However, they acknowledged this might not be accurate due to the artificial nature of their experiments.

The 1999 study was the brainchild of Dutch physiologist Pek van Andel, who co-invented the artificial cornea and hence had a solid academic reputation that enabled him to persuade a hospital in Groningen, the Netherlands, to let him use an MRI machine after hours. But his original intention was to produce a piece of "body art." He'd been inspired by the image of an MRI cross-section of a singer's mouth and throat as she sang and thought it might be possible to use an MRI to take images of human coitus.

His co-authors included gynecologist William Schultz, radiologist Eduard Mooyaart, and anthropologist Ida Sabelis. Sabelis was an actual participant in the first experiment, conducted with her then-boyfriend, identified only as "Jupp." (Others would follow in her pioneering footsteps, including popular science author Mary Roach, who memorably persuaded her husband to participate in an ultrasound imaging sex study for her 2008 book, Bonk.)
Enlarge / Co-author Pek van Andel accepting an Ig Nobel prize for his 1999 MRI study.
YouTube/Improbable Research

The first experiment, with Sabelis and Jupp, took place in 1992. While the latter had some concerns about whether he'd be able to adequately perform while being packed into a noisy metal tube with his partner, he managed to rise to the occasion. The experiment lasted 45 minutes, and the incredible detail of the resulting images rendered Sabelis momentarily speechless. Van Andel was delighted to note that the penis took on a boomerang shape during sex—disproving what Leonardo had depicted in his sketch centuries before. The images also disproved Masters and Johnson's finding that female sexual arousal increases the size of the uterus.

Convinced the images were scientifically relevant, van Andel submitted their findings to Nature. The journal rejected the paper outright. Controversy erupted when the Dutch tabloids got wind of the experiment, and the hospital balked at letting him use the MRI for additional experiments, although van Andel persuaded them to let him continue in the end. Between then and 1999, eight couples and three single women participated in 13 experiments. (Sabelis recently boasted to Vice that she and Jupp were the only couple who'd managed the feat without the aid of Viagra.)

The paper finally found a publisher in the British Medical Journal, whose editors thought the study made a fine addition to their annual Christmas issue. (In the final paper, the authors thanked “those hospital officials on duty who had the intellectual courage to allow us to continue this search despite obtrusive and sniffing press hounds.") Former BMJ editor Tony Delamothe recalled the thought process behind the decision:


Twenty years on, any paperwork relating to the decision to publish is gone, and the memories of editorial staff are hazy (one remembered discussion about how thin the participants must have been to manage intercourse in a 50cm diameter tube). It was possibly the close fit with the da Vinci drawing that swung the decision. Nobody thought the study was particularly useful clinically or scientifically, but it contained “a striking image using a new technology, and everyone agreed that readers might be interested to see it.” Sandy Goldbeck-Wood, the journal’s paper editor at the time, said: “I remember our conversation about it as serious (if wry), rather than ribald. I think the Christmas issue was the only place it would properly have fitted.”

Delamothe puzzles over the enduring appeal of the paper, and he seems to conclude that it's mostly due to the public's prurient interest at "seeing coitus on screen (for free)." But there is now tons of free pornography all over the Internet, yet these images continue to attract interest, and even admiration. Van Andel created a timeless piece of "body art" after all. The sexual act is, as Leonardo observed, "the origin of [our] first, and perhaps second, reason for existing"—and hence a thing of beauty.

DOI: British Medical Journal, 2019. https://doi.org/10.1136/bmj.l6654 (About DOIs).

DOI: British Medical Journal, 1999. 10.1136/bmj.319.7225.1596 (About DOIs).

Listing image by W.W. Schultz et al./BMJ (1999)
We calculated emissions due to electricity loss on the power grid

More carbon emissions come from lost electricity than the chemical industry.


THE CONVERSATION / SARAH MARIE JORDAAN / KAVITA SURANA 

Enlarge
Lawrence Berkeley Lab

When it comes to strategies for slowing the effects of climate change, the idea of reducing wasted energy rarely gets a mention. But our recent Nature Climate Change article makes the case that reducing wastage in the power sector, focusing specifically on the grid, can be a critical lever in lowering national emissions.

Inefficient global power transmission and distribution infrastructure requires additional electricity generation to compensate for losses. And countries that have large shares of fossil fuel generation and inefficient grid infrastructure, or a combination of the two, are the predominant culprits of what we call “compensatory emissions.” These emissions are the result of the extra electricity—often generated from fossil fuels—required to compensate for grid losses.

We calculated that worldwide, compensatory emissions amount to nearly a billion metric tons of carbon dioxide equivalents a year, in the same range as the annual emissions from heavy trucks or the entire chemical industry. In surveying 142 countries’ transmission and distribution infrastructures, we also determined that approximately 500 million metric tons of carbon dioxide can be cut by improving global grid efficiencies.
How we got the numbers

Most electricity is generated at central power stations and sent through high-voltage transmission lines over long distances before being sent locally over what’s called the distribution network—the poles and wires that connect to end consumers. As power moves through that network, resistance in the metal wires causes heat. That results in some of the energy from the fuel used to produce the electricity to be lost in transit.

To quantify greenhouse gas emissions from this process, we used a method called life cycle assessment. Our analysis goes beyond combustion at the power plant alone. We quantified global emissions from cradle to grave: from fuel extraction through combustion at the power plant, then transmission and distribution to the consumer. Our calculations are based on the electricity mix and transmission and distribution losses unique to each country.

Our study showed that losses are highly variable depending on the country. In 2016, aggregate transmission and distribution losses reached 19% in India and 16% in Brazil. But they were over 50% in Haiti, Iraq, and the Republic of Congo. This means that only half of the electricity generated reached or was billed to the consumers as usable power— the other half was lost en route.

In more developed countries, losses were lower: while the United States experienced 6% losses in 2016, 5% was reported for Germany, and Singapore reached 2%. These numbers demonstrate it’s more efficient to transmit power over short distances to large population centers compared to moving power long distances to many dispersed rural customers.
Half of losses and resulting emissions could be avoided

The resulting emissions are real, and so are the solutions. But addressing the factors that reduce transmission and distribution losses is not necessarily a straightforward task.

Technical losses are the simplest to address through the deployment of more advanced technologies and by upgrading existing infrastructure, both for long-distance transmission of power and distribution at the local level. Improvements in transmission can be made, for example, by replacing inefficient wires, using superconductors that reduce resistance in wires, and thus lost energy, and controlling power flow and high-voltage direct current.

Similarly, improvements in distribution can be achieved by better managing the load and distribution of power, as well as how distribution lines are configured. Innovation, such as adopting digital technologies for routing power flows, can also play a role.

Solutions for nontechnical losses are more challenging and may only partially cut associated emissions. The causes of high losses are diverse and can originate in, for example, extreme events, such as the hurricanes that struck Haiti and Puerto Rico in recent years, or war, or a combination of weak governance, corruption and poverty, as seen in India. For either type of losses, countries with large shares of fossil fuel generation and the most inefficient grid infrastructure can cut the greatest emissions and reap the largest environmental benefits from reducing transmission and distribution losses.
Climate impact

While our article highlights several important technological solutions—tamper-proof meters, managerial solutions such as inspection and monitoring, and restructuring a power system’s ownership and regulation—these are clearly only small building blocks that help nations achieve a sustainable path.

Surprisingly, very few countries included transmission and distribution losses in their national commitments to reduce greenhouse gas emission as part of the 2015 Paris Agreement. Our analysis found that only 32 countries mention grid efficiency, while 110 mention some form of renewable energy. With a very leaky grid, some of the money spent to add renewable energy sources will be wasted.

As countries plan to ratchet up climate ambitions in 2020, decarbonizing the power sector will play a vital role. We believe that combining low-carbon electricity with an efficient grid will provide a clean power sector that will improve national infrastructure while minimizing climate damages well into the future.

Sarah Marie Jordaan, assistant professor of Energy, Resources and Environment and Canadian Studies, School of Advanced International Studies, Johns Hopkins University, and Kavita Surana, assistant research professor, Center for Global Sustainability, University of Maryland

This article is republished from The Conversation under a Creative Commons license. Read the original article.
The surprisingly complicated physics of why cats always land on their feet

Ars chats with physicist Greg Gbur about his book, Falling Felines and Fundamental Physics

JENNIFER OUELLETTE - 12/25/2019, arstechnica.com
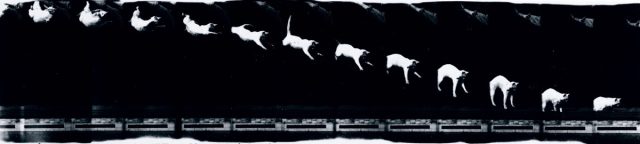
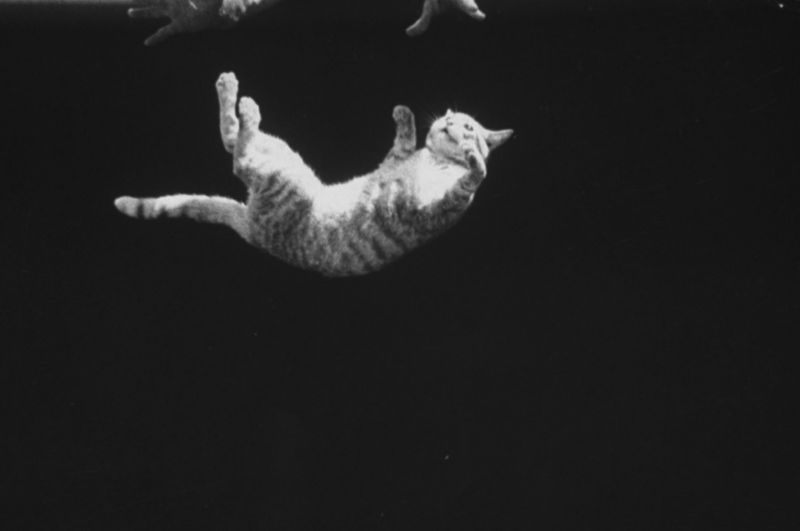
Enlarge / A cat being dropped upside down to demonstrate a cat's
 movements while falling Ralph Crane/The LIFE Picture Collection 
via Getty Images

There's rarely time to write about every cool science-y story that comes our way. So this year, we're once again running a special Twelve Days of Christmas series of posts, highlighting one story that fell through the cracks each day, from December 25 through January 5. Today: an intriguing recent book on the science of why cats always land on their feet.

Scientists are not immune to the alluringly aloof charms of the domestic cat. Sure, Erwin Schrödinger could be accused of animal cruelty for his famous thought experiment, but Edwin Hubble had a cat named Copernicus, who sprawled across the papers on the astronomer's desk as he worked, purring contentedly. A Siamese cat named Chester was even listed as co-author (F.D.C. Willard) with physicist Jack H. Hetherington on a low-temperature physics paper in 1975, published in Physical Review Letters. So perhaps it's not surprising that there is a long, rich history, spanning some 300 years, of scientists pondering the mystery of how a falling cat somehow always manages to land on their feet, a phenomenon known as "cat-turning."

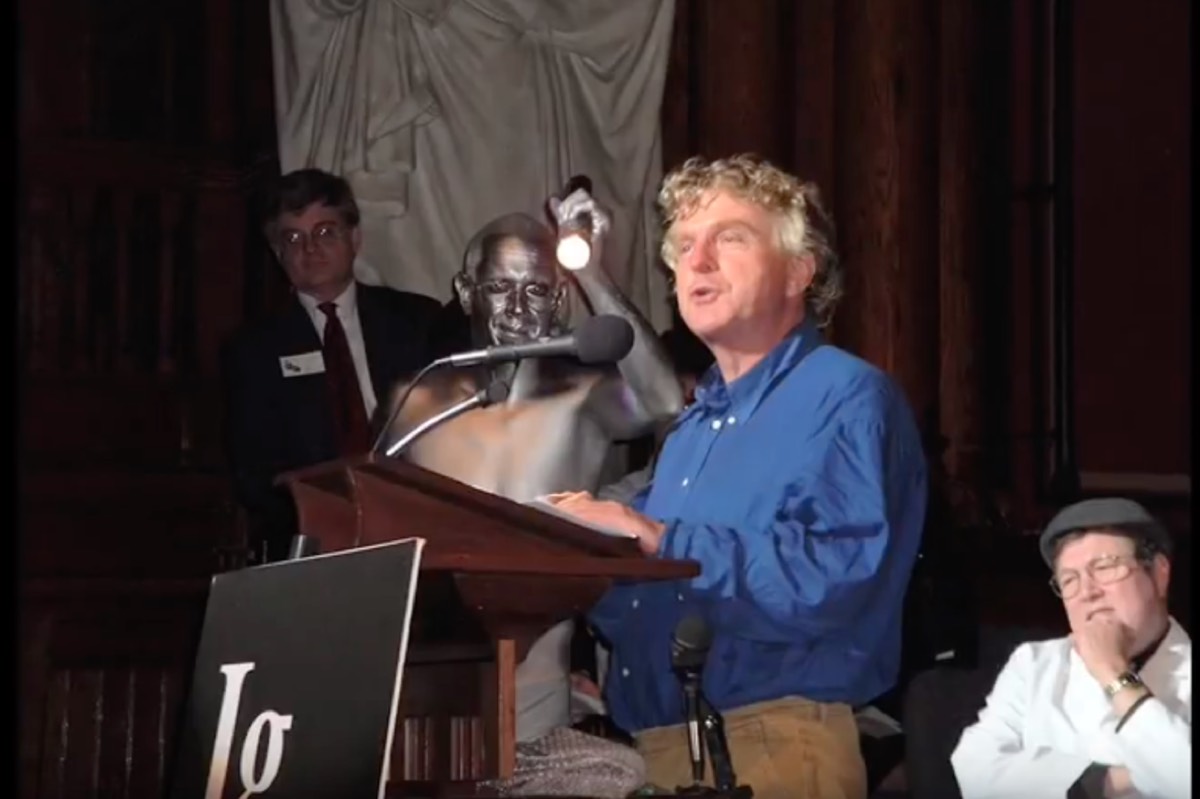
"The falling cat is often sort of a sideline area in research," physicist and cat lover Greg Gbur told Ars. "Cats have a reputation for being mischievous and well-represented in the history. The cats just sort of pop in where you least expect them. They manage to cause a lot of trouble in the history of science, as well as in my personal science. I often say that cats are cleverer than we think, but less clever than they think." A professor at the University of North Carolina, Chapel Hill, Gbur gives a lively, entertaining account of that history in his recent book, Falling Felines and Fundamental Physics.

Over the centuries, scientists offered four distinct hypotheses to explain the phenomenon. There is the original "tuck and turn" model, in which the cat pulls in one set of paws so it can rotate different sections of its body. Nineteenth century physicist James Clerk Maxwell offered a "falling figure skater" explanation, whereby the cat tweaks its angular momentum by pulling in or extending its paws as needed. Then there is the "bend and twist" (not to be confused with the "bend and snap" maneuver immortalized in the 2001 comedy Legally Blonde), in which the cat bends at the waist to counter-rotate the two segments of its body. Finally, there is the "propeller tail," in which the cat can reverse its body's rotation by rotating its tail in one direction like a propeller. A cat most likely employs some aspects of all these as it falls, according to Gbur.

Gbur is quick to offer a cautionary word of advice to anyone considering their own feline experiments: "Please don't drop your cats!"—even in the name of science. Ars sat down with Gbur to learn more about this surprisingly prolific area of research.

Enlarge / Cats are cautiously fond of physics, as Ariel can attest.
Jennifer Ouellette

Ars Technica: What led you to write an entire book about the physics of falling cats?

Greg Gbur: It really started with my love of the history of science and writing about it on my blog. One day, I was browsing old science journals, and I came across an 1894 paper about photographs of a falling cat landing on his feet. I wrote a blog post about it. But I wasn't completely satisfied with the explanation, and I realized there were more papers on the subject. Every time I did a search, I found another paper offering another angle on the problem. Even in the last few weeks of writing the book, I still kept coming across minor little papers that gave me a little bit of a different take on the history. It was surprising just how many papers there were about the falling cat problem. The more you look, the more you find people intrigued by how a cat lands on his feet. It seems like a problem that would be readily solvable.

Ars: Surely one of the issues was that photography hadn't been invented yet, particularly high-speed photography. 

Gbur: Yes. Maxwell did his own preliminary investigations of the subject, but he pointed out that when you drop a cat from roughly two feet, it can still land on its feet, even if you're dropping it upside down. That's a really short period of time. The human eye simply can't resolve that. So it was a problem that was largely not solvable until the technology was there to do high speed photography.

Étienne-Jules Marey did the first high speed photographs of falling down. It was almost an afterthought for him. He was doing all these different high-speed photographs of different animals, because that was his research, studying living creatures in motion. He presented the images of a falling cat, and it genuinely shocked the scientific community. One of the members at the meeting where the photographs were presented, said (and I paraphrase), “This young Marey has presented us with a problem that seems to go against the known laws of physics."

The motions that are depicted in the photographs are quite complicated. The explanation given is part of the truth, but it seemed incomplete. It was good enough to convince physicists that a cat wasn't violating the laws of physics, but it wasn't good enough to convince everyone that it was the right explanation, or the complete explanation.

Ars: You summarize four distinct hypotheses offered at various times to explain the phenomenon of cat turning. So what is the best explanation we have so far for how a cat can turn and fall and land on its feet?

Gbur: This is part of why it was such a challenge: all these different motions play a role. If you're looking at a series of photographs or a video of a falling cat, it becomes almost a psychological problem. Different people, their attention is going to be drawn by different aspects of a motion. But the most important is a bend and twist motion. The cat bends at the waist and counter rotates the upper and lower halves of its body in order to cancel those motions out. When one goes through the math, that seems to be the most fundamental aspect of how a cat turns over. But there are all these little corrections on top of that: using the tail, or using the paws for additional leverage, also play a role. So the fundamental explanation comes down to essentially bend and twist, but then there's all these extra little corrections to it.

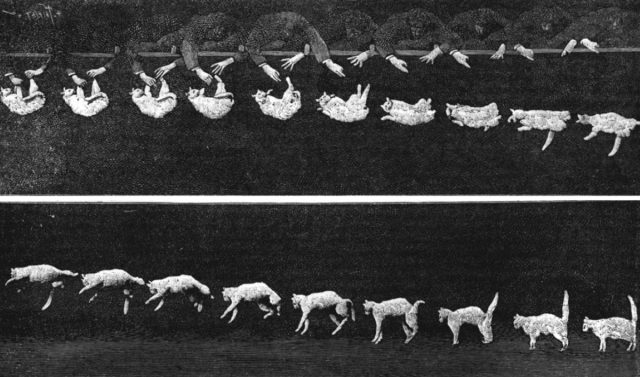
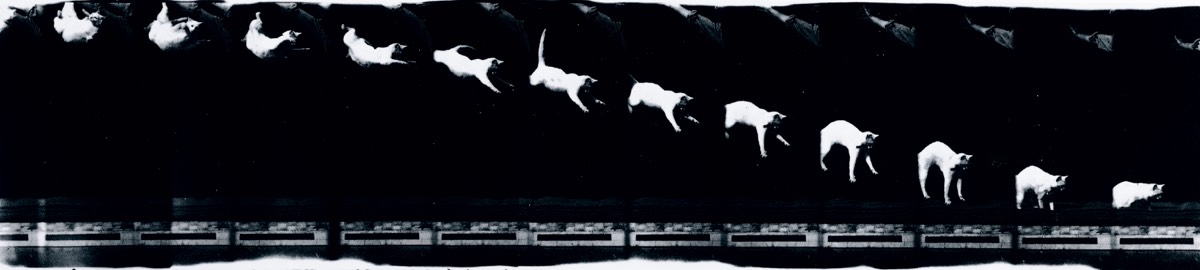
Enlarge / Chronophotograph (circa 1893) made on moving film consisting
of twelve frames showing a cat falling, taken by Etienne-Jules Marey (1830-1904).
SSPL/Getty Images

Ars: After all these studies, do we now know know exactly what's going on with a falling cat, or is this still an area of active research?

Gbur: I don't know that there's anybody actively studying the cat model to try and get the finer details. It's reached a point where understanding how a cat does it has reached, as a 19th century physicist once said, “hunting for higher decimal places.” Part of the catch is that every cat may do things just a little bit differently, because they are living creatures. You have heavier cats and lighter cats. I've got varieties of both at home. Longer cats and shorter cats. Each of them may twist and bend and tuck and turn just a little bit differently.

If you watch videos of falling cats, you will see that a lot of them use their tails to turn over. But we also know that cats without tails can turn over just fine. So from a physics point of view, the problem has reached a level where the details depend on the specific cat. People will still argue about it. I think a lot of physicists don't realize how complicated the problem is, and they're often just looking for a single simple solution. Physicists have an instinct to look for simple solutions, but nature's always looking for the most effective solution. And those two approaches are not always the same.
"From a physics point of view, the problem has reached a level where the details depend on the specific cat."

The emphasis these days is in that robotics area. Can we actually make a robot that can flip over like this, in as effective a way as a cat can. You can design a robot that, if you drop it upside down, can land right side up, but a cat can flip over and land right side up regardless of how it started— whether it's upside down, whether it's spinning, whether it's on its side. There's a video clip of a cat leaping up to grab a toy and it ends up flipping partially end over end as it leaps. And it does multiple twists and nevertheless manages to still land on its feet. That's the sort of thing that I don't think anybody has managed to get a robot to do yet. "Hey, I'm just gonna throw this robot up in the air with any sort of spinning motion I want, and nevertheless, have it still land perfectly on its feet."

Two different approaches to the falling cat problem intersect in robotics. You can use mechanical models to try and understand what a cat is doing, and then you can also use robotics to try and replicate the cat's motion properly. One is an analysis problem, where you're saying, "I want to understand what's going on." The second part is a synthesis problem where you say, "I'm going to try and make a machine that can accurately reproduce it."

Enlarge / Photographs of a Tumbling Cat, 1894.
Étienne-Jules Marey

Ars: You also discuss a 2003 paper by physics philosopher Robert Batterman, in which he examines falling cats in terms of geometric phases, which in turn connects to a Foucault pendulum. Can you elaborate a bit on this particular connection?

Gbur: The basic idea is that there are a lot of physics problems where you can cycle the system. You start with the system and one condition, and you bring it through some change of behavior back to its original condition. But nevertheless it ends with a different behavior than it started. The falling cat is a good example. The cat starts upside down with his back straight, ends up right side up with his back straight. Even though it's twisted and turned along the way, it ends up with a straight back again, but it's now rotated 180 degrees.

Foucault's pendulum is where you have this pendulum oscillating on the earth, a full day goes by, and the earth has done a full revolution. So the pendulum is spatially back where it started at the beginning of the previous day, but it is swinging in a different direction. The really remarkable thing is that the mathematics is structurally similar for all these different problems. So if you understand the falling cat problem, you understand a little bit about Foucault's pendulum and how it works. Batterman also ties falling cats to polarized light and parallel parking as manifestations of the geometric phase in physics.

Ars: It sometimes seems like physicists don't always appreciate how important their own history is to understanding current research.

Gbur: One reason I always emphasize learning a lot of science history is that it gives us a better understanding of how science is done. In basic physics classes, we're often taught a very abbreviated and abridged version of the history, where you're given the straight line path that leads to the end. I think of science history as sort of a maze. You've got a bunch of people wandering through this maze and a lot of people hit dead ends. That's very natural, because nobody knows what they're looking for. When we're taught the history of science in class, we're often only taught about the person who made it to the end of the maze without making any mistakes.

For students, that can give a very false impression that science is always about, "Yes, I know exactly what I'm doing and I know exactly where I'm going." That isn't the case. For the general public, it's often useful to realize that, yes, science is always moving forward, but there are these dead ends, there are these mistakes along the way. It's not perfect. That is not a condemnation of science, but the natural way things work.

---30---
Finding stars that vanished—by scouring old photos
Comparing images taken nearly a century apart.
12/24/2019, arstechnica.com 
First you see it (top left) then you don't.

Before the advent of digital imaging, astronomy was done using photographic plates. The results look a bit like biology experiments gone bad (of which I've perpetrated more than a few), with a sea of dark speckles of different intensities scattered randomly about. To separate the real stars from any noise, astronomers would take multiple images, often at different colors, and analyze the results by eye before labeling anything an actual star. Sounds tough, but by 50 years ago, astronomers had already managed to catalog hundreds of millions of stars in all areas of the sky.

These days, automated telescopes, digital imaging, and software pipelines mean that we can do equivalent surveys with greater sensitivity in a fraction of the time. But that doesn't mean the old surveys have lost their value. The original photographs provide data on how the sky looked before the relative motion of objects (and their occasional explosions) rearranged the sky. To get a better sense of just how much the sky has changed, a group of researchers has been comparing the old photographs and the modern survey data to figure out what stars went missing.

After whittling down a large list of candidates, the team came up with 100 things that looked like stars a century ago but no longer seem to be with us.
In the Navy (and not elsewhere)

There have been several large-scale, all-sky surveys done, and it's possible to compare the results to find objects that have changed between them. There are also dedicated efforts to find short-term "transient" events—objects that brighten or dim on the scale of weeks to months. But these may miss changes that take place gradually over longer time periods or events that happened before modern digital surveys.

To get a better sense of these events, some astronomers have formed a project called VASCO, for "Vanishing and Appearing Sources during a Century of Observations." Their goal is to compare data from the first surveys done on photographic plates to what we've been getting from modern surveys, and then to identify objects that have changed. The hope is that, among other things, having a longer time window will increase the odds of finding an extremely rare event, one that might not occur in the handful of years that separate the digital surveys.

To go back far enough in time, the VASCO team relied on the US Naval Observatory's catalog of objects, which combines the results of several surveys done on photographic plates. All told, this catalog contains over a billion objects. For modern data, the team used the Panoramic Survey Telescope and Rapid Response System (Pan-STARRS) database, which contains even more objects.

Conceptually, the study was simple: it worked by identifying the objects of the earlier catalog and checked whether they were still present in the later one. But there are a number of complications. First, you need to know that the object in the earlier catalog was actually there, not a bit of noise or something misidentified (like an asteroid mislabeled as a star). Then, you must be certain that the modern observations are at the right location to see the object if it's still there.

Finally, you have to make sure the object hasn't moved too much in the intervening time. While that's not an issue for distant stars or even for farther galaxies, stars closer to Earth will have a larger relative motion over the sorts of time involved here. You need to choose a search window large enough to make sure local stars are identified, but not so large that it becomes easy to pick the wrong star as "matching" the missing one.
Finding what's not there

For a first pass, computing time limited the team to examining a bit over half the sky, or about 600 million objects. From that, they come up with about 150,000 potential mismatches, a rate within the known range of data processing errors in sky surveys. So, figuring out what's real in that 150,000 is a substantial challenge, one limited by bringing in data from the Sloan Digital Sky Survey. This immediately found matches for about 65,000 objects, while allowing for relative motion cut the list of potential vanishing acts down to only 23,667 objects. At this point, the researchers examined them all visually.

This allowed the team to identify stuck pixels in the modern digital data or to see imaging artifacts from nearby bright stars. Further elimination eventually produced a final list of 1,691 candidates for vanishing stars.

At this point, the authors analyzed the average properties of the vanishers, finding that they were a bit redder, they varied more between images when multiple images were available, and they had a higher relative motion, suggesting that many were relatively close to Earth.

Those properties suggest one possible explanation for the vanishing act. Red dwarfs in the area of Earth would be dim, have high relative motion, and have light biased toward the red end of the spectrum. They're also prone to extended outbursts, which could have made them detectable at some time points but not others.

In any case, the authors continued to whittle their list down, eliminating 200 objects because of dead pixels in some telescope hardware and a large number where the star is actually present in both old and new images but is slightly offset. This nudged the list down to about 1,000 candidates that seem worth following up on.

What might these be? Aside from red dwarfs, we have a number of possible explanations. It has been proposed (though not verified) that some large stars, rather than exploding in a supernova, may directly collapse into a black hole, swallowing the remains of the star and avoiding the messy (and bright) debris fields that supernovae create. This could cause a star to essentially vanish. Supermassive black holes can disrupt stars or increase or decrease their intake of matter on years-to-decades scales, potentially causing them to brighten and dim dramatically. A bright star eclipsed by a dim companion could also cause stars to briefly vanish.

Then there are known variable types of stars, including Cephids and RR Lyrae stars, both of which brighten and dim regularly. There's also the extremely rare variable R Coronae Borealis stars, of which only 150 are estimated to exist in the Milky Way.

All of these make viable candidates for stars that appear to vanish, as they can simply drop below the detection limits of various telescopes. And, since they're interesting stars, it's worth doing follow-up observations of their former locations to see whether there might be anything dim now residing there.

But the team behind the new paper indicates that the project started with a far more exotic inspiration: Dyson spheres, structures that alien civilizations might build to enclose an entire star and harvest all of its energy. These would obviously cause a star to vanish, though the timescale of its dimming and eventual disappearance would be anyone's guess.

Regardless of the inspiration, the team has identified a large number of objects that might be interesting to astronomers. And that's only with surveying a bit more than half the sky. There also remains the follow-on work of doing the converse analysis—looking for objects that are in present surveys but weren't detected decades ago.

The Astronomical Journal, 2019. DOI: 10.3847/1538-3881/ab570f (About DOIs).


BACK IN ONE PIECE —
Starliner makes a safe landing—now NASA faces some big decisions
Contract says a docking demonstration is needed. Will NASA waive this requirement?

ERIC BERGER - 12/22/2019, arstechnica.com
The Boeing CST-100 Starliner spacecraft is seen after it landed in White Sands, 
New Mexico, Sunday, Dec. 22, 2019.
NASA/Bill Ingalls
The main parachutes begin to deploy as the Boeing CST-100 Starliner spacecraft lands.
NASA/Bill Ingalls
The Boeing CST-100 Starliner spacecraft jettisons the heat shield before it lands.
NASA/Aubrey Gemignani

The Boeing CST-100 Starliner spacecraft is seen landing in this 30 sec. exposure.
NASA/Aubrey Gemignani

Starliner touches down.
NASA/Aubrey Gemignani

Boeing, NASA, and U.S. Army personnel work around the Boeing 
CST-100 Starliner spacecraft shortly after it landed.
NASA/Bill Ingalls

Boeing, NASA, and U.S. Army personnel collect parachutes.
NASA/Bill Ingalls

Boeing, NASA, and U.S. Army personnel work around the 
Boeing CST-100 Starliner.
NASA/Bill Ingalls

A protective tent is placed over the vehicle.
NASA/Bill Ingalls

Boeing’s Starliner spacecraft safely returned from orbit on Sunday morning, landing at White Sands Space Harbor in New Mexico before sunrise. The capsule very nearly hit its bullseye, and initial reports from astronauts on the scene say the vehicle came through in "pristine" condition.

The company will now spend several days preparing Starliner for transit, before shipping it from New Mexico back to Boeing's processing facility at Kennedy Space Center in Florida. Then, engineers will spend most of January reviewing data captured by on-board sensors. What happens after that is the big question.
Mission Elapsed Time anomaly

After the spacecraft launched on board its Atlas V rocket, but before it separated from the booster, the capsule needed to figure out what time it was. According to Jim Chilton, Boeing's senior vice president of the Space and Launch division, the way this is done is by "reaching down into" the rocket and pulling timing data out. However, during this process, the spacecraft grabbed the wrong coefficient. "We started the clock at the wrong time," Chilton said. "The spacecraft thought she was later in the mission and started to behave that way."

The net effect of this is that Starliner's service module thrusters began consuming a lot of propellant to keep the vehicle in a very precise attitude with respect to the ground. When flight controllers realized the error, it took time to establish a communications link because the spacecraft was not where they thought it was.


With the on-board propellant remaining, Starliner did not have sufficient reserves to approach the International Space Station and perform a rendezvous and docking with the orbiting laboratory—a key objective of this flight test before NASA allows its astronauts to fly on the capsule into space.

Much of the rest of the flight went very well, however, once flight controllers diagnosed and corrected the mission elapsed time error. (The clock was off by 11 hours.) The vehicle flew smoothly in orbit, its life support systems kept the spacecraft at good temperatures, and it made a safe and controlled landing on Sunday morning. Chilton said he believes the vehicle will meet 85 to 90 percent of the test flight's objectives.
Good enough?

The question is whether this will be good enough for NASA to proceed with a human test flight of Starliner without a second uncrewed test to determine the capsule's capability to dock to the space station. Part of that decision will depend on the root cause of the problem, and whether it represents a systemic error in Starliner's flight software.

"Make no mistake, this did not go according to plan in every way that we hoped," NASA Administrator Jim Bridenstine said Sunday. Even so, Bridenstine said he fully expects NASA to work with Boeing to get humans flying on Starliner in 2020. Of the software timing error, he said, “It’s not something that is going to prevent us from moving forward quickly.”

However, NASA's "commercial crew" contract with Boeing stipulates several requirements that must be completed by the orbital flight test. "The Contractor’s flight test program shall include an uncrewed orbital flight test to the ISS," the document states. And this test should include, "Automated rendezvous and proximity operations, and docking with the ISS, assuming ISS approval."


After a news briefing on Sunday morning at Johnson Space Center, the deputy director of the commercial crew program, Steve Stich, said NASA will review the contract. "We’ll have to look at that afterwards and try to understand it," he said. "We’ll have to go take a look at what we achieved with what’s in the contract."

Boeing—which presumably would have to pay for a second test flight as part of its fixed-price contract with NASA—certainly would like to be able to convince NASA that it does not need to make a second uncrewed test flight. On the day Starliner landed, it sure sounded like some key NASA officials would like to talk themselves into that as well.

Listing image by NASA/Bill Ingalls