Friday, July 02, 2021

Profitability of new European offshore wind projects in spotlight

Lower internal rates of return and long payoff times taking toll, findings show in Stavanger


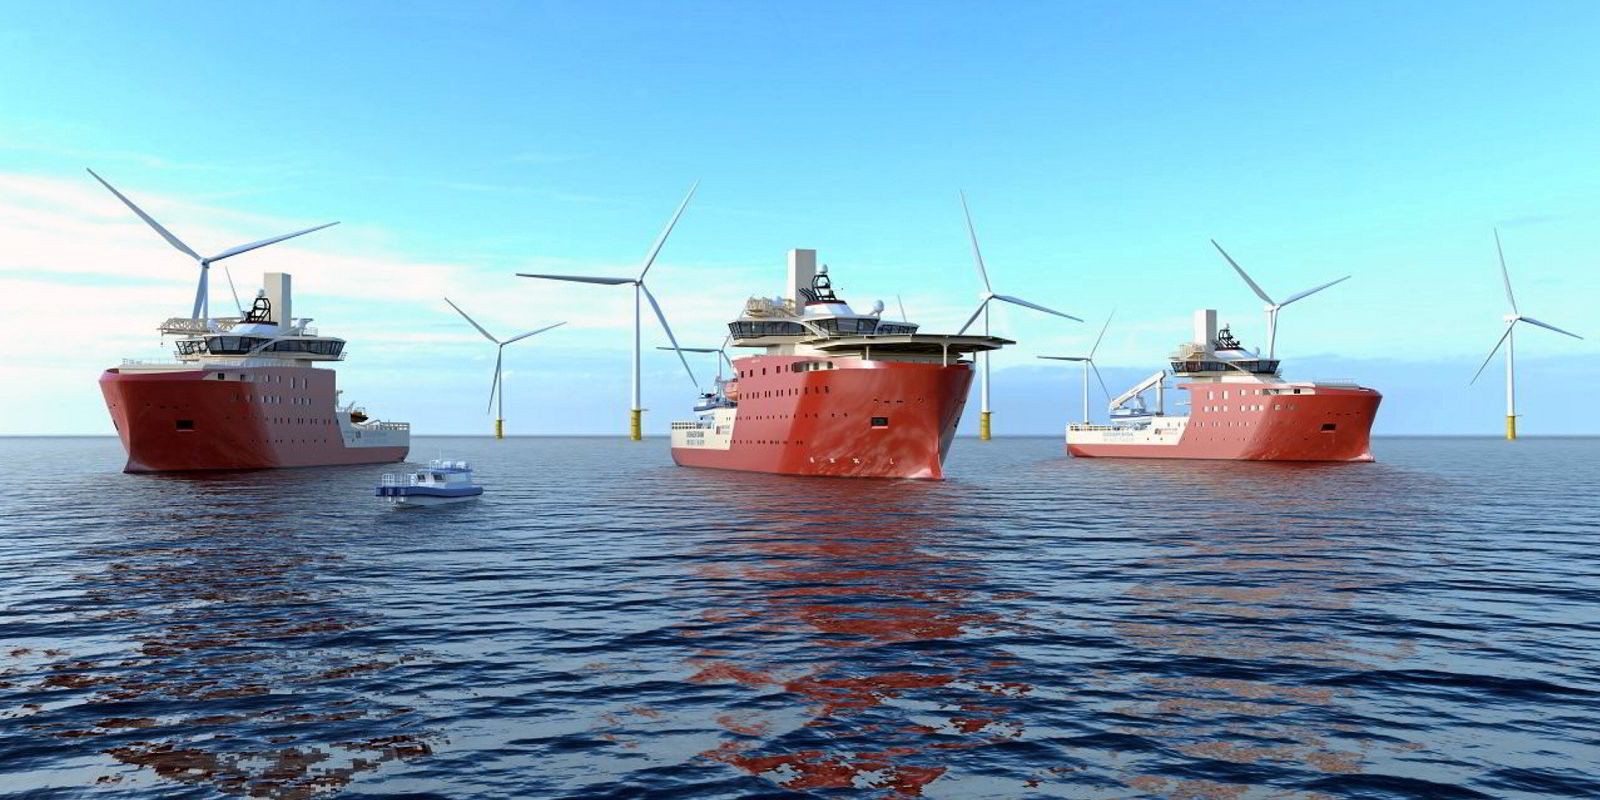
Under construction: North Star Renewables service vessels for the Dogger Bank wind farm
Photo: NORTH STAR RENEWABLES

Shrinking rates of return and long payoff times are eating away at the profitability of some European offshore wind projects, according to new research.


A Norwegian research group has found that the UK's 3.6-gigawatt Dogger Bank — owned by Equinor, SSE Renewables and Eni — has a nominal internal rate of return (IRR) of 5.6% and a payback time of 17 years.

Gain valuable insight into the global oil and gas industry's energy transition from ACCELERATE, the free weekly newsletter from Upstream and Recharge.
Sign up today

The findings, by Petter Osmundsen and Sindre Lorentzen — professor and associate professor at the University of Stavanger's industrial economics section — and Magne Emhjellen, senior economist at Norwegian oil and gas player Petoro, suggest that potential profits from offshore wind in Europe are falling fast.


Oil majors BP and Total win in giant UK offshore wind lease round
Read more

The research was published in the conference proceedings of the International Association for Energy Economics' annual meeting.

The research group, which has received funding from the Norwegian Ministry of Petroleum, has made transparent project calculations for selected bottom-fixed UK offshore wind farms.

Osmundsen explained that the background for the development is aggressive bidding for contracts for difference in the UK.

“We have seen the strike price" — the fixed price offered as an incentive for wind energy development — "fall from around £150 [$208] per megawatt hour to around £40 per MWh in the auction rounds (in 2012 terms),” he said.

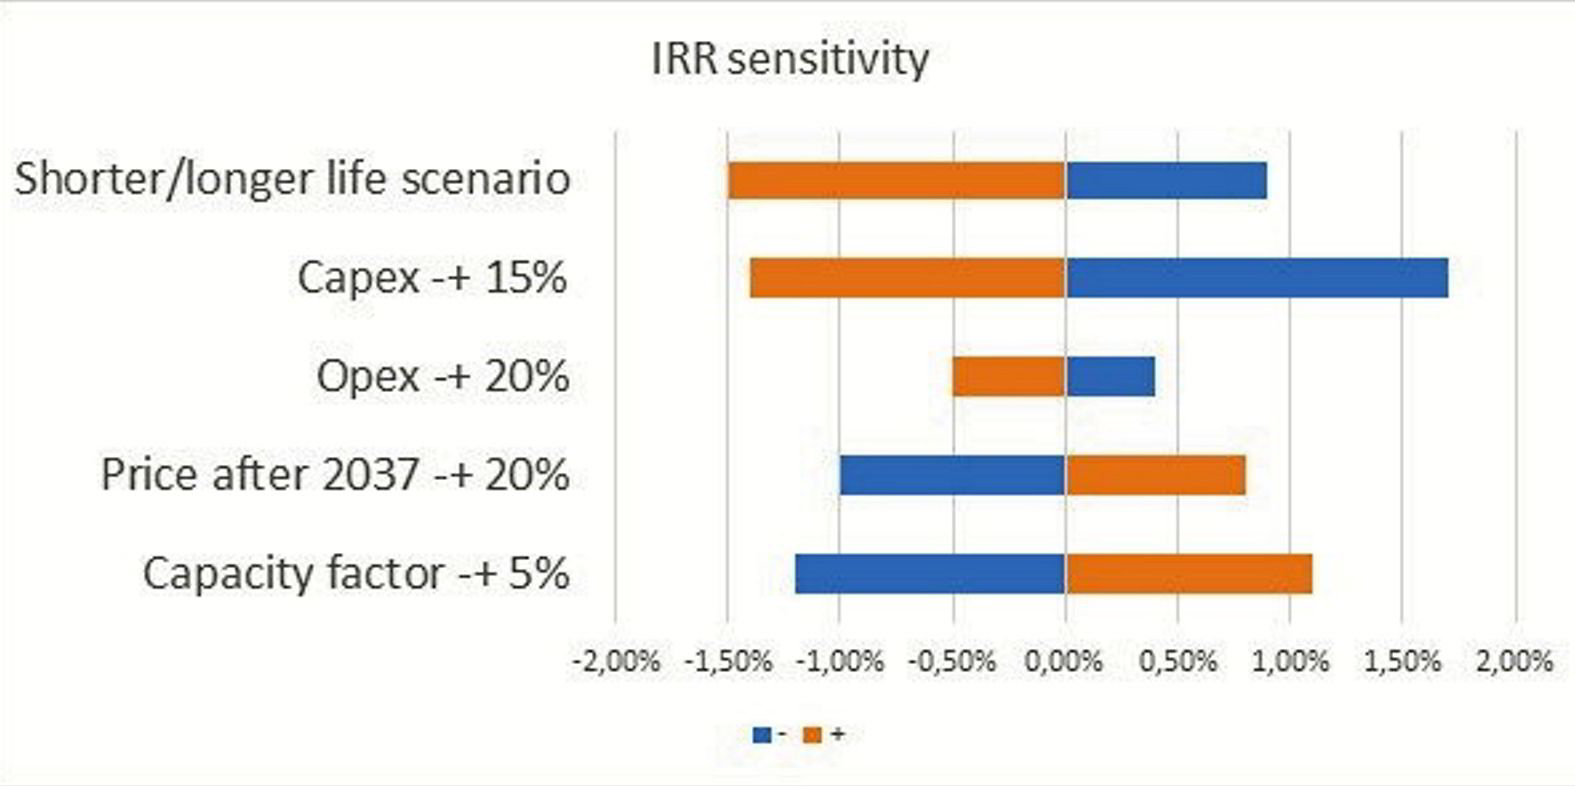
Researchers have accounted for lower risk in oil and gas by reducing the required rate of return. The shorter/longer life scenario is an expected 25 years, plus or minus five years. The price sensitivity is for the period after the contracts for difference terms Photo: Chart PETTER OSMUNDSEN ET AL

The researchers made project calculations for the Dudgeon wind farm off eastern England, which was commissioned in 2017 with a strike price of £150 per MWh, and Dogger Bank, which is under construction off north-east England, with a strike price of £40 per MWh.


Concerns raised over Equinor's growing project finance debt for renewables
Read more

They found an expected nominal IRR at Dudgeon of 9% and a payback time of 12 years, compared with Dogger Bank's 5.6% and 17 years.

According to the researchers, the expected IRR over a limited number of years has therefore dropped 38%.

They also calculated IRR sensitivities of Dogger Bank.

“We have calculated the expected IRR of the Eni purchase of 20% of the Dogger Bank project at 2.4%, nominal. The IRR for the sellers, Equinor and SSE, increased by 0.7% by the sale,” Osmundsen said, explaining that the increase in return is much lower than for previous farm-outs in offshore wind.(Copyright)

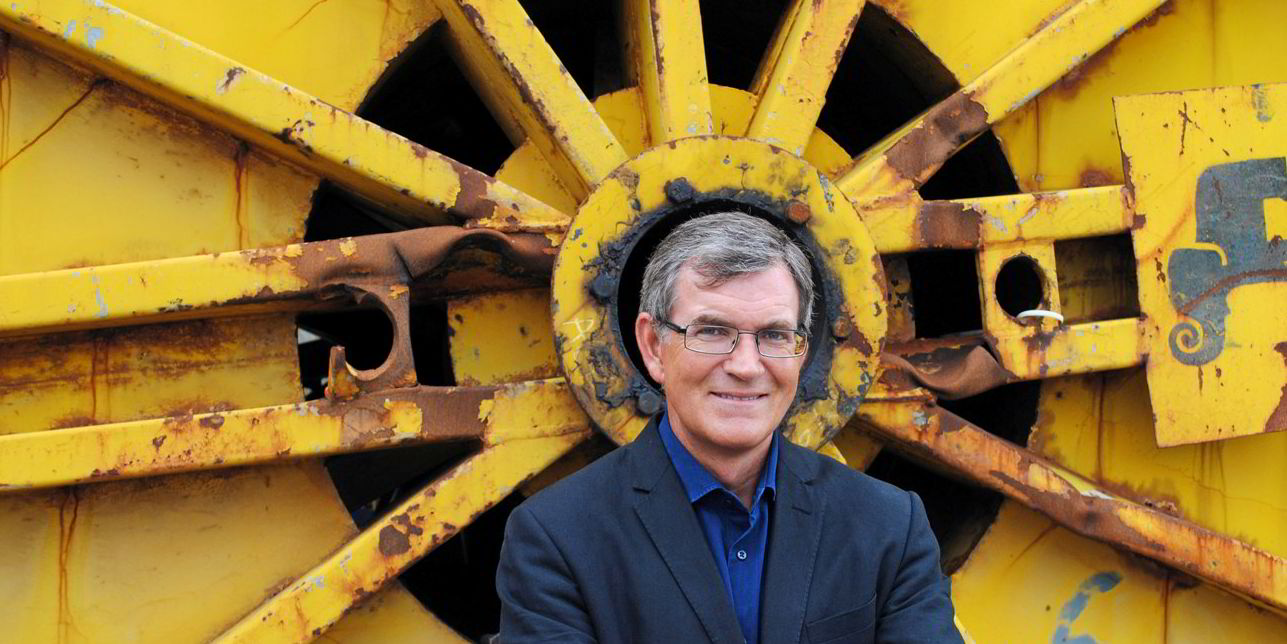
Research: University of Stavanger petroleum economics professor Petter Osmundsen Photo: UNIVERSITY OF STAVANGER


Laser 'comb' systems measure all primary greenhouse gases in the air

NIST laser 'comb' systems now measure all primary greenhouse gases in the air
NIST researchers used a laser frequency-comb instrument (illustration at lower right) to simultaneously measure three airborne greenhouse gases -- nitrous oxide, carbon dioxide and water vapor -- plus the major air pollutants ozone and carbon monoxide over two round-trip paths (arrows) from a NIST building in Boulder, Colo., to a reflector on a balcony of another building, and another reflector on a nearby hill. Credit: N. Hanacek/NIST

Researchers at the National Institute of Standards and Technology (NIST) have upgraded their laser frequency-comb instrument to simultaneously measure three airborne greenhouse gasses—nitrous oxide, carbon dioxide and water vapor—plus the major air pollutants ozone and carbon monoxide.

Combined with an earlier version of the system that measures methane, NIST's dual  technology can now sense all four primary greenhouse gasses, which could help in understanding and monitoring emissions of these heat-trapping gasses implicated in climate change. The newest comb system can also help assess urban air quality.

These NIST instruments identify gas signatures by precisely measuring the amounts of light absorbed at each color in the broad laser spectrum as specially prepared beams trace a path through the air. Current applications include detecting leaks from oil and gas installations as well as measuring emissions from livestock. The comb systems can measure a larger number of gasses than conventional sensors that sample air at specific locations can. The combs also offer greater precision and longer range than similar techniques using other sources of light.

NIST's latest advance, described in a new paper, shifts the spectrum of light analyzed from the near-infrared into the mid-infrared, enabling the identification of more and different gasses. The older, near-infrared comb systems can identify  and methane but not nitrous oxide, ozone or .

Researchers demonstrated the new system over round-trip paths with lengths of 600 meters and 2 kilometers. The light from two frequency combs was combined in  and transmitted from a telescope located at the top of a NIST building in Boulder, Colorado. One beam was sent to a reflector located on a balcony of another building, and a second beam to a reflector on a hill. The comb light bounced off the reflector and returned to the original location for analysis to identify the gasses in the air.

A frequency comb is a very precise "ruler" for measuring exact colors of light. Each comb "tooth" identifies a different color. To reach the mid-infrared part of the spectrum, the key component is a specially engineered crystal material, known as periodically poled lithium niobate, that converts light between two colors. The system in this experiment split the near-infrared light from one comb into two branches, used special fiber and amplifiers to broaden and shift the spectrum of each branch differently and to boost power, then recombined the branches in the crystal. This produced mid-infrared light at a lower frequency (longer wavelength) that was the difference between the original colors in the two branches.

The system was precise enough to capture variations in atmospheric levels of all of the measured gasses and agreed with results from a conventional point sensor for  monoxide and nitrous oxide. A major advantage in detecting multiple gasses at once is the ability to measure correlations between them. For example, measured ratios of carbon dioxide to nitrous oxide agreed with other studies of emissions from traffic. In addition, the ratio of excess carbon monoxide versus carbon dioxide agreed with similar urban studies but was only about one-third the levels predicted by the U.S. National Emissions Inventory (NEI). These levels provide a measure of how efficiently fuel combusts in emissions sources such as cars.

The NIST measurements, in echoing other studies suggesting there is less carbon monoxide in the air than the NEI predicts, put the first hard numbers on the reference levels or 'inventories' of pollutants in the Boulder-Denver area.

"The comparison with the NEI shows how hard it is to create inventories, especially that cover large areas, and that it is critical to have data to feed back to the inventories," lead author Kevin Cossel said. "This isn't something that will directly impact most people on a day-to-day basis—the inventory is just trying to replicate what is actually happening. However, for understanding and predicting air quality and pollution impacts, modelers do rely on the inventories, so it is critical that the inventories be correct."

Researchers plan to further improve the new comb instrument. They plan to extend the reach to longer distances, as already demonstrated for the near-infrared system. They also plan to boost detection sensitivity by increasing the  power and other tweaks, to enable detection of additional gasses. Finally, they are working on making the system more compact and robust. These advances may help improve understanding of air quality, specifically the interplay of factors influencing ozone formation.


Explore further

'Agricomb' measures multiple gas emissions from... cows

More information: Fabrizio R. Giorgetta et al, Open-Path Dual-Comb Spectroscopy for Multispecies Trace Gas Detection in the 4.5–5 µm Spectral Region, Laser and Photonics Reviews (2021). DOI: 10.1002/lpor.202000583
Mapping the hottest temperatures around the world

From 49.6C in Canada to 53.2C in Kuwait, Al Jazeera looks at where the hottest places are on Earth.


By Mohammed Haddad
1 Jul 2021

June was an exceptionally hot month for several countries in the northern hemisphere. Since Friday June 25, at least 486 sudden deaths have been recorded in Canada’s British Columbia province as temperatures soared to nearly 50C (122F). In the United States, the ongoing heatwave has buckled highways and melted power lines. A so-called “heat dome”, where high pressure traps the heat, is being blamed for the excessively high temperatures.

Record-breaking temperatures


On June 29, Lytton, a small town about 200km (124 miles) from Vancouver, hit 49.6C (121F), setting a national record for the highest temperature ever recorded across Canada. Schools, universities and vaccination centres were closed across British Columbia.

Just south of the border in the US state of Oregon, the city of Portland hit an all-time high of 46.6C (116F), breaking the previous high of 41.6C (107F), first set in 1965.


Kuwait – the hottest place on Earth in 2021

On June 22, the Kuwaiti city of Nuwaiseeb recorded the highest temperature in the world so far this year at 53.2C (127.7F). In neighbouring Iraq, temperatures reached 51.6C (124.8F) on July 1, 2021, with Omidiyeh, Iran, not far behind with a maximum temperature of 51C (123.8F) recorded so far. Several other countries in the Middle East, including the United Arab Emirates, Oman and Saudi Arabia, recorded temperatures higher than 50C (112F) in June.

The Gulf is known for its hot and humid climate with temperatures regularly exceeding 40C (104F) in the summer months.


Hottest temperatures ever recorded

The map below shows the hottest temperatures ever recorded in each country around the world. At least 23 countries have recorded maximum temperatures of 50C (122F) or above.

Currently, the highest officially registered temperature is 56.7C (134F), recorded in California’s Death Valley back in 1913. The hottest known temperature in Africa is 55C (131F) recorded in Kebili, Tunisia in 1931. Iran holds Asia’s hottest official temperature of 54C (129F) which it recorded in 2017.

In 2020, Seymour Island in Antarctica recorded a maximum temperature of 20.7C (69.3F). According to the United Nations’ World Meteorological Organization (WMO), temperatures on the Antarctic Peninsula have risen by almost 3C (5.4F) over the past 50 years.


How temperature is measured

The temperature that you see on the news or on the weather app on your phone relies on a network of weather stations positioned around the globe. To ensure accurate readings, weather stations use specialist platinum resistance thermometers placed in shaded instruments known as a Stevenson screen at a height of 1.25-2 metres (4-6 feet) above the ground.


There are two well-known scales used to measure temperature: Celsius and Fahrenheit. Only a few countries, including the US, use Fahrenheit as their official scale. The rest of the world uses the Celsius scale named after Swedish astronomer Anders Celsius who invented the 0-100 degree freezing and boiling point scale in 1742.


The world is getting hotter

A report published by NASA’s Goddard Institute for Space Studies (GISS) found that the Earth’s global average surface temperature in 2020 tied with 2016 as the warmest year on record.

GISS Director Gavin Schmidt said, “The last seven years have been the warmest seven years on record, typifying the ongoing and dramatic warming trend. Whether one year is a record or not is not really that important – the important things are long-term trends. With these trends, and as the human impact on the climate increases, we have to expect that records will continue to be broken.”


SOURCE: AL JAZEERA

CLIMATE CHANGE 
BC Flood warning in effect for Upper Fraser, Chilcotin rivers amid 'astounding' snowmelt
© Submitted by Ministry of Transportation, McBride office The Fraser River rises beneath the Highway 16 bridge near McBride on Wednesday morning. Officials say the bridge is not at risk.

Flood watches for two major rivers in B.C.'s Interior have been upgraded to warnings as river levels continue to rise amid the heat wave affecting most of the province.

The Upper Fraser River and Chilcotin River are both expected to, or have already, exceeded their banks.

Temperatures in both regions, while forecast to cool on Thursday, are still well above normal.

McBride, B.C., located on the Fraser River in the Robson Valley, is forecast to reach 38 C on Wednesday and 31 C Thursday and Friday. The seasonal average is 21 C.


On Wednesday, emergency officials said the Fraser River is rising rapidly in the Robson Valley, as high heat melts glaciers and snow capped mountains between Prince George and Jasper, Alta.

"Glaciers are melting because the temperature is really extreme out there," Anita de Dreu, emergency services co-ordinator for the Regional District of Fraser Fort George, told CBC News on Wednesday.

"The temperature is really extreme out there. Once that melt starts to happen, it takes a very drastic drop in temperature for that to stop, and that's not going to happen."

De Dreu says the Fraser is the highest locals have ever seen.

The B.C. River Forecast Centre called the amount of snowmelt at the higher elevations "astounding."

In a warning issued this week, the forecast centre said the snowpack is melting at a rate of up to 100 millimetres of snow water equivalent each day.

Emergency officials say lightning storms forecast for Wednesday may dump more precipitation into the rising Fraser River.

De Dreu says one family in the Robson Valley has already left their home. Occupants of five other houses are sandbagging. She says many more riverfront homes could also be affected.

"We're encouraging residents to bring your livestock and your animals to higher ground."

Several roads in the McBride area have been affected by ground movement or flood water.

Properties in the Robson Valley and areas from Sinclair Mills upstream to Torpy, Dome Creek, Dore River, McBride and surrounding tributaries, are affected by the flood watch on the Upper Fraser River.

While emergency officials closely monitor the water levels in the Fraser and its tributaries, they're also preparing for the possibility of a wildfire.

"We are very concerned about fire starts and how fast those fires will start and spread," said de Dreu "It's unusual to be dealing with flooding and a wildfire potential at the same time."

Meanwhile, in the Chilcotin, the B.C. River Forecast Centre says the extremely hot temperatures are triggering an "unprecedented" amount of snowmelt.

Included in the Chilcotin River flood warning are the Taseko River, Chilko River, Chilcotin River, Big Creek and surrounding tributaries draining from the Chilcotin Mountains.

Flood watches are also in effect for the Morice River near Houston and the Klinaklini River and its tributaries. A flood watch means the rivers may overflow and cause local flooding.
$1.9B a year to address natural disasters in Canada among 4 takeaways from federal climate report

Increasing number of lawsuits target government over climate policies, report says

Chris Arsenault · CBC News · Posted: Jun 29, 2021 
A construction worker uses a misting fan to cool down at a work site in Vancouver on Monday during a record heat wave in B.C. (Ben Nelms/CBC)

VIDEOS AT THE END

With British Columbia recording its hottest temperatures on record, the federal government released its latest major report on climate change, probing how a warming planet will impact everything from infrastructure to tourism and geopolitics.

The costs of natural disasters from extreme weather are rising rapidly, averaging $1.9 billion annually, up about $400 million from a decade ago, a senior official with Natural Resources Canada told journalists on Monday.

"There is abundant research indicating that current efforts to adapt are insufficient in the face of rapidly accumulating social and economic losses from current and future climate change impacts," according to the report, Canada in a Changing Climate: National Issues.

"Research also demonstrates that the window for taking action to reduce increasingly severe impacts is rapidly closing."

Covering legal risks, shipping routes, farming, migration and more, here are four key takeaways from the 734-page report released on Monday afternoon.
Infrastructure threats

From bridges to sewage systems, Canada's infrastructure is already stressed and aging.

"Much of Canada's core public infrastructure is operating beyond its expected lifecycle and needs replacement or retrofitting," the report said.
WATCH | What's causing the unprecedented heat wave in Western Canada:


What's causing the unprecedented heat wave in Western Canada6 days ago
3:52David Phillips, senior climatologist for Environment Canada, says the high-pressure heat dome over parts of Western Canada creates an effect that's like 'putting a lid on boiling water.' 3:52

Climate change adds a "frightening" dimension to aging infrastructure, Fiona Warren, a senior official with Natural Resources Canada, told reporters on Monday.

Cracking pavement, a reduced lifespan for asphalt, buckling rails impacting freight transport and the increased deterioration of buildings are just some of the threats.

'Heat dome' settles in across Western Canada, bringing sweltering temperatures

Remote, rural communities are expected to be the most affected by infrastructure gaps caused by global warming, Warren said. "Those who are struggling will be hit the hardest."

Spending $1 on improving and adapting infrastructure for climate change now can lead to between $5 and $6 in benefits later, she said. "Adaptation is occurring and increasing, but it is not keeping pace."
Rising legal risks for government, companies

Angry about what they consider government inaction on climate issues, campaigners are increasingly turning to the courts to try to compel change.

"Climate change litigation is increasing against governments and their agencies in Canada," the report said.

Spurred on by successful legal challenges against climate policies in the Netherlands and Pakistan, Canadian plaintiffs have launched four separate lawsuits against governments as of Sept. 30, 2020.

A person walks past a climate change-themed nature mural on Earth Day in Toronto on April 22, 2021. The extent of summer sea ice in the Canadian Arctic has been declining between five and 20 per cent in the last decade, the federal report said. (Nathan Denette/The Canadian Press)

Prior to 2018, there were only two Canadian cases in which courts were asked to review alleged climate inaction from the federal government, the report noted.

Following court cases in the United States, campaigners are also likely to target corporations over their climate policies, it added.

Ninety major companies produced nearly 70 per cent of the world's climate-changing carbon dioxide emissions between 1751 and 2017, according to academic data cited in the government's report, meaning energy and resource firms are particularly vulnerable to climate-related lawsuits.

"All public companies are required to demonstrate how they are managing material risk," Paul Kovacs — executive director of the Institute for Catastrophic Loss Reduction at Western University in London, Ont., and one of the report's many authors — told reporters on Monday.

How companies disclose those climate risks is likely to become a key flashpoint for lawsuits targeting corporate officials in the future, the report said.

"Canadian securities regulators have a wide variety of powers to prosecute companies, their directors and responsible officers for disclosure offences," it said.

"Litigation, even if unsuccessful against a company, may be extremely costly to the company and its insurers, may have significant reputational implications and could potentially impact the company's access to capital."
Geopolitics: Arctic shipping changes, migration pressures

Climate change is having an impact on shipping in the Arctic, the report said, along with changing geopolitics around military readiness, migration and aid.

"With the rapid retreat of sea ice in the Arctic Ocean and increased physical access to the region and its resources, the Arctic is now on the world stage," the report said.

The icebreaker Tor (R) is shown at the port of Sabetta at the Kara Sea shoreline on the Yamal Peninsula in the Arctic Circle, some 2,450 kilometres from Moscow, in 2016. Climate change is expected to open the Arctic to more shipping, with geopolitical implications. (Kirill Kudryavtsev/AFP/Getty Images)

The extent of summer sea ice in the Canadian Arctic has been declining between five and 20 per cent in the last decade, the report said, including in areas spanning the Northwest Passage.

The shipping distance between New York and Shanghai through the Northwest Passage is about 20 per cent shorter than through the Panama Canal, a popular current route for the container traffic underpinning global commerce, according to the report.

While new shipping routes are set to open, it remains unclear how these spaces will be governed and regulated. "Canada's transboundary marine and freshwater agreements were not created with climate change in mind," the report said.
WATCH | Antigonish, N.S., aims to become Canada's 1st net-zero emissions community:


Antigonish, N.S., aims to become Canada’s 1st net-zero emissions community


The integrity of military bases and equipment could also be at risk from climate change.

While the U.S. has identified its military assets and operations most vulnerable to climate change as a basis for setting priorities, Canada has not, the report said.

Catherine McKenna won't be seeking re-election, plans to devote efforts to fighting climate change

Increased natural disasters and crop failures in the world's poorest countries are also likely to trigger increased migration flows and more demands for aid, it said, noting that recent studies project a 50 per cent increase in displacement risks with each additional degree in Celsius of warming.

A silver lining in tourism, agriculture?


Agriculture in parts of the Prairies could get a boost from climate change due to a longer growing season, officials said, adding that tourism in the Far North and other regions could benefit from warmer temperatures.

They stressed, however, that the drawbacks far outweigh the benefits.


Climate change makes invasive moth caterpillars a bigger problem4 days ago
2:01LDD moth caterpillars, once known as gypsy moth caterpillars, have invaded forests and parks in Ontario and some parts of Quebec, and climate change is turning them into a bigger problem. 2:01

It's unclear exactly how much new land could be opened to farming as temperatures warm or how much climate change could improve yields in some northerly areas, officials said, especially as flooding, heat waves and pestilence are expected to get worse.

Even these silver linings could prove to be a "double-edged sword," said Catherine Lafleur of Natural Resources Canada.

"Last-chance tourism" — such as Canadians travelling to see icebergs or polar bears in the Far North "while those are still available" — could increase, she said.

Why an invasive moth caterpillar infestation is breaking records in central Canada

But winter tourism such as skiing "could take a big hit," Lafleur said, noting that some ski resort operators are starting to leverage their facilities for summer activities in the face of warming winters.

"Planning ahead is key in terms of realizing potential benefits," she said.


By  on June 30, 2021

The Canadian government has said it wants to accelerate its self-imposed deadline to ensure the sale of all light-passenger vehicles be of the zero-emissions variety by 2040. According to statements made by Transport Minister Omar Alghabra on Tuesday, Canada’s new target should be 2035. That presumably leaves customers with a little over a decade to enjoy internal combustion engines, though the realities of transitioning into an entirely electric automotive infrastructure may push back that date substantially.

Alghabra noted that the target was “ambitious, undoubtedly, but it is a must,” adding that the ruling Liberal Party believed it was possible with an elevated amount of determination, focus, and effort. He also stated that more funding will be required to meet the new goal, coordinated with additional government regulations. 

While hardly what one would consider a free-market approach, Canada’s Liberal government has pledged to achieve net-zero CO2 emissions by 2050. That date remains in place. However, the updated automotive timeline is likely to affect interim targets and necessitate new restrictions to have any hope of being met. Currently, zero-emission vehicles account for somewhere between three and four percent of new vehicle registrations in Canada under the most generous of estimates. But the plan calls for that share to rise to ten percent by an ambitious 2025 before the revised objectives can be taken into account.

The Global Automakers of Canada (GAC) suggested that it agreed with the decision in principle but expressed concerns about the logistical issues associated with transitioning entirely to battery electric vehicles in just 14 years. That means they don’t think it’s all that realistic and it’s a take we’re inclined to agree with in one of those rare instances we find ourselves taking the side of lobbying groups.

“We share the government’s ultimate objective of carbon elimination but find today’s announcement lacking in the details that will be required for Canada to successfully make the transition to 100 percent ZEV sales by 2035,” GAC President David Adams said in a prepared statement. “We look forward to further consultations with the government to elaborate on Canada’s plan for infrastructure investment, enhancement of manufacturing supply chains and coordinated federal and provincial policies which will facilitate the transition to carbon neutral mobility in Canada.”

GAC alleges that the global automotive industry has already committed to investing over $330 billion ($267 billion USD) to bring ZEVs to market, adding that a minimum of 125 new models are planned for Canada by 2025.

According to Automotive News, the Paris-based International Energy Agency (IEA) also had its say on the matter — stating that light-duty automobiles would all need to be converted to ZEV products (likely EVs) by 2035 to create a zero-emissions global society by 2050. Though we’ve no idea how they can assume the former is even possible when manufacturing and shipping goods are bound to require energy and produce pollution, regardless of whether or not we’re using battery power.

From AN:

According to the IEA, more than 20 countries to date have announced the full phase-out of internal combustion engine (ICE) car sales over the next 10-30 years. Moreover, more than 120 countries have announced economy-wide net-zero emissions pledges that aim to reach net zero in the coming few decades.

Environment Minister Jonathan Wilkinson said with the tougher goal the country would work with the U.S. on fuel efficiency and consult with stakeholders on new regulatory measures.

He said harmonized rules would drive more accelerated ZEV deployment in the two countries.

“We are not alone in committing to 2035. This is absolutely where the world is going. This where the world needs to go,” Wilkinson said. “We must reduce our emissions.”

Technically speaking, we already have. Overall U.S. carbon dioxide emissions (which are often used as a general representation of environmental progress) have declined substantially since 2007, with some of the largest decreases taking place after 2017. By contrast, Canada’s total greenhouse gas emissions are substantially lower overall but have remained relatively flat since their gradual rise in the 1990s. Canadian per capita CO2 emissions have fallen by meaningful amounts, however, mimicking the overall trajectory and timeline of the United States.

[Image: Imagenet/Shutterstock]

OPINION
Picture of greenhouse gases tied to Canadian lending is taking shape


JEFFREY JONES
GLOBE & MAIL
DATED JULY 1, 2021

This is the year of climate and finance, and Canada is now getting a glimpse into one of the trickiest parts of that combo.

Vancouver City Savings Credit Union has released a report showing annual greenhouse gases emitted by its business and consumer borrowers total 105,314 tonnes, or 36 times those of its own operations. It is the first Canadian financial institution to release such a report, but it won’t be the last.

These are what are known as financed emissions, a topic now getting a lot of air time. The credit union’s emissions are a tiny fraction of the global total, but how it determined the number is a good guide to the complex science of tallying greenhouse gases – and what Canada’s big banks face as they prepare their own reports.

It’s no easy task. Think about it: Banks and other financial institutions lend, often in syndicates, to myriad businesses so they can expand operations or buy new equipment. Sometimes these activities are carbon intensive. In addition, they finance millions of consumer purchases such as houses and vehicles – each with its own emissions profile. Also included are calculations related to investments, such as mutual funds.

Climate looms large for incoming head of OSFI

TC Energy, Pembina plan carbon transportation and sequestration project in Alberta

Vancouver City Savings, or Vancity, calculated its financed emissions using methods developed by a six-year-old international body called the Partnership for Carbon Accounting Financials, or PCAF. All of Canada’s major banks and a few other institutions, such as Alberta Investment Management Corp., have committed to the program.

Fourteen Dutch institutions started PCAF with the goal of harmonizing the approach of figuring out the finance world’s impact on climate change as countries try to meet their Paris Agreement commitments. It now includes more than 135 global lenders and fund managers representing US$40.4-trillion of assets.

As a credit union, Vancity’s lending is limited to residential and commercial mortgages, small and medium-size business loans, and auto and other consumer loans. It does not finance fossil fuel companies, as the major banks do.

Commercial real estate loans accounted for the most at 52,528 tonnes of CO2 equivalent in 2020, followed by residential mortgages at 31,162. In terms of tonnes of CO2 emitted per dollar lent, the vehicle loans are the highest at 179, followed by general purpose business loans at 80, commercial mortgages at 9.6 and residential mortgages at 2.4. Among investments including mutual funds and asset management activities, emissions are 36.8 tonnes of CO2 per dollar invested.

Vancity has a total of $19.9-billion in loans outstanding, and its calculation of emissions covers 93 per cent of that total in this initial report. The PCAF methods assign scores for data quality, as some of the information is estimated based on accepted multipliers. Vancity’s numbers are at the low end of the quality scale; it admits it can’t track precise emissions from every home and building on which it holds a mortgage. But that is expected to improve as it assembles more data in coming years.
Canadian financial institutions that have committed to measure and disclose the greenhouse gas emissions associated with their portfolio of loans and investments
Millions of U.S. dollars (lending and investments)

Disclosed


https://s3.amazonaws.com/chartprod/kYXoyRJD97HQMXH3K/thumbnail.png


The numbers have some practical business uses. The credit union can use some of the results to make suggestions to clients on such things as improving building efficiency with, say, better insulation or switching from natural gas furnaces. They also provide a road map for the institution’s own net-zero emissions goal of 2040.


The financial world’s contribution to global emissions is set to take up a big part of the agenda for UN talks in Glasgow, Scotland, in November. Financed emissions are a big deal in the discussion – they account for 700 times that of the greenhouse gases emitted by banks and insurers themselves, according to CDP, formerly the Carbon Disclosure Project.

Banks around the world, under pressure from regulators, governments and their own investors, have had to face their role in funding industrial and consumer activities that emit CO2. Job One is tallying it all up so that they can pinpoint where they can influence making reductions.

The big Canadian banks are busy compiling their own data for initial PCAF reports. Among them, Toronto-Dominion Bank expects to issue a report for this year’s financed emissions in 2022, Royal Bank of Canada aims to report on 2022 emissions in 2023, National Bank of Canada will set a date for publishing details next year, and Canadian Imperial Bank of Commerce plans to provide its data some time in the three years after it joined the program, which was February, 2021. Bank of Nova Scotia said it is formulating its plan, and will report on its progress publicly.

They have far larger and more varied lending and investment portfolios than Vancity does, so the math is more daunting, given the mountains of data required. The big banks have made carbon-neutrality pledges, but have resisted calls from environmental groups to decarbonize by dumping their finance activities in the energy sector. The banks say they are better off supporting Canadian businesses while using their resources to help reduce clients’ carbon emissions.

Once they file their reports on financed emissions, however, Canadians will have a much clearer picture of just how big and expensive a problem that will be to solve as the country seeks to achieve its net-zero emissions target.

Jeffrey Jones writes about sustainable finance and the ESG sector for The Globe and Mail. E-mail him at jeffjones@globeandmail.com.


'Too good to be true': Canadian oil firms could wipe out debt by 2025, start hiking dividends if prices stay high

An oil price rally this rapid has only happened three times in the last 20 years


Author of the article: Geoffrey Morgan
Publishing date :Jun 30, 2021 •
The global oil benchmark Brent traded above US$75 per barrel on Tuesday, more than double its value from the beginning of November, and some international oil executives now believe the commodity could head as high as US$100 per barrel. PHOTO BY BLOOMBERG/GETTY IMAGES


CALGARY — In the middle of one of the fastest run-up in oil prices in a decade, analysts say their financial models for Canadian oil and gas stocks almost look “too good to be true,” though there are still events that could stop the rally dead in its tracks.

The global oil benchmark Brent traded above US$75 per barrel on Tuesday, more than double its value from the beginning of November, and some international oil executives now believe the commodity could head as high as US$100 per barrel. Not far off from Brent, a barrel of West Texas Intermediate oil for August delivery was at US$73.46 per barrel.

The higher prices have also lifted Canadian oil and gas company stocks. The S&P/TSX Capped Energy is up 55 per cent year to date, compared to the 16 per cent gain during the same period for the broad S&P/TSX Composite Index. Even the U.S. S&P 500 Energy Index is lagging behind with a 41 per cent increase this year.

If Canadian oil and gas companies continue to maintain their cost discipline, analysts believe they could offer substantial returns.

In a research note entitled, “The Models Look too Good to be True,” Peters & Co. analysts write that Canadian oil and gas companies are close to hitting their debt-reduction goals and could soon start allocating billions in free cash.

“For a sector that was in real trouble a year ago, this is obviously a major change and begs the question of how each company will react in terms of allocating capital,” the analyst wrote, adding their models show “most companies” will be able to completely pay off their debts or be in net cash positions by the end of 2025.

The investment broker estimates if the current levels hold, most Canadian companies would wipe out their debt or be in net cash positions by 2025, leaving them in a position to start raising dividends and buy back shares to the tune of nearly $110 billion from 2021 to 2025.

Similarly, National Bank of Canada Financial analysts told investors to “buckle up” as they think that rising commodity prices and lower costs have created the “perfect storm for oil and gas equities.”

Large-cap Canadian oil companies are trading as if oil prices were averaging US$50 per barrel to US$55 per barrel, “which provides capital appreciation upside of approximately 60 per cent (on average) over the next 12 to 18 months.”

The bank analysts believe there is close to 100 per cent upside in Cenovus Energy Inc. shares, followed by roughly 60 per cent upside for Imperial Oil Ltd., Suncor Energy Inc. and Canadian Natural Resources Ltd.

If Canadian oil and gas companies continue to maintain their cost discipline, analysts believe they could offer substantial returns. PHOTO BY REUTERS

Oil prices have climbed nearly 50 per cent this year as key economies such as the U.S., U.K. and China have reopened, buoyed by mass vaccination campaigns. Crude stockpiles in China, the world’s biggest importer of crude, have dwindled to the lowest this year. As India emerges from a deadly coronavirus surge, an uptick in local fuel consumption has prompted the nation’s biggest refiner to boost production.

“The fundamentals are strengthening and that bodes well for pricing support,” Scotiabank senior economist Marc Desormeaux said, adding there were a few potential events that could cause an oil price correction, including nuclear talks between Iran and the U.S. that could lead to an easing of sanctions on Tehran and therefore more oil exports.

Other risks to oil prices include OPEC increasing production and the outbreak of more variant coronaviruses cases in economies that are trying to re-open as the pandemic wanes. The cartel is meeting Tuesday and Wednesday to decide whether to add more barrels to the oil market.

Global oil demand in 2021 was expected to grow by 6 million barrels per day, with 5 million bpd of that in the second half, OPEC Secretary General Mohammad Barkindo told Tuesday’s meeting of the Joint Technical Committee of OPEC+, an alliance made up of OPEC states, Russia and their allies.

“Oil prices have doubled in the last eight months and we are in fairly rare territory right now when you think about what oil prices have done so far already,” RBC Capital Markets managing director, global energy strategy Michael Tran said, adding that an oil price rally that rapid has only happened three times in the last 20 years.

Tran expects oil to average in the “high seventies” over the course of 2021 with a few short stints above that threshold. He said he’s had to revise his previously bullish oil price assumption of US$58 per barrel for 2021 multiple times as fundamentals continued to improve.

Right now, hedge funds have signed 11 long contracts on oil prices for every one short contract on crude, Trans said.

“This oil price environment is a very uncomfortable setup for oil market bears,” he said, noting that more economies are re-opening as the COVID-19 pandemic recedes in parts of the global economy and that is spurring oil demand higher at a time when energy companies have promised to hold production flat.

For oil companies, the prospect of significantly higher-than-expected commodity prices is tempting producers to drill as prices rise, though concerns about volatility remain.

“There is quite a chance to reach US$100 but we could see again in the coming years some lows as we have been accustomed to volatility,” TotalEnergies CEO Patrick Pouyanne said at the Qatar Economic Forum last week, according to Reuters.

Other Big Oil executives share his outlook.

“We’re probably going to see both US$50 and US$100 oil, don’t ask me about the sequence though,” Royal Dutch Shell Plc CEO Ben van Beurden said at the same conference.


With a file from Reuters

• Email: gmorgan@nationalpost.com | Twitter: geoffreymorgan
Carbon removal study suggests arithmetic to achieve net-zero emissions isn't so simple

Emitting a tonne has bigger impact on atmospheric CO2 than removing a tonne, modelling suggests


Emily Chung · CBC News · Posted: Jun 28, 2021 
Workers at Calgary-based Carbon Engineering's firs

Countries around the world are counting on the net-zero strategy of removing carbon to cancel out an equal amount of emissions to help them meet climate targets. But a new study by researchers in British Columbia suggests the math might not be that simple.
What does net-zero emissions mean?

Net-zero emissions or carbon neutrality means that any emissions of greenhouse gases produced are "offset" or cancelled out by the removal of emissions.

Emissions can be removed from the atmosphere through natural methods, such as planting trees and restoring wetlands, or technical approaches, such as direct-air carbon capture. (It doesn't include carbon capture at a source, such as a power plant, which simply reduces emissions.)

Removing carbon is seen as a way to deal with:

Emissions that are very hard or costly to eliminate, such as those from air travel, long-distance shipping, cement, steel and fertilizer production.

Emissions that have already been produced that are expected to cause us to overshoot climate targets before the global climate is stabilized.
Who has pledged to get to net-zero emissions?

Under the Paris Agreement on climate change, the world is to become carbon neutral between 2050 and 2100.

In fact, according to the United Nations, 131 countries have now set or are considering a target of reducing emissions to net zero by 2050, along with many companies, cities and financial institutions. They include Canada and Canadian oilsands producers.
WATCH | Canadian oil producers aim to reach net-zero emissions by 2050:


Canadian oil producers aim to reach net-zero emissions by 2050

Producers in Canada's oilsands are combining funds to reduce carbon emissions — but they're hoping for tax dollars to help fill the pot, and environmental groups are critical. 

1:50How do countries and companies calculate net zero?

"The assumption is that a tonne of carbon dioxide into the atmosphere is balanced by a tonne removed from the atmosphere," said Kirsten Zickfeld, professor of climate science at Simon Fraser University in Burnaby, B.C. and lead author of a new study published last week in the journal Nature Climate Change.

Zickfeld suspected that this might not be the case. So she and her colleagues did some climate modelling experiments that were specially designed to test that idea.
Why did researchers think removing a tonne might not cancel out emitting a tonne?

Because they know many processes in the Earth's climate system are "non-linear," Zickfeld said. For example:

As carbon dioxide increases, so does plant growth. But plants can only speed up their growth so much before it levels off, no matter how much extra CO2 is added.

The ocean can absorb some of the extra carbon dioxide emitted into the atmosphere. But as atmospheric concentrations rise, the ocean is less and less able to absorb the extra CO2.

Scientists had already seen hints that this might mean carbon emission and removal were asymmetric — that is, the amount of impact they might have for the same quantity of CO2 might be different.

Saplings are displayed on a table during an announcement on World Environment Day at the Dominion Arboretum in Ottawa in June 2019. Planting trees is another way to remove carbon from the atmosphere. (Justin Tang/The Canadian Press)

But because it wasn't something they were specifically looking for, there were a lot of factors that make it impossible to get a clear answer about that, said David Keller, a scientist at the GEOMAR Helmholtz Centre for Ocean Research in Kiel, Germany, who wasn't involved in the new study but does related research.

He said Zickfeld's study is the first designed to actually find out if carbon emission and removal of the same amount of CO2 actually cancel each other out.
How did the researchers do that?

In order to get a clear answer, the researchers used a climate model of "intermediate complexity."

Keller said it was an appropriate model for what they were looking for, keeping things simple enough to get a clear answer to the question they were asking.

WHAT ON EARTH?14 people are mapping Canada's path to net-zero emissions — can they do it?

The researchers added and removed buckets of between 100 billion (about three times the annual global emissions in 2020) and a trillion tonnes of CO2 emissions. Zickfeld said that's about the range of emissions that we're expected to need to remove to meet the lower Paris target of a temperature that's 1.5 C warmer than pre-industrial times.

They then looked at the climate impact in the following 1,000 years.
What did they find?

The study showed that if you remove and emit the same amount of CO2, you end up with a higher atmospheric CO2 concentration than if you had emitted no CO2. That is, the result is not net zero.

"And that asymmetry increases the more we emit and we remove," Zickfeld said.

Nor does it change with time — the difference still exists 1,000 years later.

A man wades into the ocean at sunset in Newport Beach, Calif, on June 22. The study found that a tonne of carbon removed from the atmosphere and a tonne of carbon emitted don't add up to zero. That's because natural processes, such as the ocean's ability to absorb carbon, change as more carbon is added. (Jae C. Hong/The Associated Press)

Why?


Zickfeld said the two "non-linear" processes mentioned before — the change in plant growth and ocean absorption with rising CO2 — were the main culprits.

The researchers found that the change in temperature associated with addition and removal of the same amount of CO2 was also not the same as if the CO2 was never emitted, but the difference was smaller.

CBC EXPLAINSCarbon capture: What you need to know about catching CO2 to fight climate change

Zickfeld said the researchers also couldn't be sure which case had the higher temperature. In this experiment, it looked like the case with no emissions, but the preliminary results of other experiments show the opposite.

"This is a first step," Zickfeld said. She added that more study is needed to work out the details, such as exactly what amount of removal would be needed to offset a given amount of emissions.
What does this mean for net-zero commitments and calculations?

Zickfeld said we need to be more cautious when we think about offsetting emissions with carbon dioxide removal, as the Earth is complex and there are many geophysical systems that we don't take into account.

"The risk is that we end up with a climate that is not stable, and then potentially we risk blowing the temperature targets if we do not take these effects into account," she said. "My take really is that because of all these uncertainties in the system, I think the focus should really be on reducing carbon dioxide emissions."

Keller said Zickfeld's study is important because of what it shows for the first time, but more work needs to be done on the topic. In fact, he's currently running similar experiments with different models.

OPINION

Canada's oilsands producers form alliance to achieve net-zero emissions by 2050

While this particular study might not be relevant to policy-makers, Keller said they should become aware that carbon removal is not the exact opposite of adding CO2 to the atmosphere.

Holly Buck, an assistant professor of environment and sustainability at the State University of New York at Buffalo, said the findings are relevant to the discussion about how to implement policies to reach net-zero goals.

She foresees research such as this allowing for a mathematical correction in the future to match a certain amount of emissions with a certain amount of removals to ensure they cancel out.

"This is a first step that should be putting this on policy-makers' radar," Buck said.

ABOUT THE AUTHOR


Emily Chung

Science and Technology Writer

Emily Chung covers science and technology for CBC News. She has previously worked as a digital journalist for CBC Ottawa and as an occasional producer at CBC's Quirks & Quarks. She has a PhD in chemistry.


Arctic’s ‘Last Ice Area’ shows earlier-than-expected melt

By Seth Borenstein
The Associated Press
Thu., July 1, 202

Part of the Arctic is nicknamed the “Last Ice Area,” because floating sea ice there is usually so thick that it’s likely to withstand global warming for decades. So, scientists were shocked last summer when there was suddenly enough open water for a ship to pass through.

The opening, documented by scientists aboard a German icebreaker, popped up in late July and August in the Wandel Sea north of Greenland. Mostly it was due to a freak weather event, but thinning sea ice from decades of climate change was a significant factor, according to a study Thursday in the journal Communications Earth and Environment.

While scientists have said most of the Arctic could be free of summer sea ice by mid-century, the Last Ice Area was not part of that equation. They figure the 380,000-square-mile (1-million-square-kilometer) area won’t be ice-free in the summer until around 2100, said study co-author Kent Moore, a University of Toronto atmospheric physicist.

“It’s called the Last Ice Area for a reason. We thought it was kind of stable,” said co-author Mike Steele, a University of Washington oceanographer. “It’s just pretty shocking. ... In 2020, this area melted out like crazy.”

Scientists believe the area — north of Greenland and Canada — could become the last refuge for animals like polar bears that depend on ice, said Kristin Laidre, a co-author and biologist at the University of Washington.

The main cause for the sudden ice loss was extraordinary strong winds that pushed the ice out the region and down the coast of Greenland, Moore said.

That had happened in smaller, infrequent episodes, but this time was different, Moore said. The researchers used computer simulations and 40 years of Arctic sea data to calculate that “there was a significant climate change signal“ — about 20%, they estimate — in the event, Moore said.


In the past, thicker Wandel Sea ice would have resisted the strong winds, but in 2020 it was thinner and “more easily broken up and pushed out,” said National Snow and Ice Data Center scientist Walt Meier, who wasn’t part of the study.


Another part of the Last Ice Area, off Canada’s Ellesmere Island, had open waters after the July 2020 collapse of part of the Milne ice shelf, but scientists are still studying it to determine if there is a climate change connection, Moore said.