Monday, October 18, 2021

New Nutrient Profiling System: Ranking Healthfulness of Foods From First to Worst

Food Compass Scores

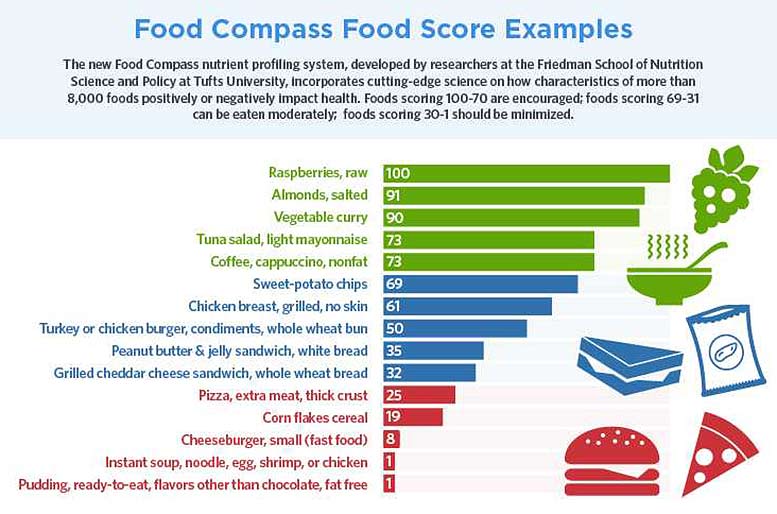
The Food Compass nutrient profiling system, developed by researchers at the Friedman School at Tufts, incorporates cutting-edge science on how characteristics of more than 8,000 foods positively or negatively impact health. Credit: Tufts University

New nutrient profiling system, most comprehensive and science-based to date, clears up confusion to benefit consumers, policymakers.

A scientific team at the Friedman School of Nutrition Science and Policy at Tufts has developed a new tool to help consumers, food companies, restaurants, and cafeterias choose and produce healthier foods and officials to make sound public nutrition policy.

Food Compass is a new nutrient profiling system, developed over three years, that incorporates cutting-edge science on how different characteristics of foods positively or negatively impact health. Important novel features of the system, reported on October 14, 2021, in Nature Food, include:

  • Equally considering healthful vs. harmful factors in foods (many existing systems focus on harmful factors);
  • Incorporating cutting-edge science on nutrients, food ingredients, processing characteristics, phytochemicals, and additives (existing systems focus largely on just a few nutrients); and
  • Objectively scoring all foods, beverages, and even mixed dishes and meals using one consistent score (existing systems subjectively group and score foods differently).

“Once you get beyond ‘eat your veggies, avoid soda,’ the public is pretty confused about how to identify healthier choices in the grocery store, cafeteria, and restaurant,” said the study’s lead and corresponding author, Dariush Mozaffarian, dean of the Friedman School. “Consumers, policy makers, and even industry are looking for simple tools to guide everyone toward healthier choices.”

The new Food Compass system was developed and then tested using a detailed national database of 8,032 foods and beverages consumed by Americans. It scores 54 different characteristics across nine domains representing different health-relevant aspects of foods, drinks, and mixed meals, providing for one of the most comprehensive nutrient profiling systems in the world. The characteristics and domains were selected based on nutritional attributes linked to major chronic diseases such as obesity, diabetes, cardiovascular problems, and cancer, as well as to risk of undernutrition, especially for mothers, young children, and the elderly.

Food Compass was designed so that additional attributes and scoring could evolve based on future evidence in such areas as gastrointestinal health, immune function, brain health, bone health, and physical and mental performance; as well as considerations of sustainability.

Potential uses of Food Compass include:

  • Encouraging the food industry to develop healthier foods and reformulate the ingredients in popular processed foods and snacks;
  • Providing food purchasing incentives for employees through worksite wellness, health care, and nutrition assistance programs;
  • Supplying the science for local and national policies such as package labeling, taxation, warning labels, and restrictions on marketing to children;
  • Enabling restaurants and school, business, and hospital cafeterias to present healthier food options;
  • Informing agricultural trade policy; and
  • Guiding institutional and individual investors on environmental, social, and corporate governance (ESG) investment decisions.

Each food, beverage, or mixed dish receives a final Food Compass score ranging from 1 (least healthy) to 100 (most healthy). The researchers identified 70 or more as a reasonable score for foods or beverages that should be encouraged. Foods and beverages scoring 31-69 should be consumed in moderation. Anything scoring 30 or lower should be consumed minimally.

Across major food categories, the average Food Compass score was 43.2.

  • The lowest scoring category was snacks and sweet desserts (average score 16.4).
  • The highest scoring categories were vegetables (average score 69.1), fruits (average score 73.9, with nearly all raw fruits receiving a score of 100), and legumes, nuts, and seeds (average score 78.6).
  • Among beverages, the average score ranged from 27.6 for sugar-sweetened sodas and energy drinks to 67 for 100% fruit or vegetable juices.
  • Starchy vegetables scored an average of 43.2.
  • The average score for beef was 24.9; for poultry, 42.67; and for seafood, 67.0.

Food Compass is the first major nutrient profiling system to use consistent scoring across diverse food groups, which is especially important for mixed dishes. For example, in the case of pizza, many other systems have separate scoring algorithms for the wheat, meat, and cheese, but not the finished product itself. Consistent scoring of diverse items can also be helpful in assessing and comparing combinations of food and beverages that could be sold and consumed together, such as an entire shopping basket, a person’s daily diet pattern, or a portfolio of foods sold by a particular company.

“With its publicly available scoring algorithm, Food Compass can provide a nuanced approach to promoting healthy food choices–helping guide consumer behavior, nutrition policy, scientific research, food industry practices, and socially based investment decisions,” said last author Renata Micha, who did this work as a faculty member at the Friedman School and is now at the University of Thessaly.

Additional authors are Naglaa H. El-Abbadi, Meghan O’Hearn, Josh Marino, William A. Masters, Paul Jacques, Peilin Shi, and Jeffrey B. Blumberg of the Friedman School.

The study is part of the Food-PRICE (Policy Review and Intervention Cost-Effectiveness) project, a National Institutes of Health-funded research collaboration working to identify cost-effective nutrition strategies that can have the greatest impact on improving health outcomes in the United States. This work was supported by Danone and the National Heart, Lung, and Blood Institute of the National Institutes of Health under award numbers R01HL130735 and R01HL115189. The content is solely the responsibility of the authors and does not necessarily represent the official views of the National Institutes of Health. Please see the study for conflicts of interest.

Reference: “Food Compass is a nutrient profiling system using expanded characteristics for assessing healthfulness of foods” by Dariush Mozaffarian, Naglaa H. El-Abbadi, Meghan O’Hearn, Josh Erndt-Marino, William A. Masters, Paul Jacques, Peilin Shi, Jeffrey B. Blumberg and Renata Micha, 14 October 2021, Nature Food.
DOI: 10.1038/s43016-021-00381-y

A Sunny Outlook for Solar: New Research Demonstrates Great Promise for Improving Solar Cell Efficiency

All-Inorganic Perovskites Efficiency Compared

All-inorganic perovskites compare well with their hybrid counterparts in terms of efficiency. Credit: Illustration by Xie Zhang

New research demonstrates great promise of all-inorganic perovskite solar cells for improving the efficiencies of solar cells.

Hybrid organic-inorganic perovskites have already demonstrated very high photovoltaic efficiencies of greater than 25%. The prevailing wisdom in the field is that the organic (carbon- and hydrogen-containing) molecules in the material are crucial to achieving this impressive performance because they are believed to suppress defect-assisted carrier recombination.

New research in the UC Santa Barbara materials department has shown not only that this assumption is incorrect, but also that all-inorganic materials have the potential for outperforming hybrid perovskites. The findings are published in the article “All-inorganic halide perovskites as candidates for efficient solar cells,” which appears on the cover of the October 20, 2021, issue of the journal Cell Reports Physical Science.

“To compare the materials, we performed comprehensive simulations of the recombination mechanisms,” explained Xie Zhang, lead researcher on the study. “When light shines on a solar-cell material, the photo-generated carriers generate a current; recombination at defects destroys some of those carriers and hence lowers the efficiency. Defects thus act as efficiency killers.”

To compare inorganic and hybrid perovskites, the researchers studied two prototype materials. Both materials contain lead and iodine atoms, but in one material the crystal structure is completed by the inorganic element cesium, while in the other, the organic methylammonium molecule is present.

Sorting out these processes experimentally is exceedingly difficult, but state-of-the-art quantum-mechanical calculations can accurately predict the recombination rates, thanks to new methodology that was developed in the group of UCSB materials professor Chris Van de Walle, who credited Mark Turiansky, a senior graduate student in the group, with helping to write the code to calculate the recombination rates.

“Our methods are very powerful for determining which defects cause carrier loss,” Turiansky said. “It is exciting to see the approach applied to one of the critical issues of our time, namely the efficient generation of renewable energy.”

Running the simulations showed that defects common to both materials give rise to comparable (and relatively benign) levels of recombination. However, the organic molecule in the hybrid perovskite can break up; when loss of hydrogen atoms occurs, the resulting “vacancies” strongly decrease efficiency. The presence of the molecule is thus a detriment, rather than an asset, to the overall efficiency of the material.

Why, then, has this not been noticed experimentally? Mainly because it is more difficult to grow high-quality layers of the all-inorganic materials. They have a tendency to adopt other crystal structures, and promoting the formation of the desired structure requires greater experimental effort. Recent research has shown, however, that achieving the preferred structure is definitely feasible. Still, the difficulty explains why the all-inorganic perovskites have not received as much attention to date.

“We hope that our findings about the expected efficiency will stimulate more activities directed at producing inorganic perovskites,” concluded Van de Walle.

Reference: “All-inorganic halide perovskites as candidates for efficient solar cells” by Xie Zhang, Mark E. Turiansky and Chris G. Van de Walle, 11 October 2021, Cell Reports Physical Science.
DOI: 10.1016/j.xcrp.2021.100604

Funding for this research was provided by the Department of Energy Office of Science, Office of Basic Energy Sciences; the computations were performed at the National Energy Research Scientific Computing Center.


Auroras Announce the Solar Cycle: More Frequent Opportunities To See the Northern and Southern Lights

Aurora Borealis October 2021 Annotated

October 12, 2021

The 25th cycle is underway, and it brings more frequent opportunities to see the northern lights and southern lights.

Solar Cycle 25 is underway, and that means more frequent opportunities to see auroras—more commonly known as the northern lights and southern lights. One of the best opportunities in recent years occurred on October 11-12, 2021.

In the early morning hours of October 12, 2021, the Visible Infrared Imaging Radiometer Suite (VIIRS) on the NOAA-NASA Suomi NPP satellite acquired images of the aurora borealis, or northern lights, around the Northern Hemisphere. The scene above is a mosaic of several satellite passes showing auroras over eastern North America, the North Atlantic, and Greenland. (Click on the downloadable image to see a wider view stretching to Alaska.) The nighttime satellite image was acquired with VIIRS “day-night band,” which detects light in a range of wavelengths from green to near-infrared and uses filtering techniques to observe signals such as airglow, auroras, city lights, and reflected moonlight.

That same night, astronaut Shane Kimbrough photographed the aurora (image below) from his perch on the International Space Station. The night brought the first sustained, widespread glance at the northern lights for mid-latitude viewers in several years. Many photographers and aurora chasers captured photos that night, some of which were shared with the Aurorasaurus citizen science project.

Aurora October 2021

October 12, 2021

Solar cycles track the activity level of the Sun, our nearest star. A cycle is traditionally measured by the rise and fall in the number of sunspots, but it also coincides with increases in solar flarescoronal mass ejections (CMEs), radio emissions, and other forms of space weather. These bursts of magnetized plasma and energetic waves from the Sun’s atmosphere energize the gases and particles in Earth’s magnetosphere and send them plunging down in colorful light displays in the upper atmosphere. Scientists have forecasted the next peak of solar activity (solar maximum) will be reached in mid-2025.

According to the NOAA Space Weather Prediction Center, the Sun erupted with a solar flare and CME on October 9, 2021, and the storm arrived at Earth late on October 11. Geomagnetic storm activity reached G2 on a scale from G1 to G5. It was likely the first head-on CME impact of the new solar cycle. NASA’s Solar Terrestrial Relations Observatory (STEREO-A) and the Solar Dynamics Observatory captured images of the flare and CME.

You can participate in aurora citizen science through Aurorasaurus. The project team tracks auroras around the world via reports to its website and on Twitter, then generates a real-time global map of those reports. Citizen scientists log in and verify the tweets and reports, and each verified sighting serves as a valuable data point for scientists to analyze and incorporate into space weather models. The Aurorasaurus team, in collaboration with citizen scientists and the scientific community, published the first scientific study of Strong Thermal Emission Velocity Enhancement (STEVE), an aurora-like phenomenon that appears closer to the equator and flows from east to west. The project is a public-private partnership with the New Mexico Consortium supported by the National Science Foundation and NASA.

Astronaut photograph acquired on October 12, 2021, with a Nikon D5 digital camera. The photograph was provided by the ISS Crew Earth Observations Facility and the Earth Science and Remote Sensing Unit, Johnson Space Center. NASA Earth Observatory image by Joshua Stevens, using VIIRS day-night band data from the Suomi National Polar-orbiting Partnership.

Seismology and Geophysics: Understanding the Devastating Haiti Earthquakes

Haiti Earthquake Damage

Haiti earthquake damage.

Assistant professors Camilla Cattania and William Frank discuss the science behind the 2010 and 2021 earthquakes in Haiti.

On August 14, 2021, a magnitude 7.2 earthquake struck Haiti. The largest earthquake in the region since 2010, the disaster left at least 2,000 people dead, 12,000 people injured, and nearly 53,000 houses destroyed. Two assistant professors in the MIT Department of Earth, Atmospheric and Planetary Sciences discuss why the region is susceptible to earthquakes and what has changed — in Haiti and in earthquake science — since the devastating 2010 event, when the country had only one seismometer.

Camilla Cattania is a seismologist with experience in numerical modeling, earthquake physics, and statistical seismology; and William Frank is a geophysicist focused the physical mechanisms that control deformation within the Earths crust.

Camilla Cattania and William Frank

Camilla Cattania (left) and William Frank are assistant professors in the Department of Earth, Atmospheric and Planetary Sciences focused on earthquake science. Credit: Photos courtesy of the faculty

Q: Why is Haiti prone to earthquakes?

Cattania: I’ll start with the broad tectonics setting. The island of Hispaniola, which comprises Haiti and the Dominican Republic, is sandwiched between the North American plate to the north and the Caribbean plate to the south. Haiti is primarily on a tiny plate that’s sandwiched between the two. At each plate boundary it has faults, fractures within the Earth’s crust, running approximately east to west. The earthquake happened in the southern-most fault system, called the Enriquillo-Plantain Garden fault system, where there are faults with slightly different orientations, creating complex fault geometry. The northern plate is moving to the west while the southern plate is moving to the east, causing earthquakes along this fault zone.

Frank: Not only do you have the sliding motion from east to west, but you also have compressive, or squeezing, motion at the plate boundary that is accommodated by other nearby faults. For example, one of the big questions for the 2010 earthquake is: What fault did it actually occur on? It looked like it was right next Enriquillo-Plantain Garden fault system, but was it was on a translational, or sliding, fault or a compressive fault? There are lots of outstanding questions about the complexity of what, from far away, looks simple.

Cattania: The region transitions between horizontal motion, in which plates slide past each other, to the compressive motion William described, which has some vertical motion. Even in this earthquake, preliminary models show that there was a bit of both.

Another question would be: Why now? Why have there been two earthquakes recently? The Enriquillo-Plantain Garden fault system has been associated with earthquakes in 1751, 1770, 1860, without much in between. A long period of time without seismicity can increase the likelihood that you will have an earthquake because you have had more time to accumulate stresses. Moreover, the 2010 earthquake, which happened on a subsidiary fault, further increased the stress at the location of the 2021 earthquake.

Gonâve Microplate and Surrounding Fault Zones

The Gonâve microplate and surrounding fault zones. Credit: NASA WorldWind (retouched by mikenorton)

Q: What is the same and what is different about this earthquake versus the 2010 earthquake?

Frank: The 2010 earthquake happened on a fault that wasn’t previously identified, one of the faults that accommodates the compressive motion of the plate boundary. The question we have now is whether this recent earthquake is on the main translational fault, or whether it’s also on another fault that accommodates compressive motion. If that were the case, it would be the same plate boundary, but a different faulting regime.

Cattania: The reason there are so many unknowns is because this region was very sparsely instrumented up until 2010, when Haiti had no permanent seismic network. Now the region has more seismometers, and people also have portable, low-quality seismometers in their homes that provide a large quantity of measurements. The quality of the data that we have from this earthquake is superior compared to anything we would have had in 2010 or before. I think we’ll have more answers in the future to some of these questions than we did before because the instrumentation has improved between these two events.

Frank: Increased instrumentation allows us to get a better image of what’s happening in the fault zone during the main earthquake and the aftershocks that follow. The parallel story on why that’s possible is that during the 2010 earthquake, there was no seismology at the State University of Haiti. Now, there’s a geoscience department that’s recruiting and training seismologists.

There’s an informational website that is the result of an exciting collaboration between geoscience researchers in Haiti and the University of Nice in France, where they publish real-time locations and detections of aftershocks. It provides enormous amounts of data that is publicly available. Overall, there’s much more activity within Haiti, of instrumentation, of general interest in earthquake hazard, and of people to study the data, than there was during the 2010 earthquake.

Cattania: Another difference between these events was their magnitude. The first one was 7; this latest was 7.2. But the location was also different — the first was closer to Port-au-Prince and generally more populated areas. The fact that this one is stronger doesn’t necessarily imply that it’s more damaging.

Q: What does your research tell us about future earthquakes in this area? What do we know as a scientific community?

Cattania: We cannot predict with certainty the location or the magnitude of huge earthquakes in this area, or anywhere else; however, we do know the typical properties of aftershocks. Basically, you will feel hundreds of earthquakes in the first few weeks, and then this number gradually goes down unless one of these earthquakes happens to be large enough to start a new sequence.

How does the earthquake affect the fault system? We had an earthquake in 2010 that happened to the east of the current earthquake, and it increased the amount of stress where the 2021 earthquake happened. If you look at a map of this area, it’s clear that there are other segments of this same fault system on which major earthquakes haven’t happened for a long time. There is a possibility of other damaging earthquakes occurring on the same fault system.

Frank: For me, what’s most related to my research is developing efficient ways to detect, identify, and characterize the aftershocks. We’ve developed signal processing techniques that we can use on the seismic data to identify the earthquakes, and once we’re able to identify them, we’re able to get good locations. We’re able to study the occurrence rate of these aftershocks.

These aftershock catalogs are extremely important to understanding the extent of rupture and to identifying the actual faults and planes that they occur on. There are two simple ways to identify the structure. You can look at the main earthquake itself, or at the rupture zone of the main earthquake, where the aftershocks often delineate where the main earthquake happened. And once you can identify, locate, and characterize those aftershocks, you can better model the earthquake.

Cattania: My work has been about including geometrical complexity in aftershock forecasts. When you’re trying to figure out where aftershocks will happen, you need to know as much as possible about the orientation of existing faults, and sometimes you have to make simplified assumptions about it. I’ve developed methods that help better include everything we know, using data and the type of information that William was describing, to try to infer how an aftershock will evolve given what the fault geometry looks like and how variable it is in this region. My methods allow you to take refined information about fault geometry to produce better aftershock forecasts.

Frank: That’s why I’m excited to be here with Camilla — because we can make that direct connection.


Primates’ Ancestors May Have Left Trees To Survive Asteroid That Wiped Out the Dinosaurs

Chimpanzee Out of Trees

A chimpanzee in Kibale National Park, Uganda. Credit: Daniel J. Field

When an asteroid struck 66 million years ago and wiped out dinosaurs not related to birds and three-quarters of life on Earth, early ancestors of primates and marsupials were among the only tree-dwelling (arboreal) mammals that survived, according to a new study.

Arboreal species were especially at risk of extinction due to global deforestation caused by wildfires from the asteroid’s impact.

In the study, computer models, fossil records, and information from living mammals revealed that most of the surviving mammals did not rely on trees, though the few arboreal mammals that lived on – including human ancestors – may have been versatile enough to adapt to the loss of trees.

The study points to the influence of this extinction event, known as the Cretaceous-Paleogene (K-Pg) boundary, on shaping the early evolution and diversification of mammals.

 “One possible explanation for how primates survived across the K-Pg boundary, in spite of being arboreal, might be due to some behavioral flexibility, which may have been a critical factor that let them survive,” said Jonathan Hughes, the paper’s co-first author and a doctoral student in the lab of Jeremy Searle, professor of ecology and evolutionary biology in the College of Agriculture and Life Sciences. Co-first author Jacob Berv, Ph.D. ’19, is currently a Life Sciences Fellow at the University of Michigan.

The study, “Ecological Selectivity and the Evolution of Mammalian Substrate Preference Across the K-Pg Boundary,” was published on October 11, 2021, in the journal Ecology and Evolution.

The earliest mammals appeared roughly 300 million years ago and may have diversified in tandem with an expansion of flowering plants about 20 million years prior to the K-Pg event. When the asteroid struck, many of these mammal lineages died off, Hughes said.

“At the same time, the mammals that did survive diversified into all the new ecological niches that opened up when dinosaurs and other species became extinct,” Hughes said.

In the study, the researchers used published phylogenies (branching, tree-like diagrams that show evolutionary relatedness among groups of organisms) for mammals. They then classified each living mammal on those phylogenies into three categories – arboreal, semi-arboreal and non-arboreal – based on their preferred habitats. They also designed computer models that reconstructed the evolutionary history of mammals.

Mammal fossils from around the K-Pg are very rare and are difficult to use to interpret an animal’s habitat preference. The researchers compared information known from living mammals against available fossils to help provide additional context for their results.

Generally, the models showed that surviving species were predominantly non-arboreal through the K-Pg event, with two possible exceptions: ancestors of primates and marsupials. Primate ancestors and their closest relatives were found to be arboreal right before the K-Pg event in every model. Marsupial ancestors were found to be arboreal in half of the model reconstructions.

The researchers also examined how mammals as a group may have been changing over time.

“We were able to see that leading up to the K-Pg event, around that time frame, there was a big spike in transitions from arboreal and semi-arboreal to non-arboreal, so it’s not just that we are seeing mostly non-arboreal [species], but things were rapidly transitioning away from arboreality,” Hughes said.

Reference: “Ecological selectivity and the evolution of mammalian substrate preference across the K–Pg boundary” by Jonathan J. Hughes, Jacob S. Berv, Stephen G. B. Chester, Eric J. Sargis and Daniel J. Field, 11 October 2021, Ecology and Evolution.
DOI: 10.1002/ece3.8114

Co-authors include Daniel Field, a vertebrate paleontologist at the University of Cambridge; Eric Sargis, a professor of anthropology at Yale University; and Stephen Chester, an associate professor of anthropology at Brooklyn College.

The study was funded by the National Science Foundation.

 Carbon Capture: A green way forward? | Plan It Green

Oct 17, 2021

Al Jazeera English

With fossil fuel emissions still rising, we need innovative answers to how we can slow global warming, and fast. Carbon capture and storage is one such idea. But as our Environment Correspondent Nick Clark finds out, there are fears it could divert attention from other sustainable solutions.


Eurasian consolidation ends the US unipolar moment

Shanghai Cooperation Organization's 20th-anniversary summit heralded the beginning of a new geopolitical and geo-economic order


Participant leaders pose for a photo ahead of Shanghai Cooperation Organization (SCO) Summit in Dushanbe, Tajikistan, on September 17. 
Photo: AFP / Iranian Presidency / Handout / Anadolu Agency

ASIATIMES.COM
SEPTEMBER 22, 2021

The 20th-anniversary summit of the Shanghai Cooperation Organization (SCO) in Dushanbe, Tajikistan, enshrined nothing less than a new geopolitical paradigm.

Iran, now a full SCO member, was restored to its traditionally prominent Eurasian role, following the recent US$400 billion trade and development deal struck with China. Afghanistan was the main topic – with all players agreeing on the path ahead, as detailed in the Dushanbe Declaration. And all Eurasian integration paths are now converging, in unison, towards the new geopolitical – and geoeconomic – paradigm.

Call it a multipolar development dynamic in synergy with China’s Belt and Road Initiative.

The Dushanbe Declaration was quite explicit on what Eurasian players are aiming at: “a more representative, democratic, just and multipolar world order based on universally recognized principles of international law, cultural and civilizational diversity, mutually beneficial and equal cooperation of states under the central coordinating role of the UN.”

For all the immense challenges inherent to the Afghan jigsaw puzzle, hopeful signs emerged on Tuesday (September 21), when former Afghan president Hamid Karzai and peace envoy Abdullah Abdullah met in Kabul with Russian presidential envoy Zamir Kabulov, China’s special envoy Yue Xiaoyong and Pakistan’s special envoy Mohammad Sadiq Khan.

This troika – Russia, China, Pakistan – is at the diplomatic forefront. The SCO reached a consensus that Islamabad will coordinate with the Taliban on the formation of an inclusive government that including Tajiks, Uzbeks and Hazaras.

The most glaring, immediate consequence of the SCO’s not only incorporating Iran but also taking the Afghan bull by the horns, fully supported by the Central Asian “stans,” is that the Empire of Chaos has been completely marginalized.

Russian President Vladimir Putin attends a meeting of the Council of Heads of State of the Shanghai Cooperation Organisation (SCO) held in Dushanbe, via videoconference, at the Novo-Ogaryovo state residence, outside Moscow, Russia.
 Photo: AFP / Alexei Druzhinin / Sputnik

From Southwest Asia to Central Asia, a real reset has as its protagonists the SCO, the Eurasia Economic Union, the BRI and the Russia-China strategic partnership. Iran and Afghanistan – the missing links heretofore, for different reasons – are now fully incorporated into the chessboard.

In one of my frequent conversations with Alastair Crooke, a prominent political analyst, he evoked once again Giuseppe Tomasi di Lampedusa’s The Leopard: everything must change so everything must remain the same.

In this case, imperial hegemony, as interpreted by Washington: “In its growing confrontation with China, a ruthless Washington has demonstrated that what matters to it now is not Europe but the Indo-Pacific region.” That’s Cold War 2.0 prime terrain.

The fallback position for the US – which possesses little potential to contain China after having been all but expelled from the Eurasia heartland – had to be a classic maritime power play: the “free and open Indo-Pacific,” complete with Quad and AUKUS, the whole setup spun to death as an “effort” attempting to preserve dwindling American supremacy.

The sharp contrast between the SCO continental integration drive and the “we all live in an Aussie submarine” gambit (my excuses to Lennon-McCartney) speaks for itself. A toxic mix of hubris and desperation is in the air, with not even a whiff of pathos to alleviate the downfall.

Iranian President Ebrahim Raisi attends the Shanghai Cooperation Organization (SCO) Summit in Dushanbe, Tajikistan, on September 17, 2021.
 Photo: AFP / Iranian Presidency / Handout / Anadolu Agency

The Global South is not impressed. Addressing the forum in Dushanbe, Russian President Vladimir Putin remarked that the portfolio of nations knocking on the SCO’s door was huge.

Egypt, Qatar and Saudi Arabia are now SCO dialogue partners, on the same level with Afghanistan and Turkey. It’s quite feasible they may be joined next year by Lebanon, Syria, Iraq, Serbia and dozens of others.

And it doesn’t stop in Eurasia. In his well-timed address to CELAC, Chinese President Xi Jinping invited no fewer than 33 Latin American nations to be part of the Eurasia-Africa-Americas New Silk Roads.

Remember the Scythians


Iran as a SCO protagonist and at the center of the New Silk Roads has been restored to a rightful historic role. By the middle of the first millennium BCE, northern Iranians ruled the core of the steppes in Central Eurasia. By that time the Scythians had migrated into the western steppe, while other steppe Iranians made inroads as far away as China.

Scythians – a northern (or “east”) Iranian people – were not necessarily just fierce warriors. That’s a crude stereotype. Very few in the West know that the Scythians developed a sophisticated trade system, as described by Herodotus among others, that linked Greece, Persia and China.

And why’s that? Because trade was an essential means to support their sociopolitical infrastructure. Herodotus got the picture because he actually visited the city of Olbia and other places in Scythia.

The Scythians were called Saka by the Persians – and that leads us to another fascinating territory: the Sakas may have been one of the prime ancestors of the Pashtun in Afghanistan.

What’s in a name – Scythian? Well, multitudes. The Greek form Scytha meant northern Iranian “archer.” So that was the denomination of all the northern Iranian peoples living between Greece in the West and China in the East.

Map of Scythia: Wikipedia

Now imagine a very busy international commerce network developed across the heartland, with the focus on Central Eurasia, by the Scythians, the Sogdians, and even the Xiongnu – who kept battling the Chinese on and off, as detailed by early Greek and Chinese historical sources.

These Central Eurasians traded with all the peoples living on their borders: that meant Europeans, Southwest Asians, South Asians and East Asians. They were the precursors of the multiple ancient Silk Roads.

The Sogdians followed the Scythians; Sogdiana was an independent Greco-Bactrian state in the 3rd century B.C. – encompassing areas of northern Afghanistan – before it was conquered by nomads from the east who ended up establishing the Kushan empire, which soon expanded south into India.

Zoroaster was born in Sogdiana; Zoroastrianism was huge in Central Asia for centuries. The Kushans for their part adopted Buddhism: and that’s how Buddhism eventually arrived in China.

By the first century CE, all these Central Asian empires were linked – via long-distance trade – to Iran, India and China. That was the historical basis of the multiple, ancient Silk Roads – which linked China to the West for several centuries until the Age of Discovery configured the fateful Western maritime trade dominance.

Arguably, even more than a series of interlinked historical phenomena, the denomination “Silk Road” works best as a metaphor of cross-cultural connectivity. That’s what is at the heart of the Chinese concept of New Silk Roads. And average people across the heartland feel it because that’s imprinted in the collective unconscious in Iran, China and all Central Asian “stans.”

Revenge of the heartland

Glenn Diesen, professor at the University of South-Eastern Norway and an editor at the Russia in Global Affairs journal, is among the very few top scholars who are analyzing the process of Eurasia integration in depth.

His latest book practically spells out the whole story in its title: Europe as the Western Peninsula of Greater Eurasia: Geoeconomic Regions in a Multipolar World.

Diesen shows, in detail, how a “Greater Eurasia region, that integrates Asia and Europe, is currently being negotiated and organized with a Chinese-Russian partnership at the center. Eurasian geoeconomic instruments of power are gradually forming the foundation of a super-region with new strategic industries, transportation corridors and financial instruments. Across the Eurasian continent, states as different as South Korea, India, Kazakhstan and Iran are all advancing various formats for Eurasia integration.”

The Greater Eurasia Partnership has been at the center of Russian foreign policy at least since the St Petersburg forum in 2016. Diesen duly notes that, “while Beijing and Moscow share the ambition to construct a larger Eurasian region, their formats differ. The common denominator of both formats is the necessity of a Sino-Russian partnership to integrate Eurasia.” That’s what was made very clear at the SCO summit.

It’s no wonder the process irks the Empire immensely, because Greater Eurasia, led by Russia-China, is a mortal attack against the geoeconomic architecture of Atlanticism. And that leads us to the nest-of-vipers debate around the EU concept of “strategic autonomy” from the US; that would be essential to establish true European sovereignty – and eventually, closer integration within Eurasia.

Glenn Diesen. Photo: we.hse.ru

European sovereignty is simply non-existent when its foreign policy means submission to dominatrix NATO. The humiliating, unilateral withdrawal from Afghanistan coupled with the Anglo-only AUKUS was a graphic illustration that the Empire doesn’t give a damn about its European vassals.

Throughout the book, Diesen shows, in detail, how the concept of Eurasia unifying Europe and Asia “has through history been an alternative to the dominance of maritime powers in the oceanic-centric world economy,” and how “British and American strategies have been deeply influenced” by the ghost of an emerging Eurasia, “a direct threat to their advantageous position in the oceanic world order.”

Now, the crucial factor seems to be the fragmentation of Atlanticism. Diesen identifies three levels: the de facto decoupling of Europe and the US propelled by Chinese ascendancy; the mind-boggling internal divisions in the EU, enhanced by the parallel universe inhabited by Brussels eurocrats; and last but not least, “polarization within Western states” caused by the excesses of neoliberalism.

Well, just as we think we’re out, Mackinder and Spykman pull us back in. It’s always the same story: the Anglo-American obsession in preventing the rise of a “peer competitor” (Brzezinski) in Eurasia, or an alliance (Russia-Germany in the Mackinder era, now the Russia-China strategic partnership) capable, as Diesen puts it, “of wrestling geoeconomic control away from the oceanic powers.”

As much as imperial strategists remain hostages of Spykman – who ruled that the US must control the maritime periphery of Eurasia – definitely it’s not AUKUS/Quad that is going to pull it off.

Very few people, East and West, may remember that Washington had developed its own Silk Road concept during the Bill Clinton years – later co-opted by Dick Cheney with a Pipelineistan twist and then circling all back to Hillary Clinton who announced her own Silk Road dream in India in 2011.

Diesen reminds us how Hillary sounded remarkably like a proto-Xi: “Let’s work together to create a new Silk Road. Not a single thoroughfare like its namesake, but an international web and network of economic and transit connections. That means building more rail lines, highways, energy infrastructure, like the proposed pipeline to run from Turkmenistan, through Afghanistan, through Pakistan and India.”

Hillary does Pipelineistan! Well, in the end, she didn’t. Reality dictates that Russia is connecting its European and Pacific regions, while China connects its developed east coast with Xinjiang, and both connect Central Asia. Diesen interprets it as Russia “completing its historical conversion from a European/Slavic empire to a Eurasian civilizational state.”

So in the end we’re back to … the Scythians. The prevailing neo-Eurasia concept revives the mobility of nomadic civilizations – via top transportation infrastructure – to connect everything between Europe and Asia.

We could call it the Revenge of the Heartland: they are the powers building this new, interconnected Eurasia. Say goodbye to the ephemeral, post-Cold War US unipolar moment.
Time for China’s Belt and Road to go green

Beijing's recent vow to stop funding coal-fired power projects abroad could fuel a new era of low-carbon development
SEPTEMBER 29, 2021
ASIATIMES.COM

Emissions are discharged from a coal-fired power plant in Changchun city in northeast China's Jilin province. 
Photo: AFP / Wang zhendong / Imaginechina

Chinese President Xi Jinping recently announced at the UN General Assembly that China “will not build new coal-fired power projects abroad.”

Chinese banks have already swung into gear. Three days after Xi’s speech, the Bank of China declared it would no longer provide financing for new coal mining and power projects outside China from the last quarter of 2021.

Xi’s statement is expected to affect at least 54 gigawatts of proposed China-backed coal plants that are not yet under construction. Shelving these would save CO₂ emissions equivalent to three months of global emissions.

This pledge from the world’s largest public financier of overseas coal plants could usher in a new era of low-carbon development. But that depends on what happens in the countries where China had funneled money into coal power.

Many of these places urgently need new energy infrastructure. Will China’s investments here be redirected to renewable energy – or simply disappear?
Chinese support for renewables abroad

One positive sign came in the same speech to the UN, when Xi indicated that “China will step up support for other developing countries in developing green and low-carbon energy.”

China’s overseas energy investments grew as part of the Belt and Road Initiative. Launched in 2013, Xi’s signature foreign-policy effort increased China’s cooperation with the rest of the world through infrastructure development, unimpeded trade, financial integration and policy coordination.

China has continued to provide finance for the Belt and Road Initiative during the pandemic, and investment in renewables made up most (57%) of the country’s financial support for overseas energy projects in 2020 – up from 38% in 2019.


Beijing has supported wind and solar projects in more than 20 developing countries since 2013, including Ethiopia and Kenya. And Chinese banks and companies have also expanded their overseas investments in renewable energy over the last decade.

China’s overseas renewable energy portfolio has grown with the belt and road initiative. China’s Global Power Database/Boston University, Author provided

While the trends are positive, challenges remain. China’s overseas investment policy remains guided by the non-interference principle. This means that Beijing is supposed to let host countries determine the type of energy projects, and only requires Chinese firms to comply with host-country regulations.

Research shows that China’s finance for coal in Asia was largely driven by demand in recipient countries. This is because the domestic policies of these countries prioritized improving energy access over reducing emissions, and coal was a cheap and proven source.

Inadequate grid infrastructure and politicians skeptical of renewable energy in countries receiving Chinese investment have also hampered development. In Indonesia, business leaders and politicians formed pro-coal lobby groups to influence the design of China-backed projects.

China’s new pledge tells prospective recipient countries that coal finance is no longer an option. China must now promote its offer of investment in renewables. Drawing on its domestic experiences, Beijing should provide subsidies or tax cuts to companies willing to build renewable energy projects outside China.

Chinese energy developers are often wary of investment risks in developing countries due to their unfamiliarity with local politics. The Chinese government can help by increasing coordination between Chinese companies and local governments, businesses and communities in host countries.

Over the past decade, China has supported many developing countries to increase their energy generating capacity with financing, affordable technology and quick project delivery.

China has taken the first step to stop funding coal. It’s now time to adopt policies that support the overseas activities of its renewable energy developers.

Yixian Sun, Lecturer (Assistant Professor) in International Development, University of Bath.


This article is republished from The Conversation under a Creative Commons license. Read the original article.