Friday, January 07, 2022

Researchers Pioneer New View Of Deep Rock Fractures For Geothermal Energy

The flow of electrical current signals changes in fractures deep beneath the earth.

By Christina Nunez

Scorchingly hot granite deep underground can be tapped for energy by opening up cracks in the rock. This potential resource, known as enhanced geothermal energy, requires a clear sense of changes happening in the rock over time — a complex picture that can be difficult to capture.

A team led by researchers at Pacific Northwest National Laboratory (PNNL) has demonstrated a new way to monitor deep subsurface fractures. The technique, electrical resistivity tomography (ERT), gauges underground changes by measuring electrical conductivity in the rock. ERT produces 4D — that is, 3D plus time-lapse — images of the subsurface.

What is an enhanced geothermal system?


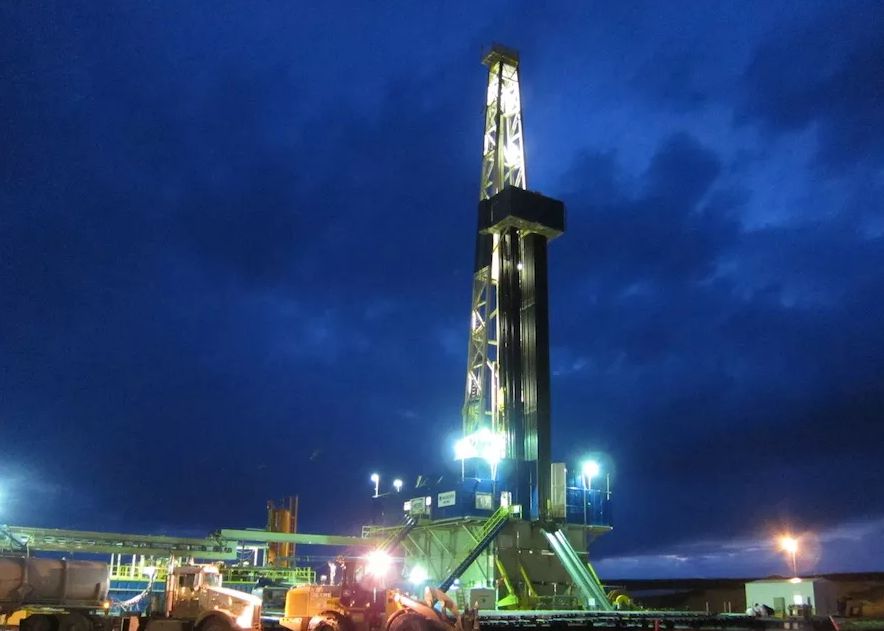
Conventional geothermal systems rely on water and flow pathways that are already present within hot rock. An enhanced geothermal system harvests heat trapped within dry rock by introducing water and cracks. Operators drill two underground wells thousands of feet below the surface and then inject fluid at high pressure to fracture the rock between the wells. The fracturing process for heat is similar to what’s known as “fracking” shale rock to release oil and gas.

Temperatures at this level can reach beyond 200°C (392°F). Water pumped from one well to the other and back up to the surface collects heat from the rock, generating steam that can drive a turbine for electricity.

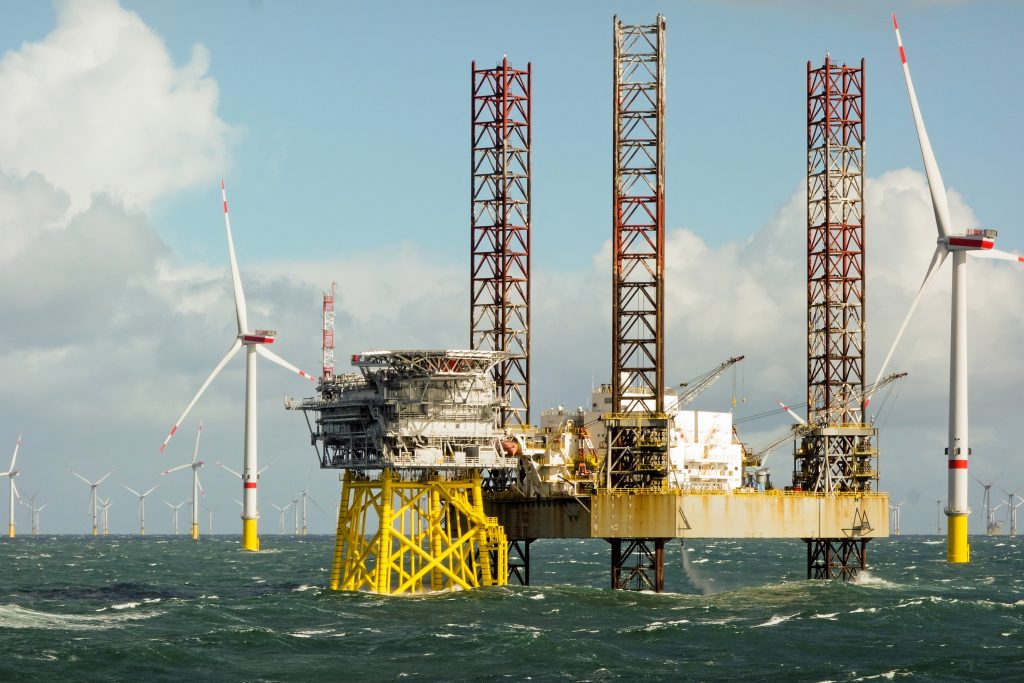
Enhanced geothermal systems could provide an estimated 100 gigawatts of electricity — enough to power 100 million homes. But such systems involve expensive drilling, and they need better monitoring and prediction of underground changes to reduce the uncertainty and risk associated with a given project.

Like any underground environment, enhanced geothermal systems change over time. Fractures in the rock open and close in response to stresses caused by high-pressure fluid injections, changing the system’s heat output. Seismic activity is one indicator of subsurface stress, but information from microseismic monitoring is limited.

“In these deep, hot rocks, it’s too expensive to drill enough monitoring wells to understand what’s going on using direct sampling,” said Tim Johnson, a computational scientist at PNNL who co-authored the study. “The primary focus of this project is to better understand, and ultimately to predict, how fractures are going to behave in a high-stress environment when you try to connect them between two wells.”
Getting a clearer underground picture

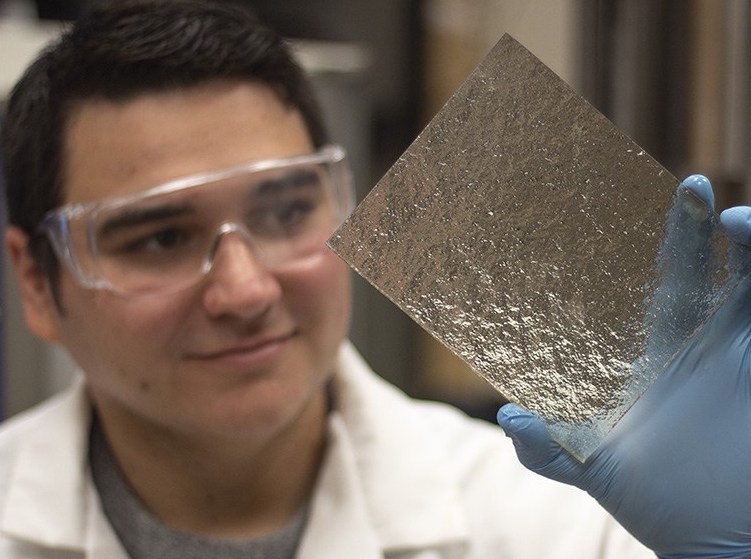
ERT involves placing metal electrodes within monitoring boreholes, then imaging the conductivity of the rock when electric current is sent between them. Increases in conductivity over time show where fractures are opening; when fractures are narrower or closed, conductivity goes down. Johnson developed software called E4D that operates on supercomputing systems and converts all of this electrical information to an image that looks a bit like a heat map, showing variations in conductivity over time. E4D won an R&D 100 Award in 2016.


Time-lapse electrical resistivity tomography. (Time-lapse by Tim Johnson, et al. | Pacific Northwest National Laboratory)

“It’s similar to medical imaging, except that you’re doing a time lapse,” Johnson said. “So you’re watching how things change, and usually the change relates to how the fluid is flowing in the subsurface.”

Johnson and other researchers at PNNL have pioneered the use of ERT as a 3D monitoring tool, and E4D at shallower depths of up to 350 feet, where it has been used to detect and trace contaminants, for example. To test it in the deep subsurface, the team deployed it at the Sanford Underground Research Facility in Lead, South Dakota. The work, which is supported by the Department of Energy (DOE)’s Office of Energy Efficiency and Renewable Energy through its Geothermal Technologies Office, is part of a larger collaborative effort across DOE to enhance access to natural resources and storage in the subsurface. Lawrence Berkeley National Laboratory leads the effort, known as the Enhanced Geothermal Systems (EGS) Collab. Partner labs include PNNL, Sandia National Laboratories, Lawrence Livermore National Laboratory, Idaho National Laboratory, and Los Alamos National Laboratory.
Pioneering a new subsurface imaging technique

The intent of the ERT monitoring at Sanford was to monitor fluid flow, as had been done at shallower levels. But the results initially didn’t seem to align with those earlier uses.


The experimental testbed located in a mine tunnel 4,850 feet below the surface, in the Sanford Underground Research Facility. (Photo by Hunter Knox | Pacific Northwest National Laboratory)

After years of hunting for an answer, Johnson found it in scientific papers from the 1960s and 1970s. Researchers at the Massachusetts Institute of Technology and also at Lawrence Berkeley National Laboratory had observed changes in the conductivity of crystalline rocks in response to stress — squeezing the rock in lab experiments made it less conductive. This meant the ERT wasn’t simply following fluid underground. It was charting the opening and closing of fractures in response to stress.”What we were seeing with the changes in conductivity didn’t make sense in terms of fluid flow,” Johnson said. But if the conductivity wasn’t reflecting the movement of fluids, what was it showing?

“Once we made that link, everything made sense in terms of what the time-lapse images were doing,” Johnson said.

ERT offers several advantages. With no moving parts and electrodes installed outside the well casing, the equipment is low maintenance and can operate while injections are happening. And the imaging happens in real time, giving facility operators feedback they can use almost immediately, if needed. However, ERT cannot be used with metal wellbore casings, which are ubiquitous in deep subsurface projects.

There are ways around this hurdle, such as using fiberglass casing, coating the casing with a non-metallic epoxy, or using a different, nonmetallic material altogether. But for now, Johnson and team are continuing to improve and test the use of ERT at the Sanford facility.

The paper, “4D Proxy Imaging of Fracture Dilation and Stress Shadowing Using Electrical Resistivity Tomography During High Pressure Injections into a Crystalline Rock Formation,” was published in October in the Journal of Geophysical Research: Solid Earth. Co-authors with Johnson were Jeff Burghardt, Chris Strickland, Hunter Knox, Vince Vermeul, and Mark White at PNNL; Paul Schwering and Doug Blankenship at Sandia National Laboratories; Tim Kneafsey at Lawrence Berkeley National Laboratory; and the team at EGS Collab.

Courtesy of Pacific Northwest National Laboratory.

TEXAS A&M ENGINEER DEVELOPS 3D PRINTED MODELS THAT UNCOVER THE SECRETS BEHIND OPTIMAL FRACKING


JANUARY 07TH 2022 

A researcher at Texas A&M University has come up with a novel 3D printing-based approach to accurately simulating the hydraulic fracturing or ‘fracking’ oil and natural gas mining process.

Working with local research university Colorado School of Mines, engineer Gabriel Tatman has managed to develop clear printed models, which reveal the impact of flow materials used during fracking, a phenomenon usually obscured from view.

Made using rock fracture data recovered from actual oil drilling sites, it’s believed that these models could uncover previously-unseen hydraulic fracturing behaviors, and ultimately enable industry firms to optimize their oil and gas recovery efforts.

“We can simulate fracture surfaces by using common geostatistical approaches that capture the characteristics of a particular formation,” explained Tatman. “With 3D printing, we can create physical versions of these simulated surfaces for experiment applications.”

“WE’RE NOT THE FIRST TO 3D PRINT ROCK SURFACES, BUT WE ARE THE FIRST TO DO RESIN 3D PRINTING FOR THIS PARTICULAR APPLICATION.”

Petroleum engineering graduate student Gabriel Tatman holding one of his 3D printed models. Image via Texas A&M University.

Fracking: a contentious mining method


Essentially, ‘fracking’ describes a mining process in which drilling is used to access vast shale oil and gas resources under the sea. To effectively extract these fuels from shale bedrock, water, aggregates and chemicals need to be forced into subsea formations at high pressures, which, according to critics, can cause lasting environmental damage.

Once this initial stage is complete, differently-sized grains of sand called ‘proppants’ are flushed down into the fractures created in a sort of slurry, to hold them open so that oil and gas can flow into a well. Additionally, so-called ‘diverters,’ made of dissolvable/recoverable chemical or mechanical materials, also tend to be used to strategically block proppants’ paths and help direct mined resources.

The eco-impact of fracking aside, the practise remains vital to many nations’ oil reserves, with the U.S. Energy Information Administration (EIA) estimating that in 2020, 65% of the country’s crude oil came from shale. However, by its very nature, the mechanics of fracking take place deep underground, making it difficult to fully-understand and perfect.

A fracking oil drilling rig being used in North Dakota. Image via Live Science.

A novel fracking modelling approach

To better understand rock formations, Tatman initially began toying with the idea of using 3D printing as an undergraduate, when he managed to create a casting containing a complex, acid-dissolved flow channel structure. Impressed by his work, Texas A&M Professor Ding Zhu encouraged her student to test the approach’s potential in further studies, eventually leading to his mining model discovery.

Since becoming a postgraduate, Tatman has managed to apply his rock-printing process to simulate fracking, by producing clear samples with a micrometer-level of fracture surface detail. When proppant and diverter are flushed through these models, it’s possible to directly observe their behaviors for the first time, an advance that his Texas A&M colleagues have called “groundbreaking” for shale mining.

Compared to existing proppant flow ‘conductivity’ research, which often relies on the use of standard lab equipment, the researcher’s approach is said to yield more realistic, rough fracture surface models, which can potentially be used to make molds capable of yielding repeatable cement test structures, and ultimately attaining more consistent fracking experiment results.

Acknowledging that the characteristics of fractures tend to vary in each shale formation, Tatman says that his approach will eventually be used to aid future research, by creating a proppant behavior database for different reservoirs.

In fact, the engineer also believes that 3D printing can be deployed in a similar way in other areas, such as gaining an understanding of plugging agent behaviors, in the wormhole geometries formed within acid-treated reservoirs, however, while Tatman is proud of his contribution to the project, he is now set to leave for a full-time industry position.

“(Over) the past five years, the level of development seen in the 3D printing world has been phenomenal,” concluded Tatman. “3D printing has been something I have been passionate about since high school. Being able to bring the hobby side of my life to the research side and integrate both into something productive has been something I’m really proud of.”

According to a Protolabs survey published last year, the oil and gas sector is beginning to warm to the idea of spare part 3D printing. Photo via Protolabs.

3D printing’s oil and gas potential


Due to the remote nature of offshore mining operations, oil and gas firms are increasingly turning to 3D printing to in-source their spare part production, and ensure their drilling plans go interrupted. Protolabs, for instance, released its Decision Time report last year, in which it found that up to 83% of industry firms could now adopt 3D printing in this way.

Energy services provider Hunting PLC has also recognized the technology’s potential in the oil and gas sector, by acquiring 27% of 3D printing bureau Cumberland Additive. In doing so, the firm has made its first move into the additive manufacturing sector, and it’s said to see its acquired technologies as being compatible with the needs of its offshore clientele.

Over in Brazil, Carl Zeiss, SENAI and Petróleo Brasileiro (Petrobras) are also working to advance the application of metal 3D printing within the country’s oil and gas industry. Over the next 18 months or so, the companies aim to validate novel DED and PBF methodologies for producing critical industry components, focusing in particular on the role of powder aging and degradation on defect formation.

To stay up to date with the latest 3D printing news, don’t forget to subscribe to the 3D Printing Industry newsletter or follow us on Twitter or liking our page on Facebook.

For a deeper dive into additive manufacturing, you can now subscribe to our Youtube channel, featuring discussion, debriefs, and shots of 3D printing in-action.

Are you looking for a job in the additive manufacturing industry? Visit 3D Printing Jobs for a selection of roles in the industry.

Scientists find surprisingly cool 'hotspots' under Earth's crust

volcano
Credit: Unsplash/CC0 Public Domain

The hotspots that created volcanic islands such as those of Hawaii, Iceland and the Galapagos Islands may often prove surprisingly cool, a new study finds.

These findings suggest that such hotspots may not always originate from giant plumes of scorching hot  welling up from near Earth's core as previously thought, scientists noted.

Volcanoes are typically found near the borders of tectonic plates, born from clashes between those giant slabs of rock as they drift on top of the mantle layer between Earth's core and crust. Classic examples of such volcanoes are those that make up the so-called Ring of Fire on the Pacific Rim.

However, volcanoes sometimes erupt in the middle of tectonic plates. The sources of these hotspots might be , mushroom-shaped pillars of hot rock ascending from the deep mantle to sear overlying material like a blowtorch. As tectonic plates wander over such plumes, geologists think chains of volcanic isles can emerge.

Previous research suggested volcanic hotspots are roughly 100 to 300 degrees Celsius (180-540 F) hotter than mid-ocean ridges, where magma rises as tectonic plates spread apart underwater. This supported the view that hotspots were heated by matter from near Earth's hot core and mid-ocean ridges by cooler mantle rock.

Now scientists find that many hotspots are dramatically cooler than previously thought, raising questions about their origins. "A substantial fraction of hotspots do not fit the classical  model," said Vedran Lekic, a seismologist at the University of Maryland, College Park, who did not participate in this study.

In the new study, researchers analyzed the velocity of seismic waves rippling through the mantle underneath oceanic hotspots and ridges to estimate temperatures at those sites. (Seismic waves travel faster through cold rock.)

Roughly 45% of hotspots are more than 155 C (279 F) hotter than mid-ocean ridges. However, about 40% are only 50 to 136 C (90-245 F) hotter than mid-ocean ridges, not particularly hot and therefore not buoyant enough to support the active upwelling of rock from the deep mantle. What's more, roughly 15% of hotspots are especially cold, only 36 C hotter or less than mid-.

To shed light on the origins of these different varieties of hotspots, the scientists also examined the ratio of rarer helium-3 to more common helium-4 in their rock. (The atomic cores of helium-3 each possess just one neutron, whereas helium-4 nuclei each have two.)

Helium found in Earth's crust is mostly helium-4 arising from the breakdown of uranium and other radioactive isotopes over time, whereas helium from deep within Earth is richer in helium-3, likely from reservoirs of ancient material preserving the original ratio found between these isotopes during Earth's first days. The researchers discovered hot hotspots possessed a much higher ratio of helium-3 to helium-4 than cold hotspots did.

Although the classic model of hotspots originating from plumes welling up from the deep mantle may explain hot hotspots, including most of the famous ones, such as those underlying Hawaii, Iceland, the Galapagos, Samoa and Easter Island, "perhaps the truth is that only a few hotspots truly behave like our classical model of mantle plumes and hotspots," said study co-author Carolina Lithgow-Bertelloni, a geodynamicist at the University of California, Los Angeles.

"This reinforces what some researchers have argued previously, which is that the term 'hotspot' is misleading and that volcanoes that don't fit the plate tectonic paradigm should rather be referred to as 'melting anomalies,'" said seismologist Ross Maguire from the University of New Mexico, who did not take part in this research.

Cooler hotspots may instead originate in the upper mantle, or from slow-moving deep plumes that have more time to cool, or from deep plumes that interact with and get cooled by swirling  rock. "If this is real, it will be a challenge for geodynamicists to explain such a finding," said Bernhard Steinberger, a geodynamicist at the German Research Center for Geosciences in Potsdam, who was not a part of this work. "These results will doubtlessly trigger new research."

All in all, "the classical view of plumes is not so much flawed than more complex than presented 30 to 50 years ago," Lithgow-Bertelloni said.

Instead, this work "points to a much greater variety among plumes," Steinberger said. "It is kind of like whenever you get a new close-up view of a planet or moon. It has some totally unexpected features. But it is still round."

In the future, the scientists would like to analyze every hotspot in more detail to get an even better sense of their temperatures, Lithgow-Bertelloni said. They also aim to conduct more computer simulations testing various cool  scenarios, she added.

The researchers detailed their findings in the Jan. 7 issue of the journal Science.Only the hottest, most buoyant mantle plumes draw from a primordial reservoir deep in the Earth

More information: Xiyuan Bao et al, On the relative temperatures of Earth's volcanic hotspots and mid-ocean ridges, Science (2022). DOI: 10.1126/science.abj8944

Journal information: Science 

Provided by Inside Science, American Institute of Physics 

This story is republished courtesy of Inside Science. Read the original story here. Used with permission. Inside Science is an editorially independent news service of the American Institute of Physics. 

Some volcanic hot spots may have a surprisingly shallow heat source

Geologic processes nearer the surface, rather than deep-mantle plumes, may fuel activity there


KILEUA 2018

By Sid Perkins
JANUARY 6, 2022

Some of the world’s volcanic hot spots may be fueled by molten material that originates surprisingly close to Earth’s surface.

While some of the hottest spots are fueled by plumes of buoyant material welling up from deep within Earth, as expected, molten flows driving activity at the coolest hot spots may result from relatively shallow geophysical processes, a new study suggests.

A lot of our planet’s volcanic activity occurs at or near the edges of the tectonic plates that make up Earth’s crust (SN: 1/13/21). At mid-ocean ridges, which often form the boundaries between some tectonic plates, hot material wells up from the mantle — the hot, thick layer that lies between the Earth’s core and its crust — to create fresh crust.

But more mysterious volcanic activity also occurs in many locales in the middle of a tectonic plate, far from mid-ocean ridges, says Xiyuan Bao, a geophysicist at UCLA. The islands of Hawaii, Ascension Island in the South Atlantic and the Pitcairn Islands in the South Pacific are just a few examples of volcanoes created by such activity (SN: 1/29/19).


Volcanic activity that formed the tiny island of Ascension, in the South Atlantic, may have been fueled by shallow geologic processes rather than a deep-mantle plume, a new study suggests.
NASA/WIKIMEDIA COMMONS

Scientists suspect that many of these sites of isolated volcanism are fed by plumes of hot material rising from deep within the mantle, somewhat akin to small packets of water rising to the surface in a pot of near-boiling water (SN: 9/16/13). But a new analysis by Bao and colleagues, described in the Jan. 7 Science, suggests that some of these isolated hot spots are fueled by material that isn’t as hot as expected, casting doubt that volcanic activity there is driven by deep-mantle plumes. The results could help scientists figure out the mysterious processes unfolding at various sites of volcanism in the interior of plates.

“This study helps sort out which volcanic plumes are deep-seated and which are not,” says Keith Putirka, an igneous petrologist at California State University, Fresno who wasn’t involved in the work.

The team focused on 26 volcanic hot spots in oceanic areas that previous studies had suggested were fed by deep-mantle plumes. The researchers used seismic data to estimate the temperature of mantle material at various depths from 260 to 600 kilometers. In general, the hotter the material is, the slower that seismic waves travel through it.

The team then compared the temperature estimate for each hot spot with the average temperature of mantle material welling up at mid-ocean ridges. Because tectonic plates are pulling apart there, there’s no resistance to upwelling of hot rock from deep in the mantle. That, in turn, provides a baseline against which scientists can compare temperatures of rocks deep beneath isolated hot spots.

Temperatures at mid-ocean ridges average about 1388° Celsius (2530° Fahrenheit). For a dozen of the hot spots the team studied, deep-mantle material was more than 155° C warmer than mid-ocean ridge material, Bao and his team report. Material that hot is more than warm enough to rise to Earth’s surface, chew through overlying crust and create prodigious volcanic activity.

But for 10 hot spots, deep-mantle material ranged between only 50° C and 135° C warmer than mid-ocean ridge material, just warm enough to rise to the surface and through crust. And four of the hot spots were less than 36° C warmer than mid-ocean ridge material, which suggests the hot spot material wouldn’t be able to rise fast enough to sustain buoyancy and break through the crust. Other sorts of geophysical processes occurring closer to Earth’s surface are fueling volcanic activity at these 14 cool-to-middling hot spots, the researchers propose.

“The evidence for mantle plumes under most volcanic islands is lacking,” says Godfrey Fitton, a geochemist at the University of Edinburgh who wasn’t involved in the work. An alternate source of molten material, he suggests, could be areas where tectonic plates collided to help create past supercontinents (SN: 1/11/17).

In those crumpled zones, Fitton explains, Earth’s crust would be thicker and thus help insulate the flow of heat from the mantle to the surface. The buildup of heat in the crust, in turn, could lead to local melting of carbonate-rich rocks that could fuel volcanism. In 2020, he and his colleagues suggested that such processes have fueled volcanism at hot spots off the western coast of Africa and off the northeastern coast of Brazil for the last 50 million years or more.

CITATIONS

X. Bao et al. On the relative temperatures of Earth’s volcanic hotspots and mid-ocean ridges. Science. Vol. 375, January 7, 2022, p. 57. doi: 10.1126/science.abj8944.


A.R. Guilmarães et al. Contemporaneous intraplate magmatism on conjugate South Atlantic margins: A hotspot conundrum. Earth and Planetary Science Letters. Vol. 536, April 15, 2020, page 116147-1. doi: 10-1016/j.epsl.2020.116147.

Related Stories
Explore the Monkey Head Nebula with NASA’s stunning visualization

The Monkey Head Nebula is a star-forming region. Bright, newborn stars in the proximity of nebula's center light up surrounding gas with energetic radiation.


By: Trends Desk | New Delhi |
January 7, 2022 

A beautiful patch of starry sky is visualized by NASA (Source: nasahubble, Instagram)

Star-gazing fills the hearts of inquisitive people. NASA often enamours people with its stunning videos and visualisations about the universe. The space agency has come up with a video of Monkey Head Nebula online, leaving netizens enthralled.

A beautiful patch of starry sky is showcased in the video. As the visual is zoomed through the Monkey Head Nebula, it leaves viewers spellbound. The carved knots of gas and dust in nebula are visible in the visual.


“This spectacular Hubble visualization shows a star-forming region 6,400 light-years away. Hubble imaged the Monkey Head Nebula, formally known as NGC 2174, for its 24th anniversary in 2014,” reads caption of the clip.

The video has garnered over 37,000 likes. Netizens were amazed to watch the visualization. “Beyond amazing,” commented a user. “There are several types of nebulae, right?” asked another user.


The Instagram handle @nasahubble includes a plethora of stunning visuals and images. Astronomy enthusiasts flock the social media account.
ALSO READ |NASA shares video of ‘cosmic rose’, leaves netizens fascinated

According to NASA, nebula is a star-forming region which includes dusky dust clouds silhouetted against glowing gas. The Monkey Head Nebula (also known as NGC 2174) is a star-forming region. Bright, new-born stars in the proximity of nebula’s center light up surrounding gas with energetic radiation.

Is Earth an Oddball? One of the Strangest Things in the Cosmos Might Be – Us

Earth Rotating Sun Space

How rare in the galaxy are rocky planets like Earth in similar orbits around Sun-like stars? The question turns out to be surprisingly difficult to answer.

One of the strangest things in the cosmos might be – us.

Among the thousands of planets confirmed to be in orbit around other stars, we’ve found nothing quite like our home planet. Other planets in Earth’s size range? Sure, by the bushel. But also orbiting a star like our Sun, at a comparable distance? So far it’s just one, lonely example. The one beneath our feet.

A big part of this is likely to be the technical difficulty of finding a sister planet. Our telescopes, in space and on the ground, find planets around other stars by two main methods: wobbles and shadows.

The “wobble” method, or radial velocity, traces the subtle back-and-forth motion as orbiting planets tug their star this way, then that, because of gravity. The larger the tug, the “heavier” the planet — that is, the greater its mass.

In the search for shadows, planet-hunting telescopes wait for a tiny dip in starlight as a planet crosses the face of its star — a crossing known as a “transit.” The bigger the dip, the wider the planet.

In both cases, large planets are much easier to detect than small ones. And in the case of transits, small, rocky planets about the size of Earth show up much better against very small stars known as red dwarfs. In a sense, they cast a bigger shadow that blots out proportionally more of a small star’s light, so instruments like NASA’s TESS space telescope can more readily find them. A Sun-sized star won’t dim as much when an Earth-size planet passes by, making their transits harder to detect.

Apollo 11 Earth Image

Apollo 11 Earth image. Credit: NASA Johnson Space Center

And there’s another troubling issue: time. A planet orbiting a star at Earth’s distance from the Sun would take about 365 days to make one revolution – just like our planet’s “year.” But to confirm such an orbit, your telescope would have to stare at that star for, say, 365 days to catch even one transit — and to be sure it’s truly a planet, you’ll want to see at least two or three of these transit signals.

All of these difficulties have placed such planets largely out of reach for today’s instruments. We’ve found plenty of small, rocky planets, but they’re nearly all orbiting red dwarf stars.

In our galaxy, red dwarfs are far more common than larger yellow stars like our Sun. That still leaves room for billions of Sun-like stars and, maybe, a significant number of habitable, Earth-sized worlds circling them.

Or maybe not.

Rare or just difficult?

The apparent oddness of our home system doesn’t end with Earth. Our particular arrangement – small, rocky worlds in the nearest orbits, big gas giants farther out – also is something we haven’t yet detected in close parallel anywhere else. Whether this is because they are truly scarce or because they are hard to detect is unclear.

Jupiter takes one trip around the Sun every 12 years. But Jupiter-type planets in long orbits are comparatively rare around other stars, and that could be important. Theorists say Jupiter might well have cleared the way for Earth to become a habitable world, quite literally. The giant planet’s intense gravity could have hoovered up small rocky bits that might otherwise have smashed into Earth, sterilizing it just as life was getting its start.

“The planetary systems we are finding do not look like our solar system,” said Jessie Christiansen, a research scientist at NASA’s Exoplanet Science Institute. “Is it important that our solar system is different? We don’t know yet.”

Christiansen, who studies exoplanet demographics, does not think “Earths” will turn out to be rare, but says scientific literature on the question “is all over the place.”

Far more data are needed, scientists tell us, to determine the frequency of planets similar to Earth in both size and circumstance.

Future space telescopes could examine the atmospheres of distant, rocky worlds for signs of oxygen, methane, or carbon dioxide – in other words, an atmosphere that reminds us of home.

For now, we remain in the dark. Earth-like planets around Sun-like stars might be plentiful. Or, they could be the true oddballs of the galaxy.


Astronomers find the biggest structure in the Milky Way: A filament of hydrogen 3,900 light-years long

Astronomers find the biggest structure in the milky way, a filament of hydrogen 1,600 light-years long
The section of the Milky Way, as measured by ESA’s Gaia satellite (top)
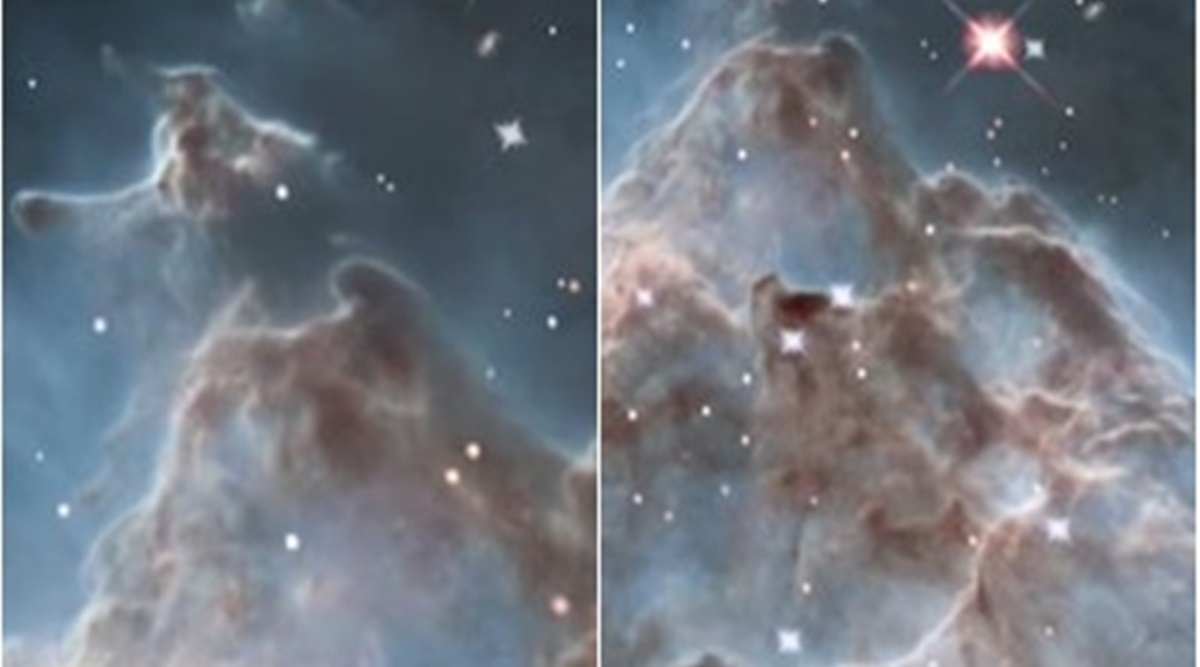
.
 The box marks the location of the “Maggie” filament and the false-color image of atomic 
hydrogen distribution (bottom), the red line indicating the “Maggie” filament. 
Credit: ESA/Gaia/DPAC/T. Müller/J. Syed/MPIA

Roughly 13.8 billion years ago, our universe was born in a massive explosion that gave rise to the first subatomic particles and the laws of physics as we know them. About 370,000 years later, hydrogen had formed, the building block of stars, which fuse hydrogen and helium in their interiors to create all the heavier elements. While hydrogen remains the most pervasive element in the universe, it can be difficult to detect individual clouds of hydrogen gas in the interstellar medium (ISM).

This makes it difficult to research the early phases of star formation, which would offer clues about the evolution of galaxies and the cosmos. An international team led by astronomers from the Max Planck Institute of Astronomy (MPIA) recently noticed a massive filament of atomic  gas in our galaxy. This structure, named Maggie, is located about 55,000 light-years away (on the other side of the Milky Way) and is one of the longest structures ever observed in our galaxy.

The study that describes their findings, which recently appeared in the journal Astronomy & Astrophysics, was led by Jonas Syed, a Ph.D. student at the MPIA. He was joined by researchers from the University of Vienna, the Harvard-Smithsonian Center for Astrophysics (CfA), the Max Planck Institute for Radio Astronomy (MPIFR), the University of Calgary, the Universität Heidelberg, the Centre for Astrophysics and Planetary Science, the Argelander-Institute for Astronomy, the Indian Institute of Science, and NASA's Jet Propulsion Laboratory (JPL).

The research is based on data obtained by the HI/OH/Recombination line survey of the Milky Way (THOR), an observation program that relies on the Karl G. Jansky Very Large Array (VLA) in New Mexico. Using the VLA's centimeter-wave radio dishes, this project studies molecular cloud formation, the conversion of atomic to , the galaxy's magnetic field, and other questions related to the ISM and star formation.

The ultimate purpose is to determine how the two most common hydrogen isotopes converge to create dense clouds that rise to new stars. The isotopes include atomic hydrogen (H), composed of one proton, one electron, and no neutrons, and molecular hydrogen (H2)—or Deuterium—is composed of one proton, one neutron and one electron. Only the latter condenses into relatively compact clouds that will develop frosty regions where new stars eventually emerge.

Credit: Universe Today

The process of how atomic hydrogen transitions to molecular hydrogen is still largely unknown, which made this extraordinarily long filament an especially exciting find. Whereas the largest known clouds of molecular gas typically measure around 800 light-years in length, Maggie measures 3,900 light-years long and 130 light-years wide. As Syed explained in a recent MPIA press release:

"The location of this filament has contributed to this success. We don't yet know exactly how it got there. But the filament extends about 1600 light-years below the Milky Way plane. The observations also allowed us to determine the velocity of the hydrogen gas. This allowed us to show that the velocities along the filament barely differ."

The team's analysis showed that matter in the filament had a mean velocity of 54 km/s-1, which they determined mainly by measuring it against the rotation of the Milky Way disk. This meant that radiation at a wavelength of 21 cm (aka the "hydrogen line") was visible against the cosmic background, making the structure discernible. "The observations also allowed us to determine the velocity of the hydrogen gas," said Henrik Beuther, the head of THOR and a co-author on the study. "This allowed us to show that the velocities along the filament barely differ."

From this, the researchers concluded that Maggie is a coherent structure. These findings confirmed observations made a year before by Juan D. Soler, an astrophysicist with the University of Vienna and co-author on the paper. When he observed the filament, he named it after the longest river in his native Colombia: the Río Magdalena (Anglicized: Margaret, or "Maggie"). While Maggie was recognizable in Soler's earlier evaluation of the THOR data, only the current study proves beyond a doubt that it is a coherent structure.

Based on previously published data, the team also estimated that Maggie contains 8 percent molecular hydrogen by a mass fraction. On closer inspection, the team noticed that the gas converges at various points along the , which led them to conclude that the hydrogen gas accumulates into large clouds at those locations. They further speculate that atomic gas will gradually condense into a molecular form in those environments.

"However, many questions remain unanswered," Syed added. "Additional data, which we hope will give us more clues about the fraction of molecular gas, are already waiting to be analyzed." Fortunately, several space-based and ground-based observatories will become operational soon, telescopes that will be equipped to study these filaments in the future. These include the James Webb Space Telescope (JWST) and radio surveys like the Square Kilometer Array (SKA), which will allow us to view the very earliest period of the universe ("cosmic dawn") and the first stars in our universe.Scientists discover more about the ingredients for star formation

More information: J. Syed et al, The "Maggie" filament: Physical properties of a giant atomic cloud, Astronomy & Astrophysics (2021). DOI: 10.1051/0004-6361/202141265

Journal information: Astronomy & Astrophysics 

Provided by Universe Today 


Astronomers witness a dying star reach its explosive end

Astronomers witness A dying star reach its explosive end
An artist’s impression of a red supergiant star in the final year of its life emitting a
 tumultuous cloud of gas. This suggests at least some of these stars undergo significant
 internal changes before going supernova. 
Credit: W. M. Keck Observatory/Adam Makarenko

For the very first time, astronomers have imaged in real time the dramatic end to a red supergiant's life, watching the massive star's rapid self-destruction and final death throes before it collapsed into a Type II supernova.

Using two Hawaiʻi telescopes—the University of Hawaiʻi Institute for Astronomy Pan-STARRS on Haleakalā, Maui and W. M. Keck Observatory on Maunakea, Hawaiʻi Island—a team of researchers conducting the Young Supernova Experiment (YSE) transient survey observed the  during its last 130 days leading up to its deadly detonation.

"This is a breakthrough in our understanding of what  do moments before they die," says Wynn Jacobson-Galán, an NSF Graduate Research Fellow at UC Berkeley and lead author of the study. "Direct detection of pre-supernova activity in a red supergiant star has never been observed before in an ordinary Type II supernova. For the first time, we watched a red supergiant star explode!"

The discovery is published in today's issue of The Astrophysical Journal.

Pan-STARRS first detected the doomed massive star in Summer of 2020 via the huge amount of light radiating from the red supergiant. A few months later, in Fall of 2020, a supernova lit the sky.

The team quickly captured the powerful flash and obtained the very first spectrum of the energetic explosion, named supernova 2020tlf, or SN 2020tlf, using Keck Observatory's Low Resolution Imaging Spectrometer (LRIS). The data showed direct evidence of dense circumstellar material surrounding the star at the time of explosion, likely the same exact gas that Pan-STARRS had imaged the red supergiant star violently ejecting earlier in the summer.

An artist’s rendition of a red supergiant star transitioning into a Type II supernova, emitting a violent eruption of radiation and gas on its dying breath before collapsing and exploding. Credit: W. M. Keck Observatory/Adam Makarenko

"Keck was instrumental in providing direct evidence of a massive star transitioning into a supernova explosion," says senior author Raffaella Margutti, an associate professor of astronomy at UC Berkeley. "It's like watching a ticking time bomb. We've never confirmed such violent activity in a dying red supergiant star where we see it produce such a luminous emission, then collapse and combust, until now."

The team continued to monitor SN 2020tlf after the explosion; based on data obtained from Keck Observatory's DEep Imaging and Multi-Object Spectrograph (DEIMOS) and Near Infrared Echellette Spectrograph (NIRES), they determined SN 2020tlf's progenitor , located in the NGC 5731 galaxy about 120 million light-years away as seen from Earth, was 10 times more massive than the Sun.

The discovery defies previous ideas of how red supergiant stars evolve right before blowing up. Prior to this, all red supergiants observed before exploding were relatively quiescent: they showed no evidence of violent eruptions or luminous emission, as was observed prior to SN 2020tlf. However, this novel detection of bright radiation coming from a red supergiant in the final year before exploding suggests that at least some of these stars must undergo significant changes in their internal structure that then results in the tumultuous ejection of gas moments before they collapse.

Margutti and Jacobson-Galán conducted most of the study during their time at Northwestern University, with Margutti serving as an Associate Professor of Physics and Astronomy and member of CIERA (Center for Interdisciplinary Exploration and Research in Astrophysics), and Jacobson-Galán as a graduate student.

The team's discovery paves a path forward for transient surveys like YSE to hunt for luminous radiation coming from red supergiants, and gather more evidence that such behavior could signal the imminent, supernova demise of a massive star.

"I am most excited by all of the new 'unknowns' that have been unlocked by this discovery," says Jacobson-Galán. "Detecting more events like SN 2020tlf will dramatically impact how we define the final months of stellar evolution, uniting observers and theorists in the quest to solve the mystery on how massive  spend the final moments of their lives."Merger between two stars led to blue supergiant, iconic supernova

More information: Final Moments. I. Precursor Emission, Envelope Inflation, and Enhanced Mass Loss Preceding the Luminous Type II Supernova 2020tlf, Astrophysical Journal (2022). iopscience.iop.org/article/10. … 847/1538-4357/ac3f3a

Journal information: Astrophysical Journal 

Provided by W. M. Keck Observatory 

Remarkable Connection Discovered Between Supernovae and Life on Earth

Supernova Accelerates Cosmic Rays

Illustration of the Milky Way seen from Earth where supernova accelerates cosmic rays to high energies. Some of these cosmic ray particles enterers the Earth’s atmosphere, where they produce shower structures of secondary particles. A surprising result is that changes in cosmic rays through Earths history has influenced life on Earth. Credit: H. Svensmark/DTU Space

A remarkable link between the number of nearby exploding stars, called supernovae and life on Earths has been discovered.

Evidence demonstrates a close connection between the fraction of organic matter buried in sediments and changes in supernovae occurrence. This correlation is apparent during the last 3.5 billion years and in closer detail over the previous 500 million years.

The correlation indicates that supernovae have set essential conditions under which life on Earth had to exist. This is concluded in a new research article published in the scientific journal Geophysical Research Letters by senior researcher Dr. Henrik Svensmark, DTU Space.

According to the article, an explanation for the observed link between supernovae and life is that supernovae influence Earth’s climate. A high number of supernovae leads to a cold climate with a significant temperature difference between the equator and polar regions. This results in strong winds and ocean mixing, vital for delivering nutrients to biological systems. High nutrient concentration leads to a larger bioproductivity and a more extensive burial of organic matter in sediments. A warm climate has weaker winds and less mixing of the oceans, diminished supply of nutrients, a smaller bioproductivity, and less burial of organic matter.

“A fascinating consequence is that moving organic matter to sediments is indirectly the source of oxygen. Photosynthesis produces oxygen and sugar from light, water and CO2. However, if organic material is not moved into sediments, oxygen and organic matter become CO2 and water. The burial of organic material prevents this reverse reaction. Therefore, supernovae indirectly control oxygen production, and oxygen is the foundation of all complex life,” says author Henrik Svensmark.

In the paper, a measure of the concentration of nutrients in the ocean over the last 500 Million years correlates reasonably with the variations in supernovae frequency. The concentration of nutrients in the oceans is found by measuring trace elements in pyrite (FeS2, also called fool’s gold) embedded in black shale, which is sedimented on the seabed. Estimating the fraction of organic material in sediments is possible by measuring carbon-13 relative to carbon-12. Since life prefers the lighter carbon-12 atom, the amount of biomass in the world’s oceans changes the ratio between carbon-12 and carbon-13 measured in marine sediments.

“The new evidence points to an extraordinary interconnection between life on Earth and supernovae, mediated by the effect of cosmic rays on clouds and climate,” says Henrik Svensmark.

The link to climate 

Previous studies by Svensmark and colleagues have demonstrated that ions help the formation and growth of aerosols, thereby influencing cloud fraction. Since clouds can regulate the solar energy that can reach Earth’s surface, the cosmic-ray-cloud link is important for climate. Empirical evidence shows that Earth’s climate changes when the intensity of cosmic rays changes. Supernovae frequency can vary by several hundred per cent on geological time scales, and the resulting climate changes are considerable.  

 “When heavy stars explode, they produce cosmic rays made of elementary particles with enormous energies. Cosmic rays travel to our solar system, and some end their journey by colliding with Earth’s atmosphere. Here, they are responsible for ionizing the atmosphere,” he says.

Reference: “Supernova Rates and Burial of Organic Matter” by Henrik Svensmark, 5 January 2022, Geophysical Research Letters.
DOI: 10.1029/2021GL096376

New research shows gene exchange between viruses and hosts drives evolution

New research shows gene exchange between viruses and hosts drives evolution
Caption: 3D representation of a Zika virus. Credit: Manuel Almagro Rivas, CC BY-SA 4.0

The first comprehensive analysis of viral horizontal gene transfer (HGT) illustrates the extent to which viruses pick up genes from their hosts to hone their infection process, while at the same time hosts also co-opt useful viral genes.

HGT is the movement of genetic material between disparate groups of organisms, rather than by the "vertical" transmission of DNA from parent to offspring. Previous studies have looked at HGT between bacteria and their viruses and have shown that it plays a major role in the movement of  between bacterial species. However the new study, published in Nature Microbiology, looks at interactions between viruses and eukaryotes, which include animals, plants, fungi, protists and most algae.

"We knew from individual examples that viral genes have played a role in the evolution of eukaryotes. Even humans have viral genes, which are important for our development and ," said the study's lead author, Dr. Nicholas Irwin, a Junior Research Fellow at Merton College, University of Oxford, and former Ph.D. student at the University of British Columbia (UBC). "We wanted to understand more broadly how HGT has affected viruses and eukaryotes from across the tree of life."

To tackle this problem, the authors examined viral-eukaryotic gene transfer in the genomes of hundreds of eukaryotic species and thousands of viruses. They identified many genes that had been transferred and found that HGT from eukaryotes to viruses was twice as frequent as the reverse direction.

"We were interested to find that certain groups of viruses, especially those that infect single-celled eukaryotes, acquire a lot of genes from their hosts," said the study's senior author, Dr. Patrick Keeling, a professor in the Department of Botany at UBC. "By studying the function of these genes we were able to make predictions about how these viruses affect their hosts during infection."

In contrast to viruses, eukaryotic organisms retained fewer , although the ones that were kept appear to have had a major impact on  biology over evolutionary time.

"Many of these viral-derived genes appear to have repeatedly affected the structure and form of different organisms, from the cell walls of algae to the tissues of animals," said Dr. Irwin. "This suggests that host- interactions may have played an important role in driving the diversity of life we see today."

"These transfers not only have evolutionary consequences for both virus and host, but could have important health implications," Dr. Keeling said.

HGT allows genes to jump between species including viruses and their hosts. If the gene does something useful, it can sweep through the population and become a feature of that species. This can lead to a rapid emergence of new abilities, as opposed to the more incremental changes that result from smaller mutations.

Although viruses such as Zika and coronaviruses do not appear to participate in these gene transfers, they often manipulate similar genes in their hosts through complex mechanisms. Future research into these transferred genes may therefore provide a novel approach for understanding the infection processes of these and other viruses which could be important for drug discovery.

"The past two years have clearly demonstrated the destructive potential of viruses, but we think that this work serves as an interesting reminder that  have also contributed to the evolution of life on Earth," said Dr. Irwin.

Giant viruses may play an intriguing role in evolution of life on Earth
More information: Nicholas A. T. Irwin et al, Systematic evaluation of horizontal gene transfer between eukaryotes and viruses, Nature Microbiology (2021). DOI: 10.1038/s41564-021-01026-3
Journal information: Nature Microbiology 
Provided by University of British Columbia