Antarctic Sea Ice Sinks to Record Low
February 25, 2022
The long-term trend for sea ice in the south is flat, while the global trend points downward.
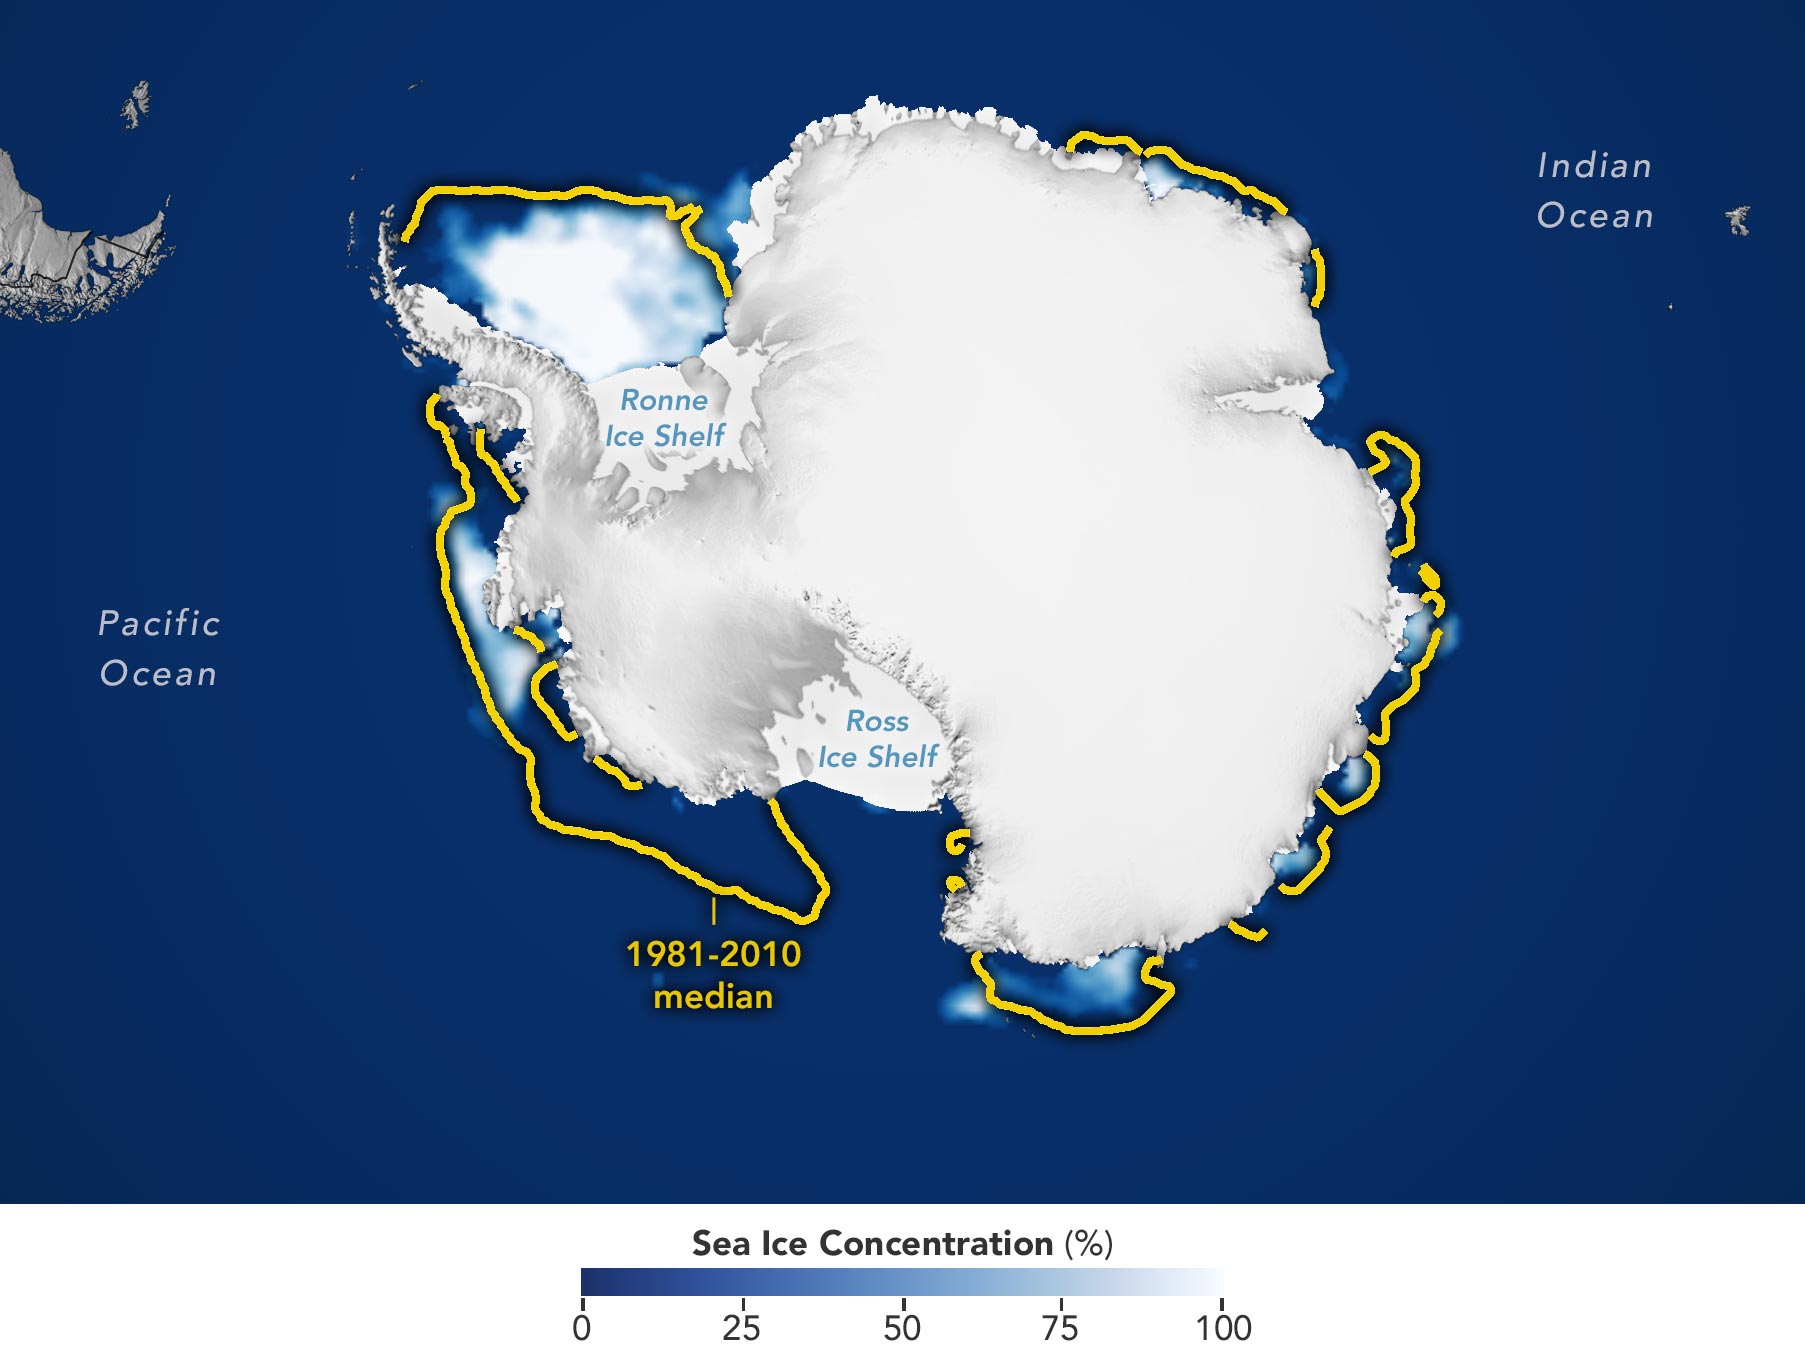
In February 2022, sea ice around Antarctica reached the lowest extent ever observed since the start of the satellite record in 1979. It marks the first time that the ice was observed to shrink below 2 million square kilometers.
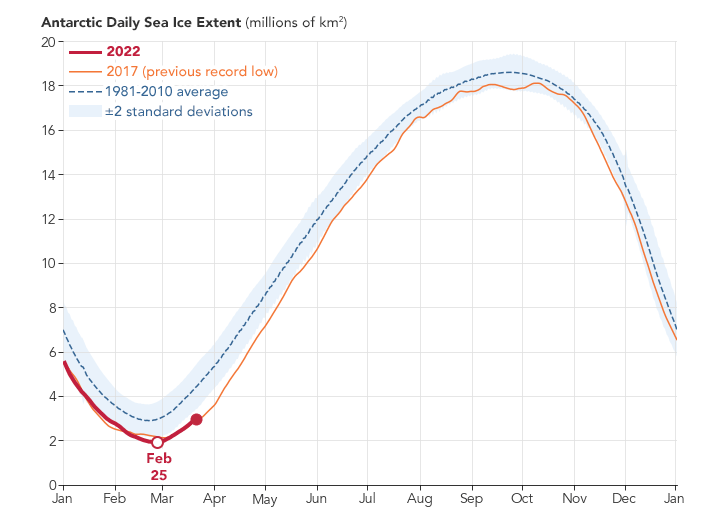
Sea ice in southern polar waters reached its lowest extent on February 25, 2022, at 1.92 million square kilometers (741,000 square miles). That’s 190,000 square kilometers (73,000 square miles) below the previous record-low reached on March 3, 2017. Compared to the average minimum, the sea ice this year is missing an area about twice the size of California.
The map above shows the ice extent on the day of its record low. Extent is defined as the total area in which the ice concentration is at least 15 percent. The yellow outline shows the median sea ice extent for February from 1981–2010. A median is the middle value: That is, half of the extents were larger than the yellow line and half were smaller.
1978 – 2022
The 2021-2022 melting season began earlier than usual, after the ice reached its seasonal maximum extent on September 1, 2021, and then quickly declined through the austral spring and summer. According to Walt Meier, a sea ice researcher at the National Snow and Ice Data Center, winds were the main reason for the low ice conditions this year. He explained that the winds around the continent were “much stronger than normal,” which quickly pushed ice north into warmer waters where it melted. An exception was in the Weddell Sea, where winds pushed the ice edge south.
Now, one month after sea ice reached its annual minimum, Meier said that the rate of growth looks normal. Even the heatwave that sent Antarctica’s air temperatures soaring in the third week of March does not seem to have slowed the growth. “It is really the ocean temperatures that count,” Meier said, “and a brief heat wave won’t affect things too much in that regard.”
It remains to be seen how much ice will regrow this year. While it is common for Antarctic sea ice to melt nearly all the way back to the coastline during the austral summer, the ice grows unconstrained through autumn and winter. After months of growth (February to September), new sea ice typically spans an area of ocean about twice the size of the continental United States.
1978 – 2022
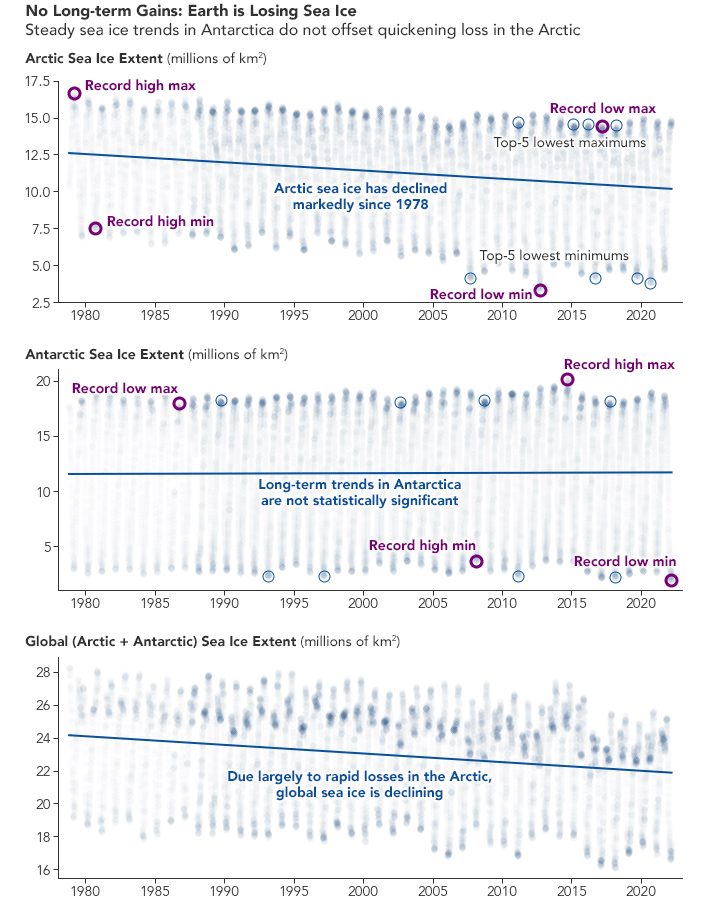
From year to year, Antarctic sea ice can be highly variable; since 2013 it has reached its highest high and its lowest low since record keeping began. A surge of sea ice growth in 2014 and 2015 enhanced a small upward trend in the long-term record. But over the past seven years, sea ice has generally been at or below average, including record-low minimums in 2017 and 2022. The long-term trend now appears flat, and because of the variability, is not considered statistically significant.
In contrast, sea ice in the Arctic shows a clear downward trend. That means that globally, the planet is losing sea ice. “Overall, for the Arctic and Antarctic combined,” Meier said, “the trend is definitely still downward.”
NASA Earth Observatory images by Joshua Stevens, using data from the National Snow and Ice Data Center.
Ice Shelf Completely Disintegrates in East Antarctica
The shelf’s disintegration in March 2022 has reshaped a landscape where coastal glacial ice was once thought to be stable.
It is relatively common for ice shelves in Antarctica to spawn icebergs. It is less common for an ice shelf to completely disintegrate. In March 2022, an ice shelf in East Antarctica did both. The collapse has reshaped a part of the Antarctic landscape where coastal glacial ice was once thought to be stable.
January 9, 2022
March 23, 2022
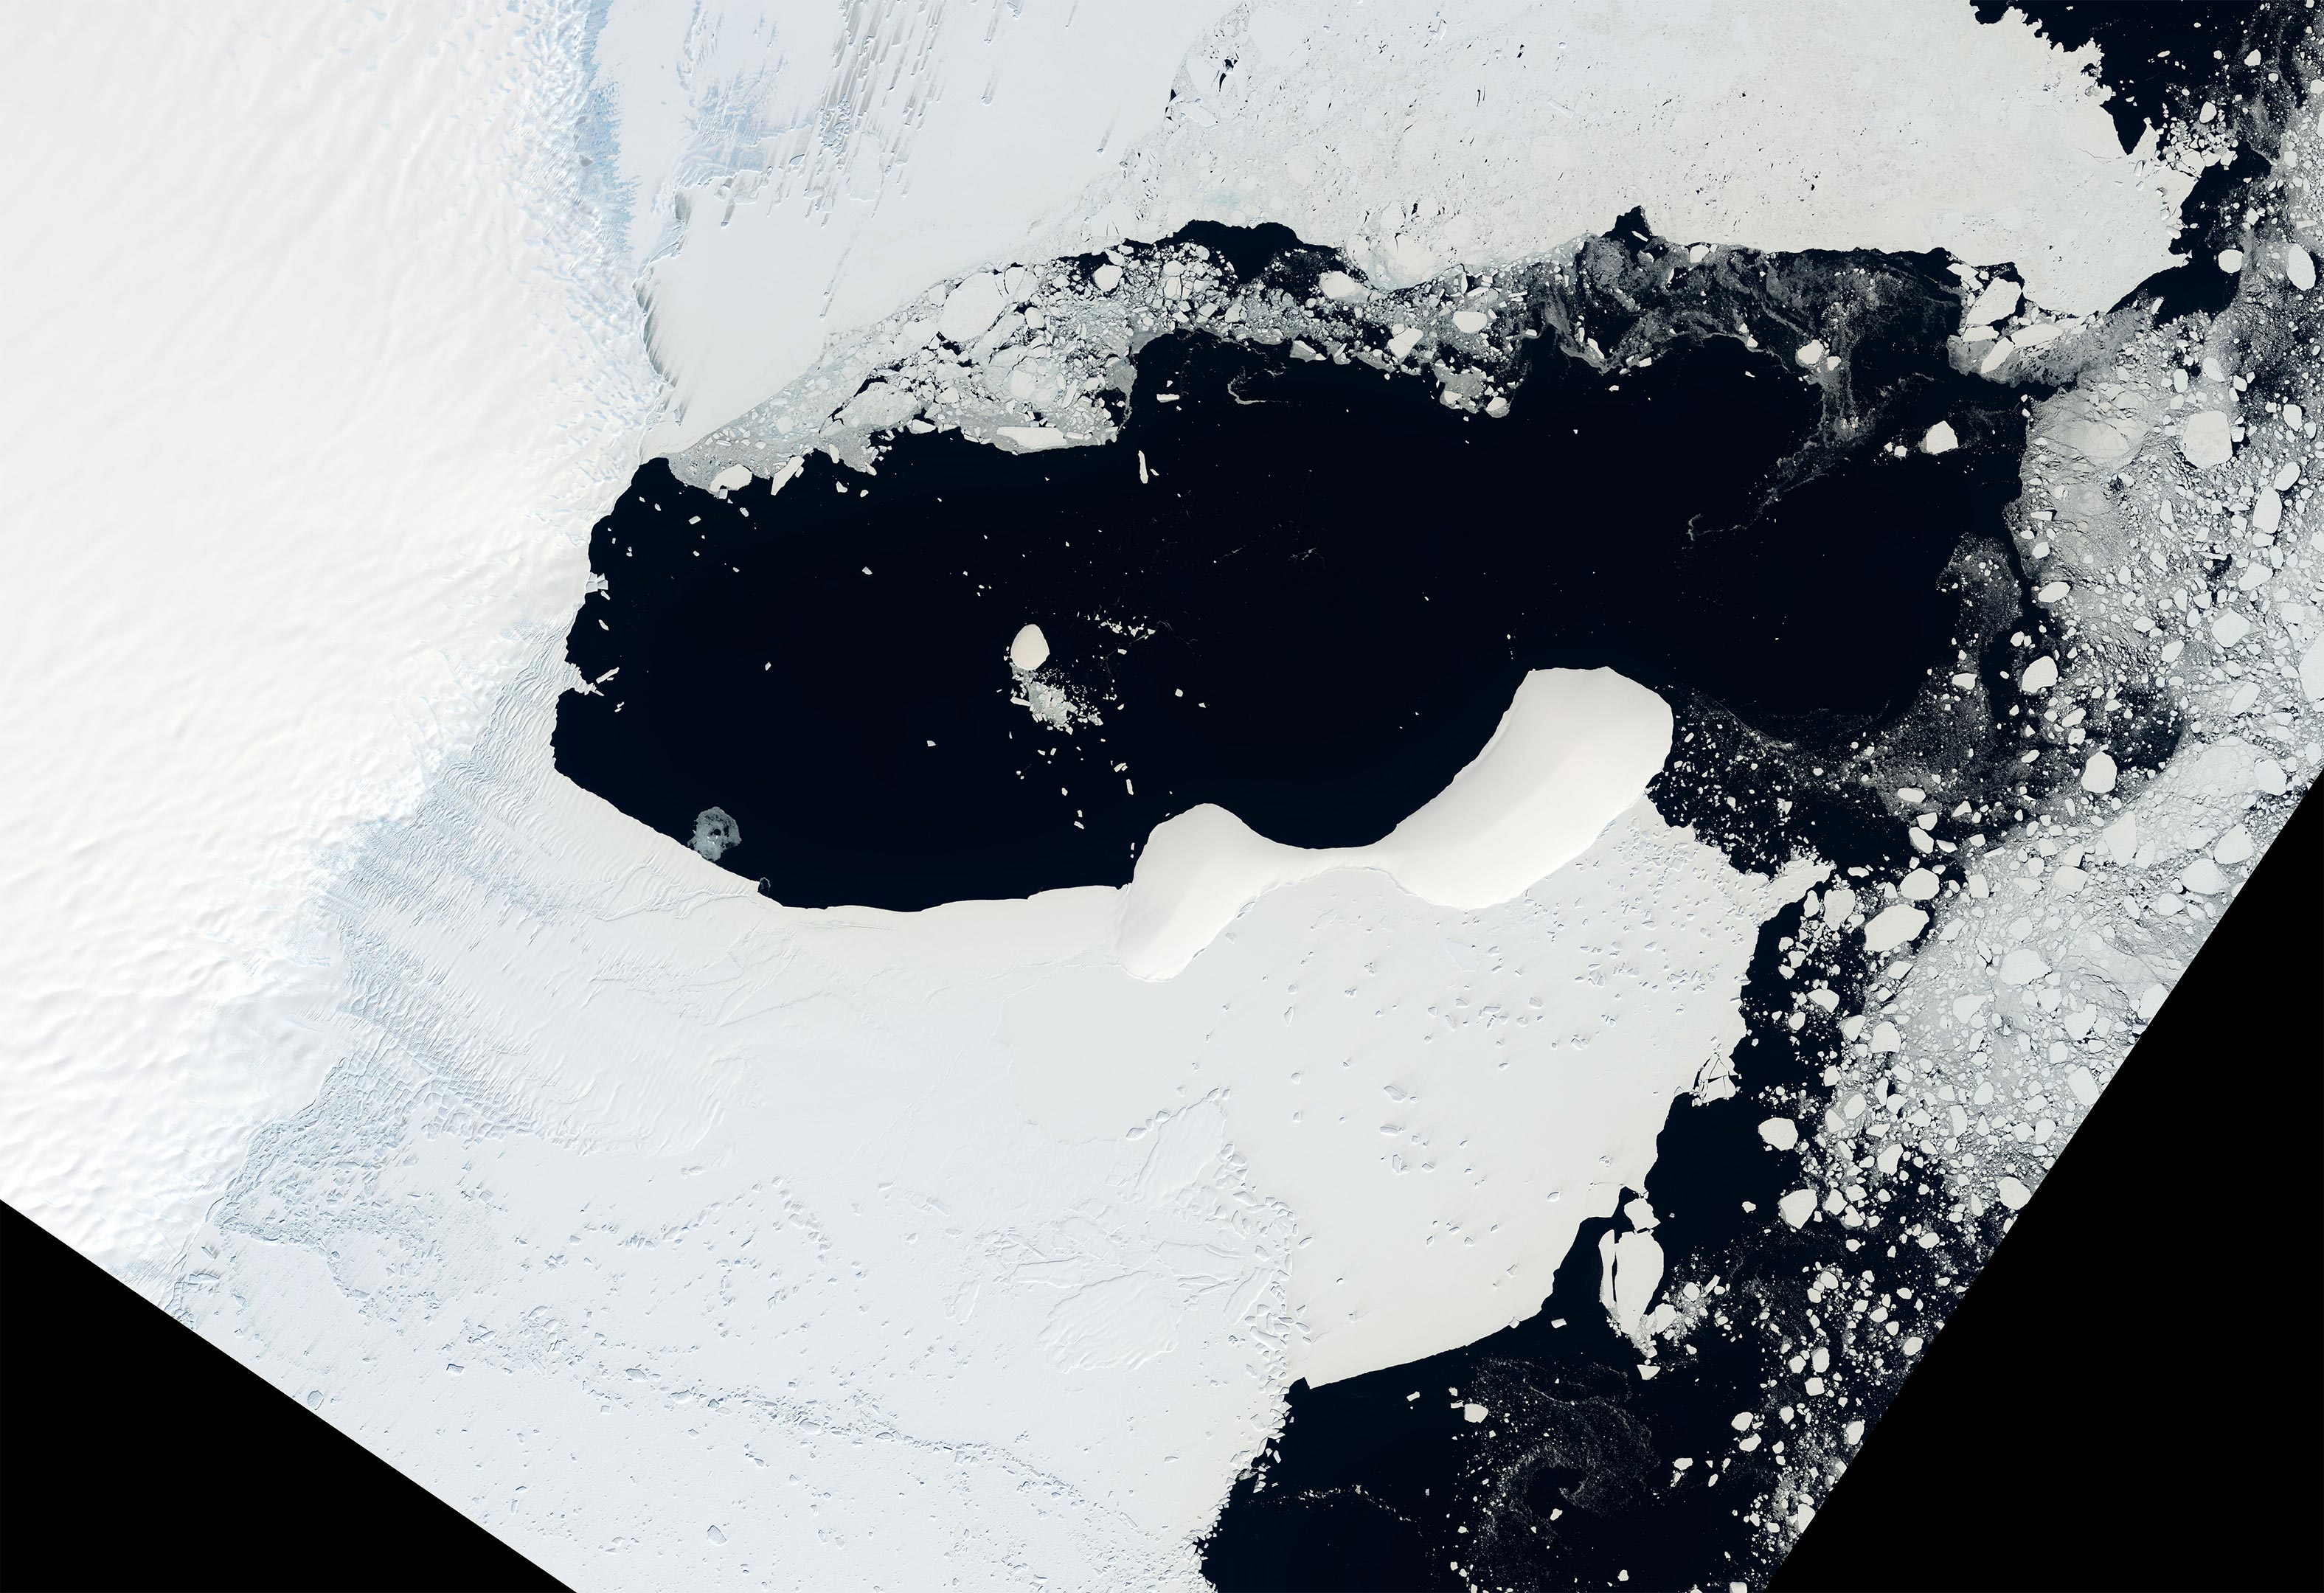
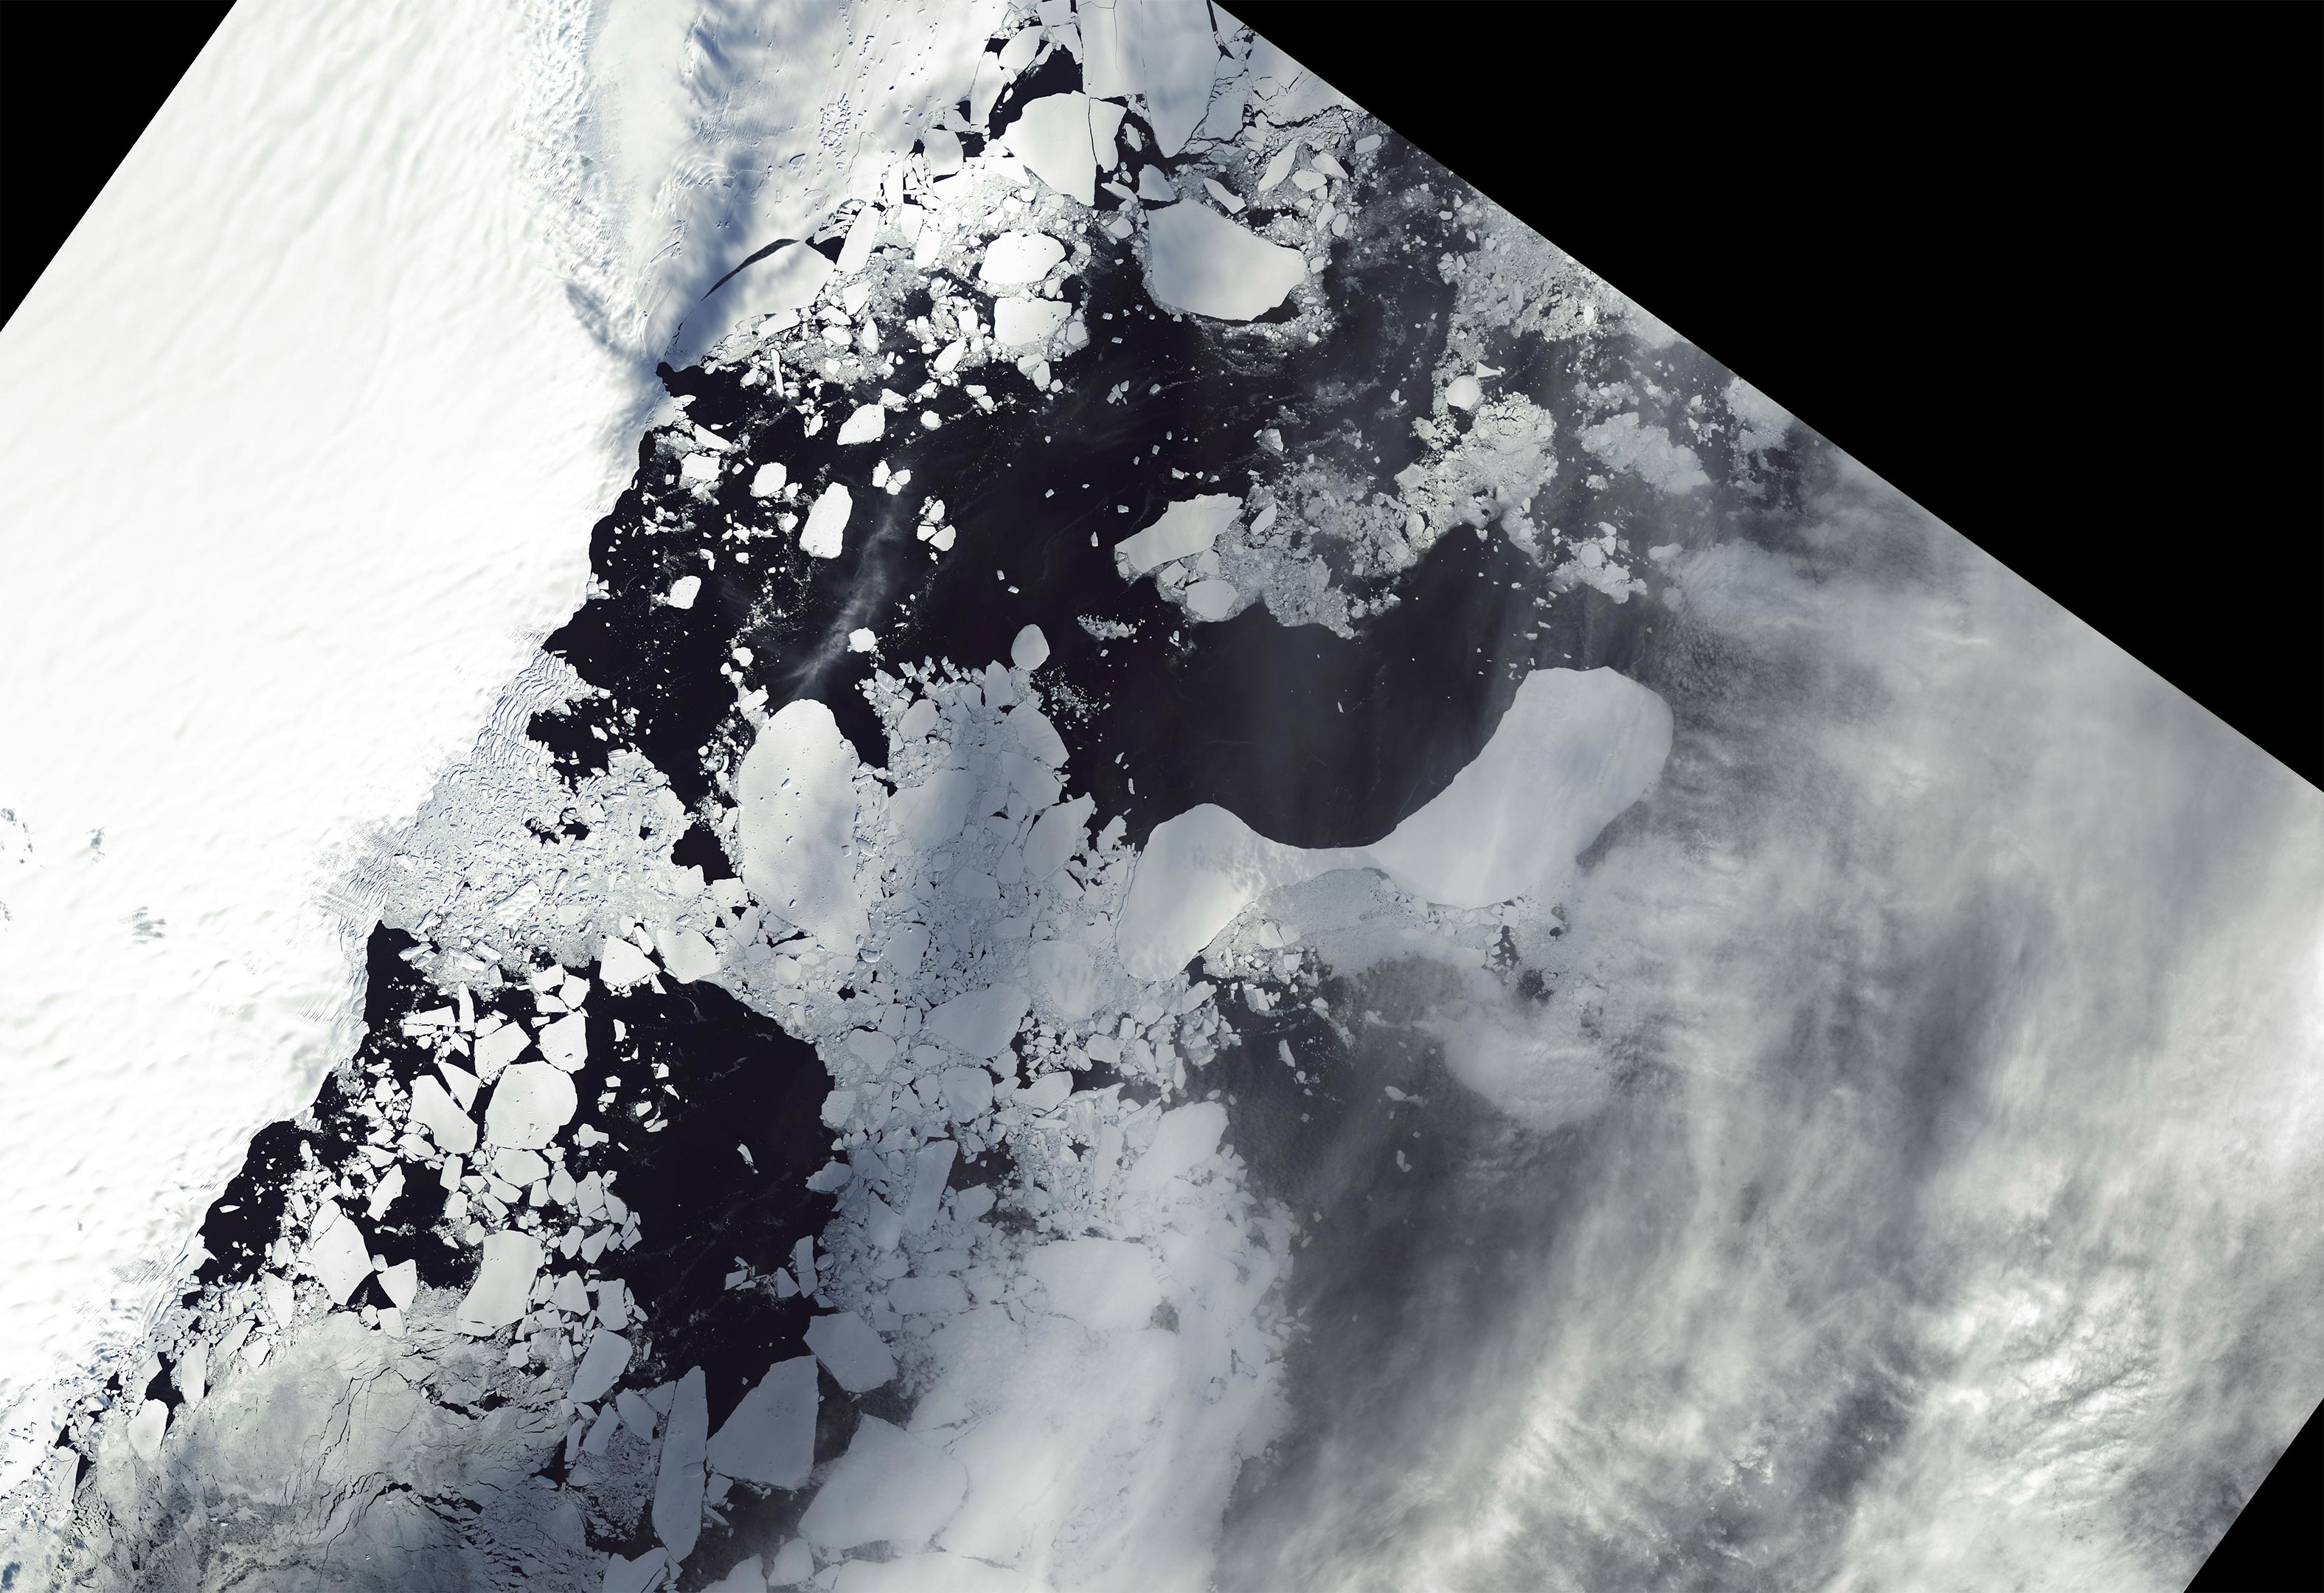
The change happened fast. At the start of March 2022, the floating shelf fed by the Glenzer and Conger glaciers was still intact. By the middle of the month, it had fallen apart. This image pair (above), acquired by the Operational Land Imager (OLI) on Landsat 8, shows the shelf before and after it disintegrated.
“The whole shelf collapsed in just around two weeks,” said Christopher Shuman, a University of Maryland, Baltimore County, glaciologist based at NASA’s Goddard Space Flight Center. The icy remnants of both glacial shelf ice and adjacent sea ice dispersed from the waters around Bowman Island within weeks. “All of this took less than a month,” Shuman said. “It was quite the blowout.”
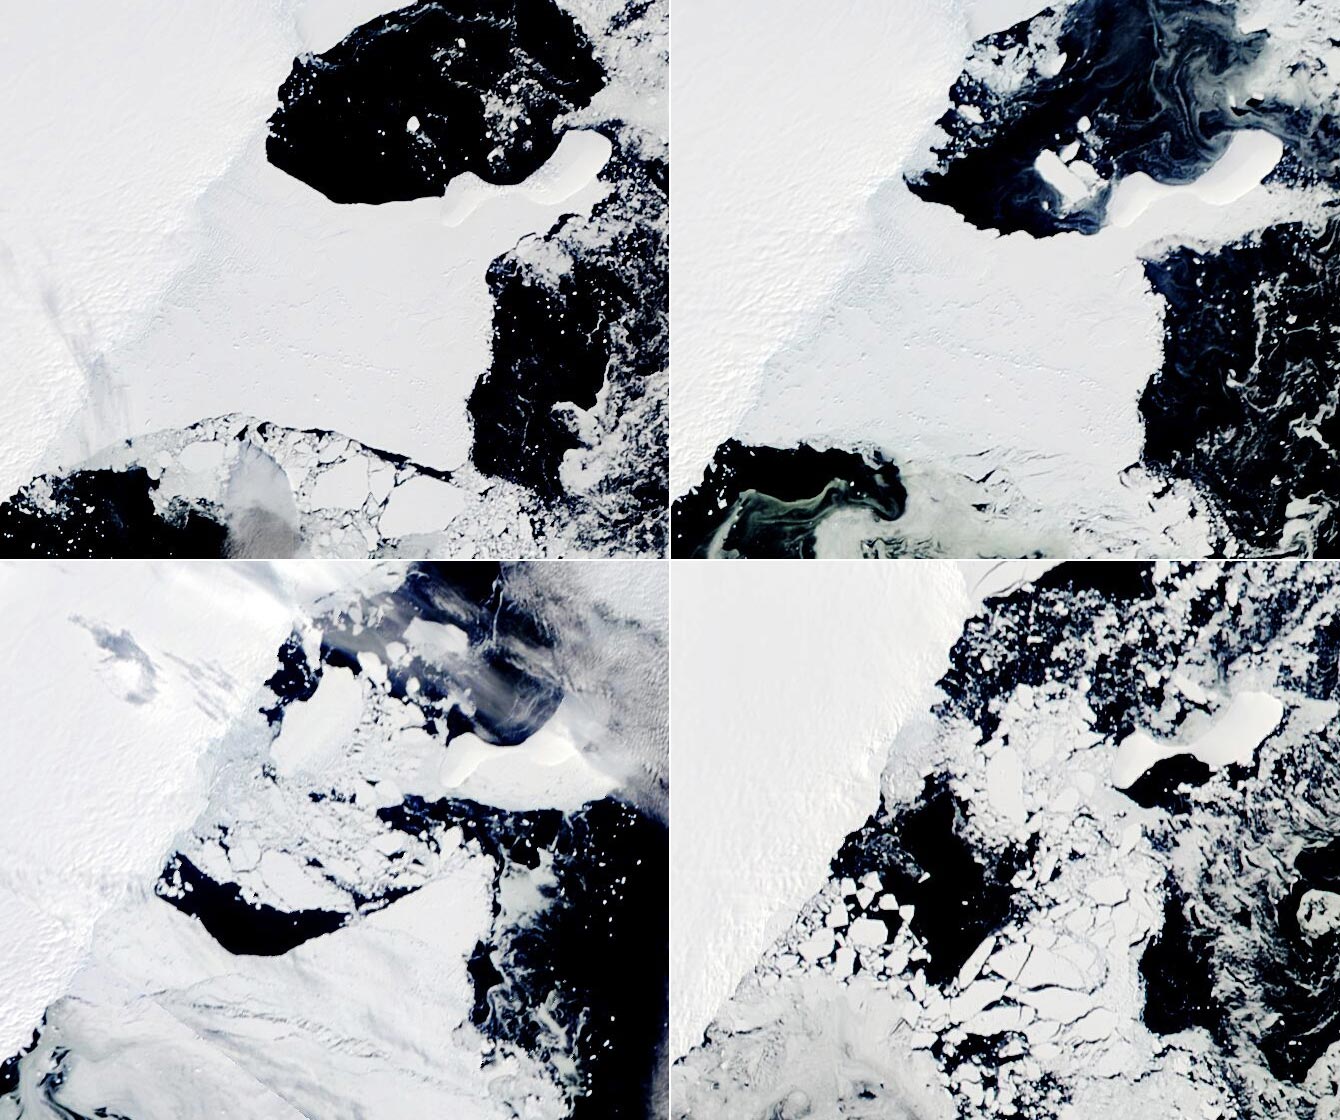
February 22 – March 21, 2022
The progression of the collapse is visible in the image series above. Images were acquired with the Moderate Resolution Imaging Spectroradiometer (MODIS) on NASA’s Terra and Aqua satellites.
The first image shows the ice shelf floating on the Mawson Sea on February 22, 2022, prior to the collapse. Fast ice—a type of sea ice that becomes “fastened” to the edges of ice shelves, coastlines, and icebergs—is also part of the mix. For two years prior to this image, the shelf was already in a state of decline. According to Catherine Walker of the Woods Hole Oceanographic Institution, the shelf was losing ice at an average rate of about 1 square kilometer per day through the natural process of iceberg calving.
But in early March 2022, the shelf in front of the Glenzer Glacier calved a substantial iceberg. Named C-37, the berg initially measured about 144 square kilometers (56 square miles). A few pieces broke off, such that C-37 measured about 81 square kilometers on March 12 when MODIS acquired the second image in the series. The substantial loss of ice meant the shelf disconnected from Bowman Island. (Note that some sea ice remained attached to the island.)
“Without being supported by a land anchor, the ice shelf was destabilized and primed to collapse,” said Jonathan Wille, a postdoctoral researcher at the Université Grenoble Alpes.
According to Wille, an atmospheric river on March 15 appears to have triggered the shelf’s final collapse. The weather system—which caused temperatures in eastern Antarctica to soar 40 degrees Celsius above normal—also enhanced ocean swells and amplified winds near the vulnerable shelf. This likely caused the ice in front of Conger Glacier to break apart and quickly disperse.
The third MODIS image above shows the area on March 16 after the final collapse. The event spawned Iceberg C-38, which at the time measured about 415 square kilometers (160 square miles). The final image in the series shows the crumbled shelf ice and fast ice as it dispersed in the sea on March 21.
The loss of an ice shelf is problematic because it can indirectly contribute to sea level rise. “Ice shelves are essentially the ‘safety band’ holding up the rest of the Antarctic Ice Sheet,” Walker said. When they collapse, the ice behind them can more quickly flow into the ocean. “And that is what raises sea levels.”
By Antarctic standards, the ice shelf and glaciers that it held back are relatively small, so the impacts from the collapse are expected to be minimal. Scientists are more concerned about the location of the collapse.
“All of the previous collapses have taken place in West Antarctica, not East Antarctica, which until recently has been thought of as relatively stable,” Walker said. “This is something like a dress rehearsal for what we could expect from other, more massive ice shelves if they continue to melt and destabilize. Then we’ll really be past the turnaround point in terms of slowing sea level rise.”
NASA Earth Observatory images by Lauren Dauphin, using Landsat data from the U.S. Geological Survey and MODIS data from NASA EOSDIS LANCE and GIBS/Worldview.
No comments:
Post a Comment