Solar Orbiter Spacecraft Captures the Full Sun in Unprecedented Detail
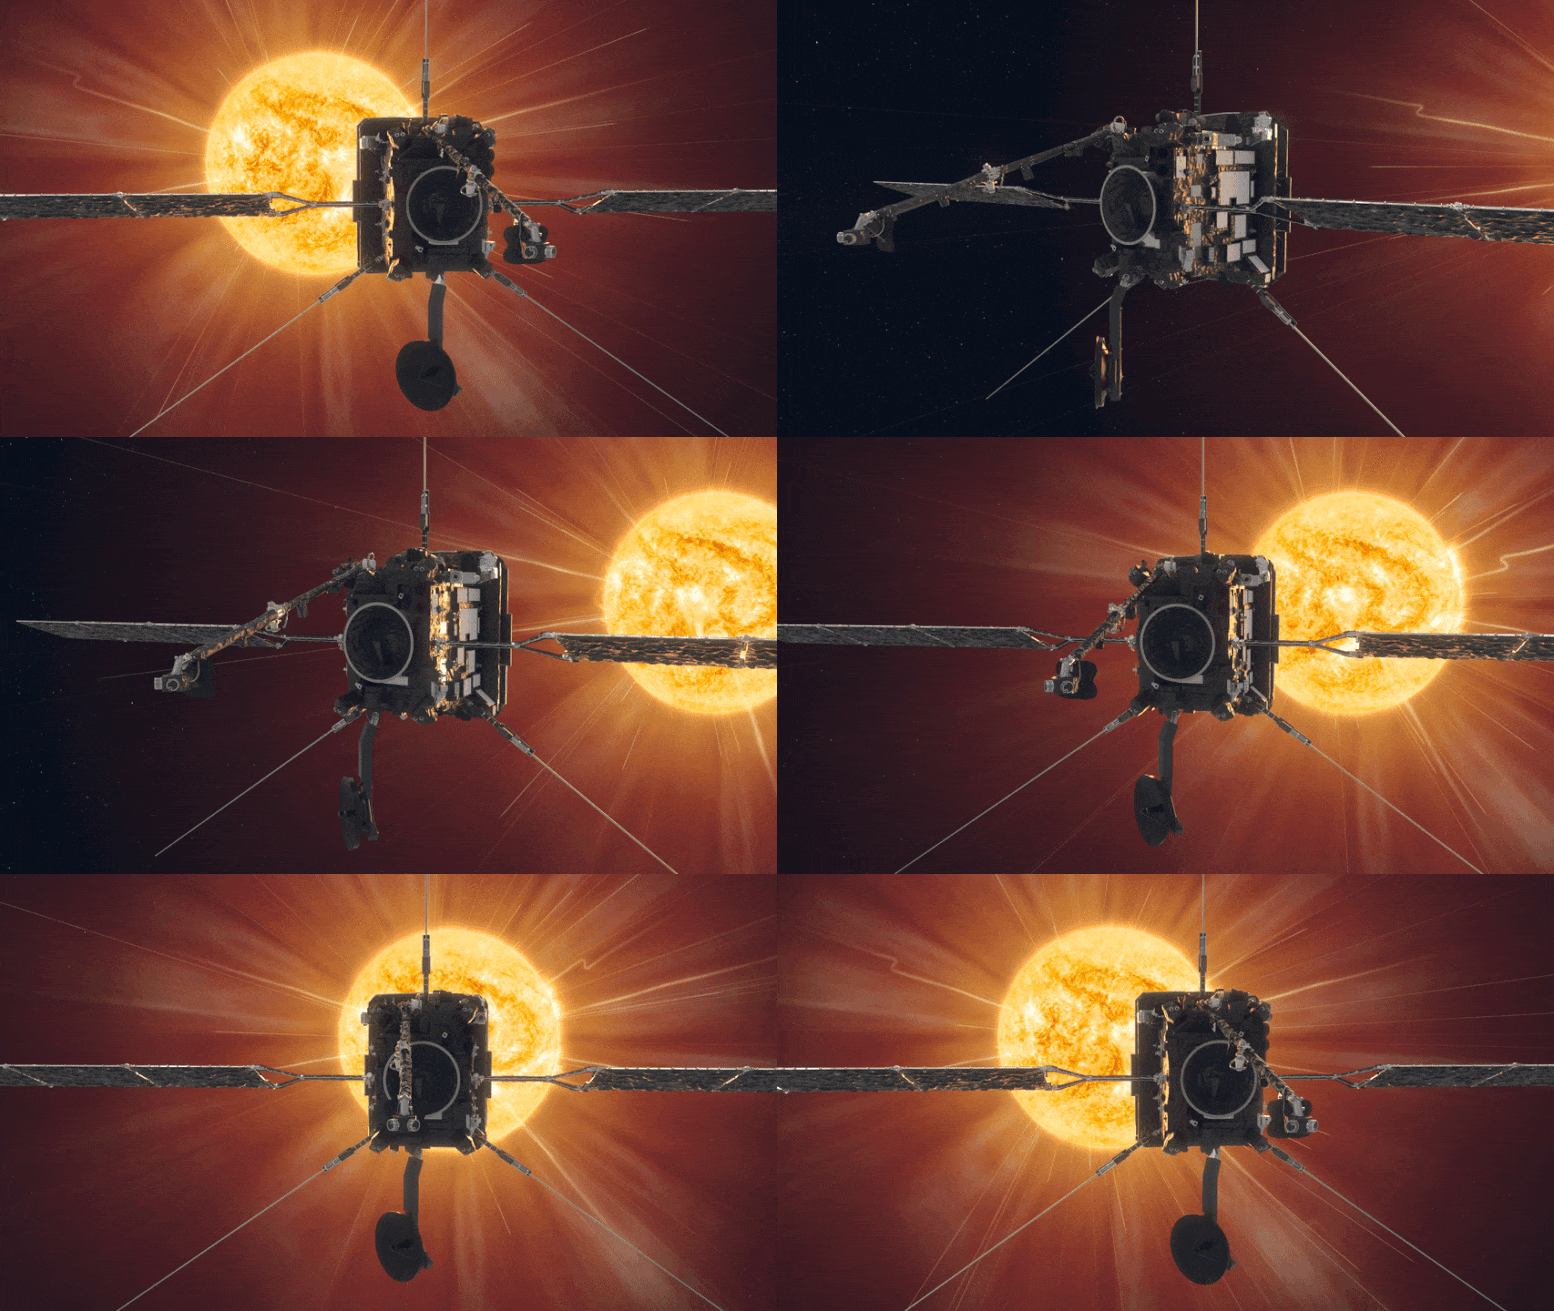
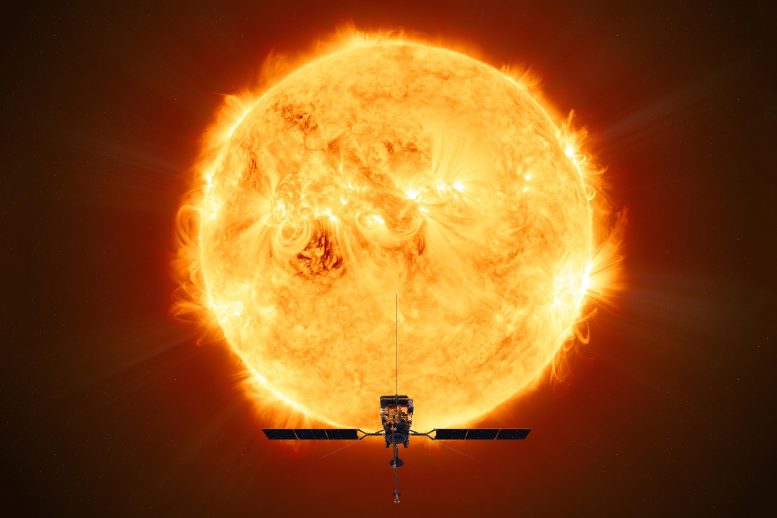
Animation of ESA’s Sun-explorer Solar Orbiter. Credit: ESA/Medialab
Solar Orbiter’s latest images shows the full Sun in unprecedented detail. They were taken on March 7, 2022, when the spacecraft was crossing directly between the Earth and Sun.
One of the images, taken by the Extreme Ultraviolet Imager (EUI) is the highest resolution image of the Sun’s full disc and outer atmosphere, the corona, ever taken.
Another image, taken by the Spectral Imaging of the Coronal Environment (SPICE) instrument represents the first full Sun image of its kind in 50 years, and by far the best one, taken at the Lyman-beta wavelength of ultraviolet light that is emitted by hydrogen gas.
The images were taken when Solar Orbiter was at a distance of roughly 75 million kilometers, half way between our world and its parent star. The high-resolution telescope of EUI takes pictures of such high spatial resolution that, at that close distance, a mosaic of 25 individual images is needed to cover the entire Sun. Taken one after the other, the full image was captured over a period of more than four hours because each tile takes about 10 minutes, including the time for the spacecraft to point from one segment to the next.
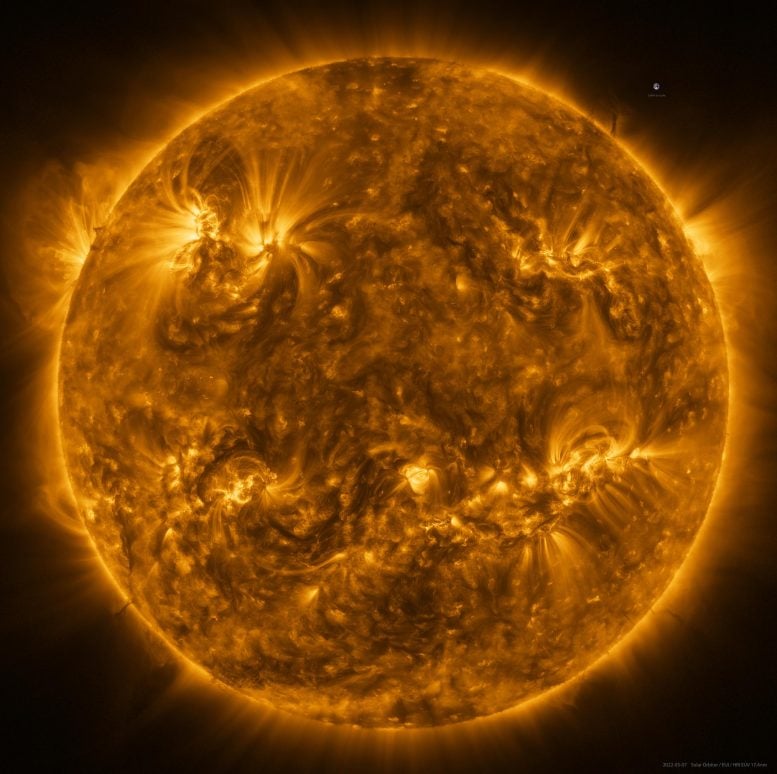
The Sun as seen by Solar Orbiter in extreme ultraviolet light from a distance of roughly 75 million kilometers. The image is a mosaic of 25 individual images taken on March 7, 2022, by the high resolution telescope of the Extreme Ultraviolet Imager (EUI) instrument. Taken at a wavelength of 17 nanometers, in the extreme ultraviolet region of the electromagnetic spectrum, this image reveals the Sun’s upper atmosphere, the corona, which has a temperature of around a million degrees Celsius. An image of Earth is also included for scale, at the 2 o’clock position. Credit: ESA & NASA/Solar Orbiter/EUI team; Data processing: E. Kraaikamp (ROB)
In total, the final image contains more than 83 million pixels in a 9148 x 9112 pixel grid. For comparison, this image has a resolution that is ten times better than what a 4K TV screen can display.
EUI images the Sun at a wavelength of 17 nanometers, in the extreme ultraviolet region of the electromagnetic spectrum. This reveals the Sun’s upper atmosphere, the corona, which has a temperature of around a million degrees Celsius.
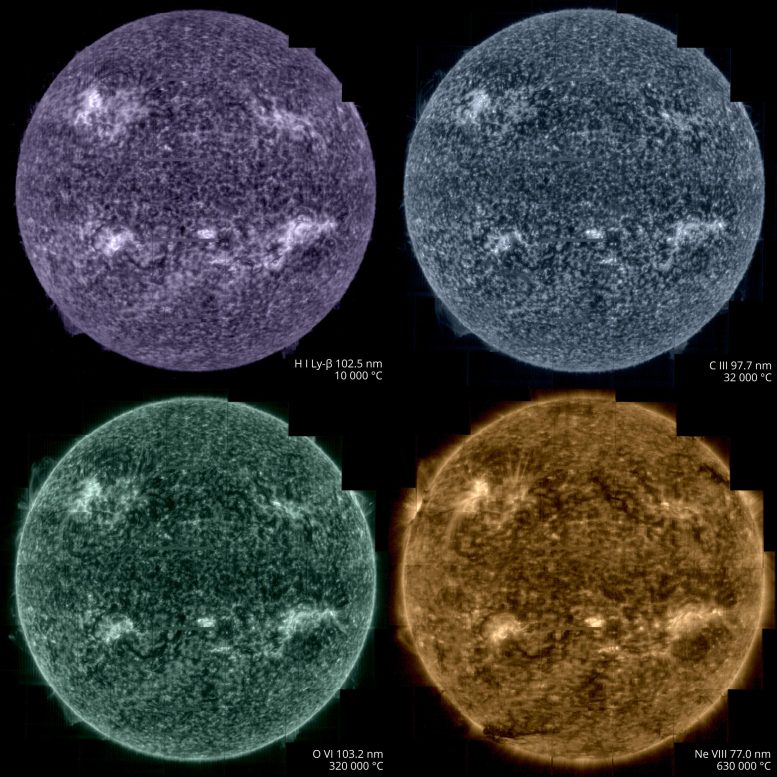
Solar Orbiter took images of the Sun on March 7, from a distance of roughly 75 million kilometres, using its Spectral Imaging of the Coronal Environment (SPICE) instrument. SPICE takes simultaneous “spectral images” at several different wavelengths of the extreme ultraviolet spectrum by scanning its spectrometer slit across a region on the Sun. The different wavelengths recorded correspond to different layers in the Sun’s lower atmosphere. Purple corresponds to hydrogen gas at a temperature of 10,000°C, blue to carbon at 32,000°C, green to oxygen at 320,000°C, yellow to neon at 630,000°C. Each full-Sun image is made up of a mosaic of 25 individual scans. It represents the best full Sun image taken at the Lyman beta wavelength of ultraviolet light that is emitted by hydrogen gas. Credit: ESA & NASA/Solar Orbiter/SPICE team; Data processing: G. Pelouze (IAS)
At the 2 o’clock (near the image of the Earth for scale) and 8 o’clock positions on the edges of the Sun, dark filaments can be seen projecting away from the surface. These ‘prominences’ are prone to erupt, throwing huge quantities of coronal gas into space and creating ‘space weather’ storms.
In addition to EUI, the SPICE instrument was also recording data during the crossing. These too needed to be pieced together as a mosaic.
SPICE is designed to trace the layers in the Sun’s atmosphere from the corona, down to a layer known as the chromosphere, getting closer to the surface. The instrument does this by looking at the different wavelengths of extreme ultraviolet light that come from different atoms.
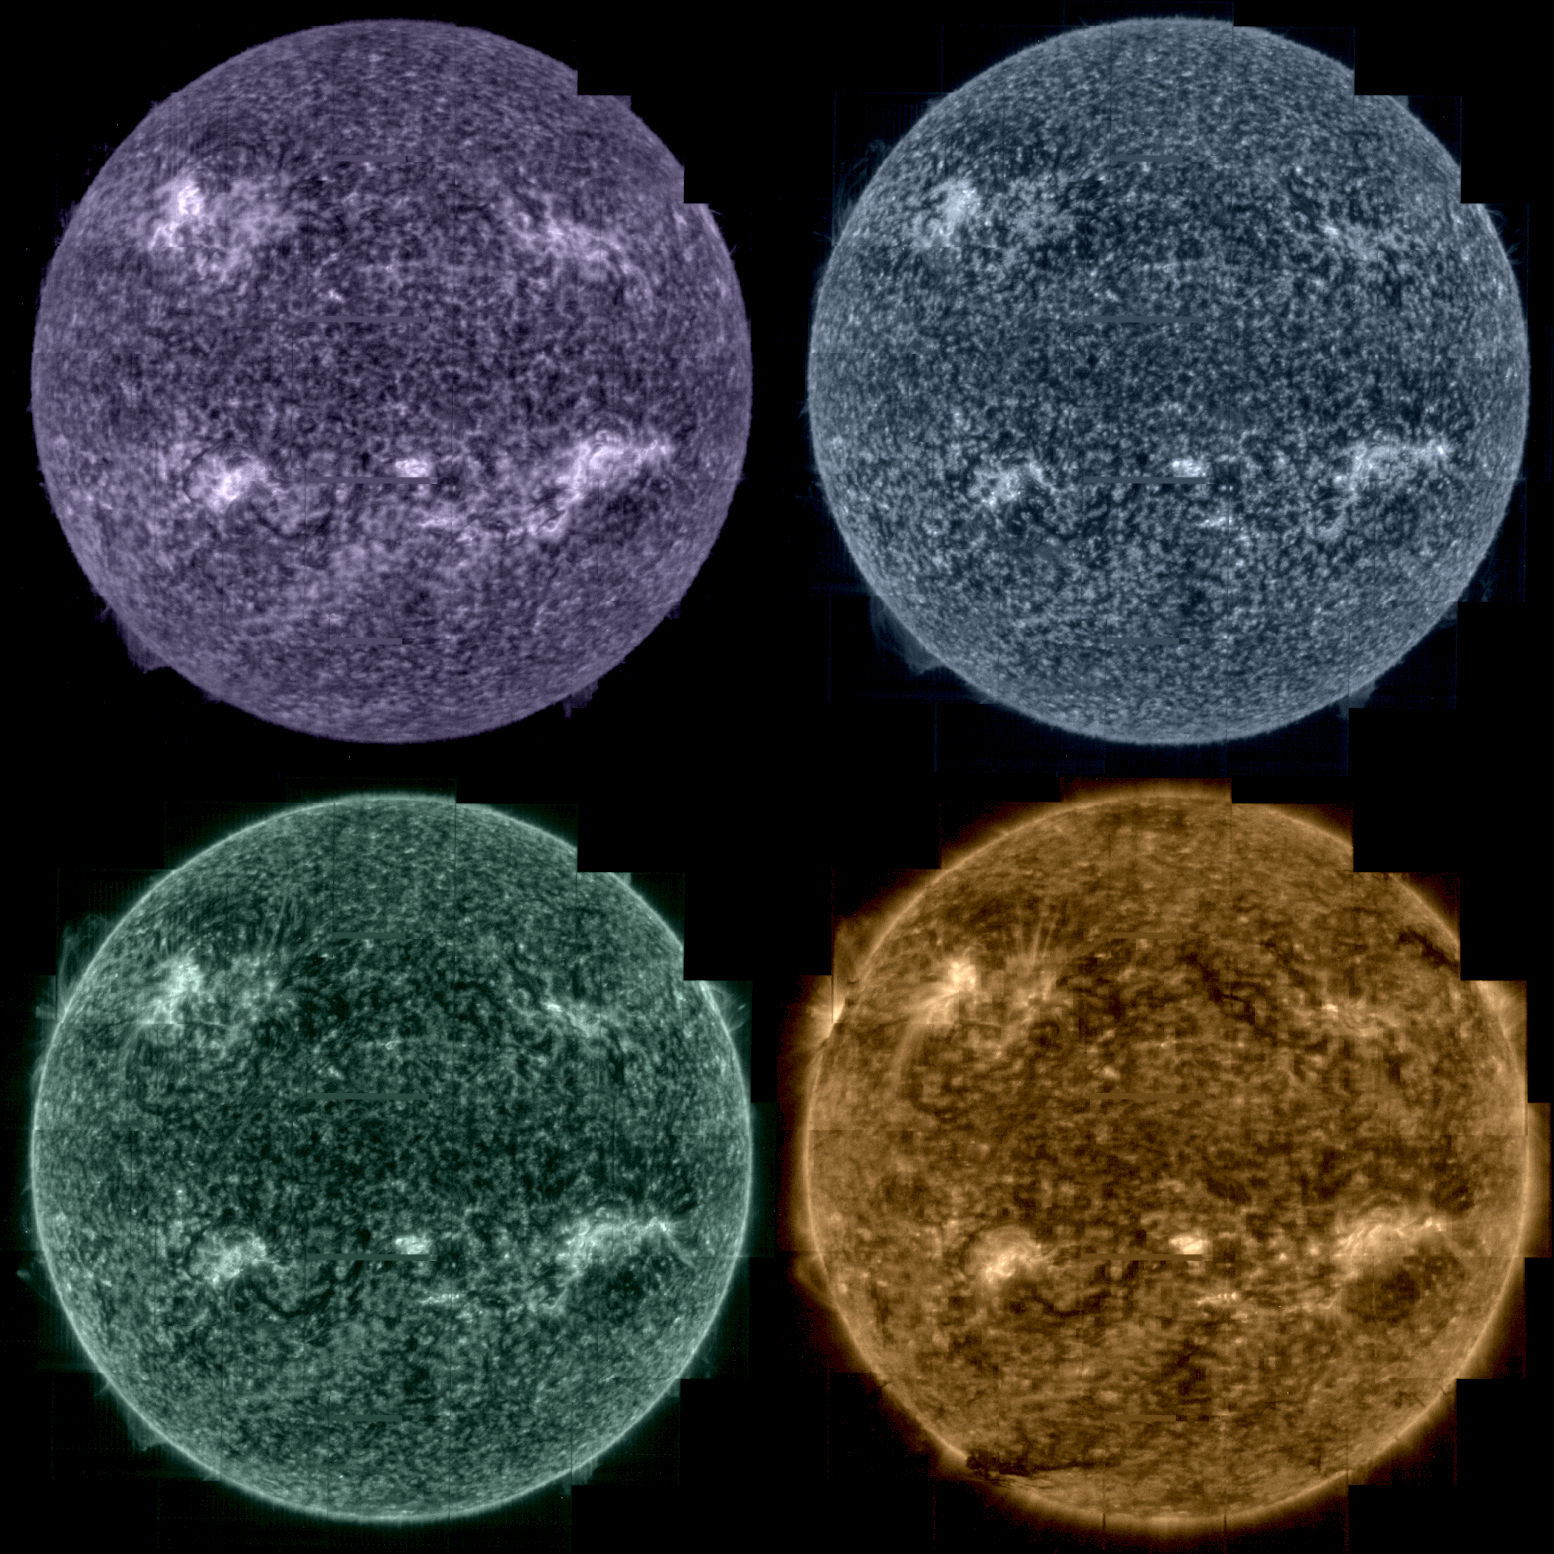
Taking the Sun’s temperature. Credit: ESA & NASA/Solar Orbiter/SPICE team; Data processing: G. Pelouze (IAS)
In the SPICE sequence of images purple corresponds to hydrogen gas at a temperature of 10,000°C, blue to carbon at 32,000°C, green to oxygen at 320,000°C, yellow to neon at 630,000°C.
This will allow solar physicists to trace the extraordinarily powerful eruptions that take place in the corona down through the lower atmospheric layers. It will also allow them to study one of the most puzzling observations about the Sun: how the temperature is rising through the ascending atmospheric layers.
Usually the temperature drops as you move away from a hot object. But above the Sun, the corona reaches a million degrees Celsius whereas the surface is only about 5000°C. Investigating this mystery is one of the key scientific objectives of Solar Orbiter.
The images were taken on 7 March, precisely when Solar Orbiter crossed the Sun-Earth line, so the images can be compared with Earth-bound solar instruments and cross-calibrated. This will make it easier to compare results from different instruments and observatories in future.
On March 26, Solar Orbiter reaches another mission milestone: its first close perihelion. The spacecraft is now inside the orbit of Mercury, the inner planet, taking the highest resolution images of the Sun it can take. It is also recording data on the solar wind of particles that flows outwards from the Sun.
And this is just the start, over the coming years the spacecraft will repeatedly fly this close to the Sun. It will also gradually raise its orientation to view the Sun’s previously unobserved polar regions.
Solar Orbiter is a space mission of international collaboration between ESA and NASA.
Solar Orbiter: Tracking Sunspots Up Close
The ESA/NASA Solar Orbiter spacecraft just made its historic first close pass of the Sun, which happened midday on March 26, 2022.
In the days leading up to and around ‘Perihelion passage’, teams at ESA worked intensively on an observation campaign, and all ten instruments will be operating simultaneously to gather as much data as possible.
This effort will include using its remote sensing instruments, like the Extreme Ultraviolet Imager to image the Sun, as well as in-situ instruments to measure the solar wind as it flows past the spacecraft.
Observing specific targets of scientific interest on the Sun requires close coordination between flight control teams and the flight dynamics experts at ESA’s ESOC mission control centre, in Germany, and teams at the science operations center at ESAC, in Spain.
ESA teams are using the full-disc telescopes on board Solar Orbiter to identify dynamic activity – like moving sunspots – on the surface, then will use these specific locations to calculate accurate pointing of the narrow-angle imager for later detailed observation.
Since the instruments are fixed in place to the spacecraft body, the entire spacecraft must be pointed with high precision to point to specific sunspots.
This cycle of using wide-angle images to select specific narrow-angle targets, then feeding the needed pointing back into flight control instructions takes place daily, with each iteration taking three days from initial imaging to uplink of new pointing instructions.
While such close coordination happens throughout the mission, the cycle is much speeded up during perihelion passage to ensure the best possible scientific value from ‘up close’ to the Sun.
Nearby Star Could Help Explain Sunspot Mystery That Has Baffled Scientists for 300 Years
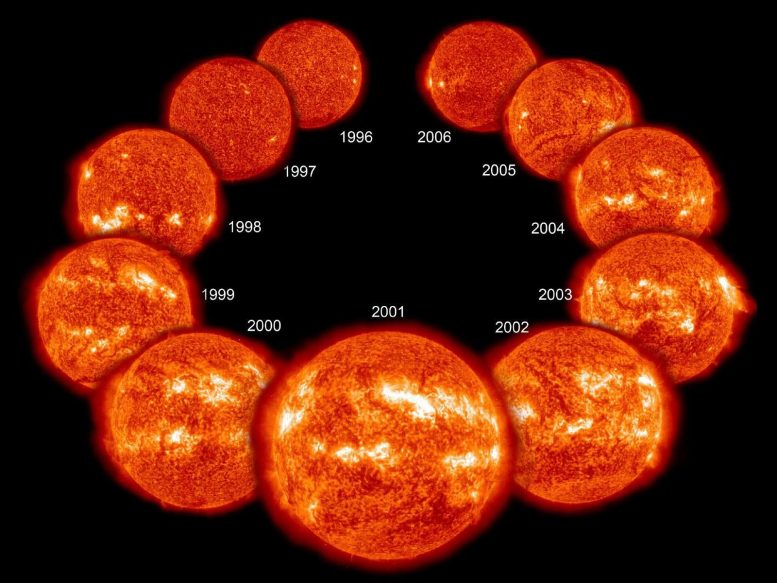
A new study has identified a nearby star whose sunspot cycles appear to have stopped. Studying this star might help explain the period from the mid 1600s to the early 1700s when our sun paused its sunspot cycles. This image depicts a typical 11-year cycle on the sun, with the fewest sunspots appearing at its minimum (top left and top right) and the most appearing at its maximum (center). Credit: NASA
The number of sunspots on our sun typically ebbs and flows in a predictable 11-year cycle, but one unusual 70-year period when sunspots were incredibly rare has mystified scientists for 300 years. Now a nearby sun-like star seems to have paused its own cycles and entered a similar period of rare starspots, according to a team of researchers at Penn State. Continuing to observe this star could help explain what happened to our own sun during this “Maunder Minimum” as well as lend insight into the sun’s stellar magnetic activity, which can interfere with satellites and global communications and possibly even affect climate on Earth.
The star — and a catalog of 5 decades of starspot activity of 58 other sun-like stars — is described in a new paper that appears online in the Astronomical Journal.
Starspots appear as a dark spot on a star’s surface due to temporary lower temperatures in the area resulting from the star’s dynamo — the process that creates its magnetic field. Astronomers have been documenting changes in starspot frequency on our sun since they were first observed by Galileo and other astronomers in the 1600s, so there is a good record of its 11-year cycle. The exception is the Maunder Minimum, which lasted from the mid-1600s to early 1700s and has perplexed astronomers ever since.
“We don’t really know what caused the Maunder Minimum, and we have been looking to other sun-like stars to see if they can offer some insight,” said Anna Baum, an undergraduate at Penn State at the time of the research and first author of the paper. “We have identified a star that we believe has entered a state similar to the Maunder Minimum. It will be really exciting to continue to observe this star during, and hopefully as it comes out of, this minimum, which could be extremely informative about the sun’s activity 300 years ago.”
The research team pulled data from multiple sources to stitch together 50 to 60 years of starspot data for 59 stars. This included data from the Mount Wilson Observatory HK Project — which was designed to study stellar surface activity and ran from 1966 to 1996 — and from planet searches at Keck Observatory which include this kind of data as part of their ongoing search for exoplanets from 1996 to 2020. The researchers compiled a database of stars that appeared in both sources and that had other readily available information that might help explain starspot activity. The team also made considerable efforts to standardize measurements from the different telescopes to be able to compare them directly and otherwise clean up the data.
The team identified or confirmed that 29 of these stars have starspot cycles by observing at least two full periods of cycles, which often last more than a decade. Some stars did not appear to have cycles at all, which could be because they are rotating too slowly to have a dynamo and are magnetically “dead” or because they are near the end of their lives. Several of the stars require further study to confirm whether they have a cycle.
“This continuous, more than 50-year time series allows us to see things that we never would have noticed from the 10-year snapshots that we were doing before,” said Jason Wright, professor of astronomy and astrophysics at Penn State and an author of the paper. “Excitingly, Anna has found a promising star that was cycling for decades but appears to have stopped.”
According to the researchers, the star — called HD 166620 — was estimated to have a cycle of about 17 years but has now entered a period of low activity and has shown no signs of starspots since 2003.

Sunspots were first observed in the 1600s by using a modified telescope called a helioscope. The instrument projects an image of the sun onto a surface, where dark sunspots can be observed. This illustration was produced by Christoph Scheiner in the 1600s for his book “Rosa Ursina sive Sol.” Credit: Christoph Scheiner
“When we first saw this data, we thought it must have been a mistake, that we pulled together data from two different stars or there was a typo in the catalog or the star was misidentified,” said Jacob Luhn, a graduate student at Penn State when the project began who is now at the University of California, Irvine. “But we double- and triple-checked everything. The times of observation were consistent with the coordinates we expected the star to have. And there aren’t that many bright stars in the sky that Mount Wilson observed. No matter how many times we checked, we always come to the conclusion that this star has simply stopped cycling.”
The researchers hope to continue studying this star throughout its minimum period and potentially as it comes out of its minimum and begins to cycle once again. This continued observation could provide important information about how the sun and stars like it generate their magnetic dynamos.
“There’s a big debate about what the Maunder Minimum was,” said Baum, who is now a doctoral student at Lehigh University studying stellar astronomy and asteroseismology. “Did the sun’s magnetic field basically turn off? Did it lose its dynamo? Or was it still cycling but at a very low level that didn’t produce many sunspots? We can’t go back in time to take measurements of what it was like, but if we can characterize the magnetic structure and magnetic field strength of this star, we might start to get some answers.”
A better understanding of the surface activity and magnetic field of the sun could have several important implications. For example, strong stellar activity can disable satellites and global communications, and one particularly strong solar storm disabled a power grid in Quebec in 1989. It has also been suggested that sunspot cycles may have a connection to climate on Earth. Additionally, the researchers said that information from this star could impact our search for planets beyond our solar system.
“Starspots and other forms of surface magnetic activity of stars interfere with our ability to detect the planets around them,” said Howard Isaacson, a research scientist at the University of California, Berkeley, and an author of the paper. “Improving our understanding of a star’s magnetic activity might help us improve our detection efforts.”
The curated database of the 59 stars and their starspot activity from this research has been made available for researchers to further investigate.
“This research is a great example of cross-generational astronomy, and how we continue to improve our understanding of the universe by building upon the many observations and dedicated research of astronomers that came before us,” said Wright. “I looked at starspot data from Mount Wilson and Keck Observatory for my thesis when I was a graduate student, Howard looked at starspot data from the California Planet Survey for his master’s thesis, and now Anna has stitched together all the data for a more comprehensive look across the years. We are all excited to continue studying this and other promising stars.”
Reference: “Five Decades of Chromospheric Activity in 59 Sun-like Stars and New Maunder Minimum Candidate HD 166620” by Anna C. Baum, Jason T. Wright, Jacob K. Luhn and Howard Isaacson, 22 March 2022, Astronomical Journal.
DOI: 10.3847/1538-3881/ac5683
Researchers discover a mysterious, new type of wave in the Sun whose speed defies explanation
Researchers from NYU Abu Dhabi's (NYUAD) Center for Space Science have discovered a new set of waves in the Sun that, unexpectedly, appear to travel much faster than predicted by theory.
In the study, "Discovery of high-frequency-retrograde vorticity waves in the Sun," published in the journal Nature Astronomy, the researchers -- led by Research Associate Chris S. Hanson -- detailed how they analyzed 25 years of space and ground-based data to detect these waves. The high-frequency retrograde (HFR) waves -- which move in the opposite direction of the Sun's rotation -- appear as a pattern of vortices (swirling motions) on the surface of the Sun and move at three times the speed established by current theory.
The interior of the Sun and stars cannot be imaged by conventional astronomy (e.g. optical, x-ray etc.), and scientists rely on interpreting the surface signatures of a variety of waves to image the interiors. These new HFR waves may yet be an important puzzle piece in our understanding of stars.
Complex interactions between other well known waves and magnetism, gravity or convection could drive the HFR waves at this speed. "If the HFR waves could be attributed to any of these three processes, then the finding would have answered some open questions we still have about the Sun," said Hanson. "However, these new waves don't appear to be a result of these processes, and that's exciting because it leads to a whole new set of questions."
This research was conducted within NYUAD's Center for Space Science in collaboration with the Tata Institute of Fundamental Research (TIFR) and New York University, using NYUAD and TIFR's computational resources. By studying the Sun's interior dynamics -- through the use of waves -- scientists can better appreciate the Sun's potential impact on the Earth and other planets in our solar system.
"The very existence of HFR modes and their origin is a true mystery and may allude to exciting physics at play," said Shravan Hanasoge, a co-author of the paper. "It has the potential to shed insight on the otherwise unobservable interior of the Sun."
Journal Reference:
Chris S. Hanson, Shravan Hanasoge, Katepalli R. Sreenivasan. Discovery of high-frequency retrograde vorticity waves in the Sun. Nature Astronomy, 2022; DOI: 10.1038/s41550-022-01632-z
No comments:
Post a Comment