To ensure a safe and just future for people, nature and the planet, Earth System Boundaries must include justice, researchers find
Peer-Reviewed PublicationIMAGE: THE FIGURE SHOWS THE JUSTICE QUESTIONS IN RELATION TO ONE EARTH SYSTEM DOMAIN. ESJ FOCUSES ON THE JUSTICE ISSUES WITH RESPECT TO ENDS (BOUNDARIES, ACCESS TO MINIMUM RESOURCES) AND MEANS (THE ALLOCATION OF REMAINING RESOURCES, RISKS AND RESPONSIBILITIES). view more
CREDIT: LISA JACOBSON AND PAOLA FEZZIGNA
In a new study published in Nature Sustainability an international team of scientists from the Earth Commission, convened by Future Earth, investigates how global biophysical boundaries need to be adjusted to ensure a safe and just future for people, nature and the planet. The Earth Commission is the scientific cornerstone of the Global Commons Alliance
This new framework integrates methods to reduce harm to people, increase access to resources, address tradeoffs, and challenge powerful interests whilst addressing inequality between generations and between humans and nature within discussions on Earth system boundaries.
“These topics still require debates and engagement with different knowledge systems - to meet the principles of procedural and recognition justice - on the structural and systemic changes that are needed to ensure a more just resource consumption so that the needs of all people can be met whilst ensuring justice between species and a stable Earth system”, lead author Joyeeta Gupta, Co-Chair of the Earth Commission and Professor of Environment and Development in the Global South at the University of Amsterdam, explained.
The research comes ahead of an associated Earth Commission report due out in early 2023 that defines ‘safe and just’ ‘Earth System Boundaries’ (ESBs) to safeguard a stable and resilient planet. These ESBs will underpin the setting of new science-based targets for businesses, cities and governments to address the polycrises of: increasing human exposure to the climate emergency, biodiversity decline, mass extinction of species that threaten the stability of the planet.
In the paper, researchers argue that Earth System Boundaries must not only ensure the stability of the planet but also protect humans and other species from significant harm. This might require more stringent targets; however, such stringent targets may also influence the access of people to basic resources and the allocation of resources. Building on the scholarship on justice, they define the concept of Earth system justice, offering a theoretical framework for Earth system justice, operationalizing it and additionally outlining the transformations required to do so. This entails substantive and procedural justice where substantive justice aims at ensuring access to minimum resources, reducing harm, and allocating responsibilities fairly. Procedural justice implies that people should be able to access information, participate in decision making, enjoy civic space and the right to go to courts. Adjusting biophysical targets to ensure that the poor have access to resources and the vulnerable are protected from harm is needed.
“While it is important to establish boundaries for climate change, biodiversity, water, and pollution that ensure a stable and safe earth system we also need to consider how such boundaries can also be just in minimizing harm to humans and nature. This includes avoiding tradeoffs, and ensuring that we meet the goals of sustainable development in ensuring that everyone has access to the energy, food, water and other resources for a dignified life”, said Diana Liverman, Earth Commissioner and Regents professor at the University of Arizona.
“We need to assess who is most responsible for Earth system change, who is most vulnerable to it, and who should take action to reduce the risks and reallocate resources, responses and risks in line with principles of justice”, she added.
At the core of Earth System Justice the researchers consider the need for justice among present nations, communities and individuals (Intragenerational Justice), justice for future generations (Intergenerational justice) and for other living things and Earth system stability (‘Interspecies Justice and Earth system stability’). To operationalise the framework, they evaluate if safe (ecological and physical) Earth system boundaries reduce harm to the most vulnerable while ensuring 'just access’ to food, water, energy and infrastructure.
The authors argue that if we are to achieve truly just and sustainable futures, we need to grapple with what Earth system justice means and how it can be put into practice. This will ensure that historical and present injustices are addressed and not continuously postponed or reproduced. The authors conclude that living within planetary limits must include attention to justice.
- ENDS -
CAPTION
Note: This figure presents the elements of ESJ in terms of concepts (ideal, recognition and epistemic), the subjects of justice (Interspecies & Earth system stability, Intergenerational and Intragenerational justice), and includes procedural justice (access to information, decision-making, civic space and courts), and substantive justice operationalized as ends that include targets that reduce exposure to significant harm and access to resources/services and equitable allocation of resources, risks/harm and responsibilities. Equitable access and allocation within safe and just ESBs is difficult without just means (levers of transformation) which includes addressing the drivers of ecological degradation/vulnerability, liability for harm caused, setting minimum needs and maximum consumption levels and revisiting allocation mechanisms.
CREDIT
Lisa Jacobson and Paola Fezzigna
Figure 3. Mapping exposure to harm from air pollution 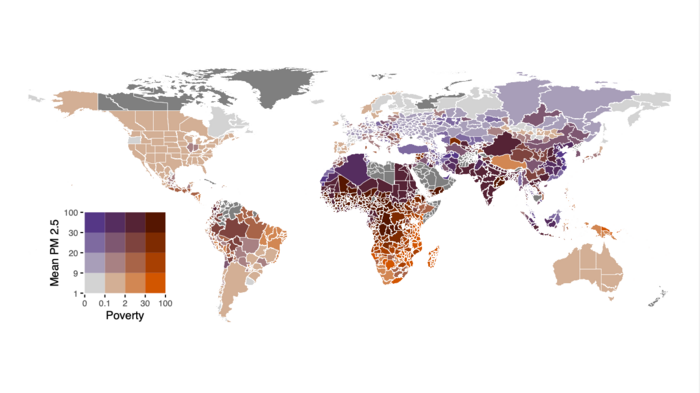
Note: The exposure to air pollution (PM 2.5) combined with poverty shows how local boundaries are crossed and how local people may be affected
CREDIT
Lisa Jacobson and Paola Fezzigna
Note: In an unequal world, providing the poor access to minimum needs leads to further crossing the boundaries (see figure 1). Hence, we propose to reserve a certain minimum access level for all people. This provides the foundation for a corridor. The ceiling of the corridor is the safe and just boundary.
CREDIT
Lisa Jacobson and Paola Fezzigna
JOURNAL
Nature Sustainability
ARTICLE TITLE
Earth System Justice needed to identify and live within Earth System Boundaries
ARTICLE PUBLICATION DATE
2-Mar-2023