Sunday, January 31, 2021


North America

Donald Trump's donor reportedly funded Capitol riot rally


A pro-Trump mob stormed the Capitol, breaking 
windows and clashing with police officers. Source: Getty Images

The Wall Street Journal has identified a prominent Donald Trump campaign donor as having helped fund the rally preceding the storming of the US Capitol.

An heiress to supermarket chain Publix reportedly donated about $US300,000 ($A390,000) to fund a rally that preceded the deadly storming of the US Capitol by supporters of former US president Donald Trump.

The Wall Street Journal said on Saturday the funding from Julie Jenkins Fancelli, a prominent donor to Mr Trump's 2020 campaign, was facilitated by far-right show host Alex Jones.


It said her money paid for the lion's share of the roughly $US500,000 rally at the Ellipse park where Mr Trump spoke and urged supporters to "to fight".

More than 135 people have been arrested in connection with the 6 January attack on the Capitol as Congress met to certify Democrat Joe Biden's victory in the November election.

Five people including a Capitol Police officer died.

READ MORE

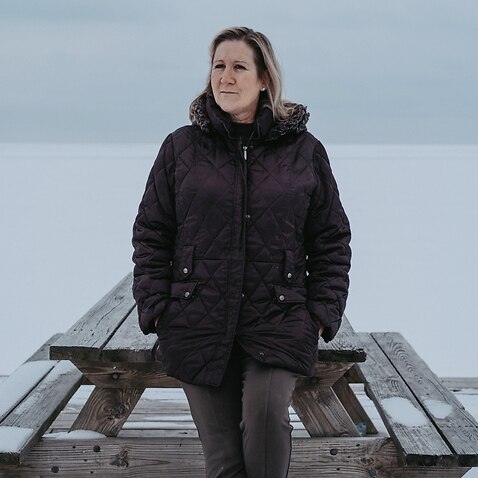
'Donald Trump just used us and our fear':
 One woman's journey out of QAnon


According to the Journal, Mr Jones personally pledged more than $US50,000 ($A65,000) in seed money for the rally in exchange for a speaking slot of his choice.

Mr Jones, who has publicised discredited conspiracy theories, has hosted leaders of the Proud Boys and the Oath Keepers, two extremist groups prominent at the riot, on his popular radio and internet video shows, it said.

Mr Jones did not immediately respond to a request for comment. Ms Fancelli could not immediately be reached.

Meanwhile, Publix Super Markets said in a Twitter post the violence at the Capitol on 6 January was a national tragedy.


"The deplorable actions that occurred that day do not represent the values, work or opinions of Publix Super Markets.

"Mrs Fancelli is not an employee of Publix Super Markets and is neither involved in our business operations, nor does she represent the company in any way. We cannot comment on Mrs. Fancelli's actions."

Hurricanes and typhoons moving 30km closer to coasts every decade

IMPERIAL COLLEGE LONDON

Research News

High-intensity tropical cyclones have been moving closer to coasts over the past 40 years, potentially causing more destruction than before.

The trend of tropical cyclones - commonly known as hurricanes or typhoons - increasingly moving towards coasts over the past 40 years appears to be driven by a westward shift in their tracks, say the study's authors from Imperial College London.

While the underlying mechanisms are not clear, the team say it could be connected to changes in tropical atmospheric patterns possibly caused by climate change. The research is published today in Science.

Globally, 80 to 100 cyclones develop over tropical oceans each year, impacting regions in the Pacific, Atlantic and Indian Oceans and causing billions of dollars of damage.

Lead author Dr Shuai Wang, from the Department of Physics at Imperial, said: "Tropical cyclones are some of the most devastating natural hazards in terms of how destructive and frequent they are in coastal regions.

"Our study shows they are likely becoming more destructive as they spend more time along coastlines at their highest intensities. The risk to some coastal communities around the world may be increasing and that will have profound implications over the coming decades."

The team analysed global data from 1982-2018 on tropical cyclone formation, movement and intensity mainly gathered from satellite observations. They found that at maximum intensity, cyclones were on average getting 30km closer to coastlines per decade. There were also on average two more cyclones per decade within 200km of land.

These increases did not necessarily mean more cyclones made landfall (reached land). However, the 'near-misses' or 'indirect-hit' cyclones near coasts can still cause damage, such as Hurricane Sandy in 2012 and Hurricane Dorian in 2019, both of which skirted along the US coast for a considerable time before making landfall.

The paper's other author, Professor Ralf Toumi from the Department of Physics and Co-Director of the Grantham Institute - Climate Change and Environment at Imperial, said: "We need to understand all aspects of tropical cyclones and this new study shows how their locations are changing. This often gets less attention than changes in their intensity but is at least as important."

Previously, studies have shown that the maximum intensity of tropical cyclones is found further towards the poles. However, this does not necessarily mean these more poleward storms are more devastating. The new findings show cyclones at maximum intensity are also migrating westward, bringing them closer to coastlines and increasing their potential for damage.

The westward migration appears to be driven by anomalous 'steering' - the underlying flow in the atmosphere that carries cyclones along their tracks. The exact mechanism for this enhanced westward steering is unknown, but it may be due to the same underlying mechanism for poleward migration of cyclones as rising temperatures cause atmospheric patterns to shift.

The team will next use climate simulations to determine the underlying mechanism behind these historical shifts and project potential future shifts in tropical cyclone tracks towards global coastal regions.

###

Methane emissions from coal mines are higher than previously thought

More of the powerful greenhouse gas is coming from deeper and abandoned mines

DOE/PACIFIC NORTHWEST NATIONAL LABORATORY

Research News

COLLEGE PARK, Md.--The amount of methane released into the atmosphere as a result of coal mining is likely much higher than previously calculated, according to research presented at the annual meeting of the American Geophysical Union recently.

The study estimates that methane emissions from coal mines are approximately 50 percent higher than previously estimated. The research was done by a team at the U.S. Department of Energy's Pacific Northwest National Laboratory, the U.S. Environmental Protection Agency and others.

The higher estimate is due mainly to two factors: methane that continues to be emitted from thousands of abandoned mines and the higher methane content in coal seams that are ever deeper, according to chief author Nazar Kholod of PNNL.

The results have important implications for Earth's climate because methane is about 25 times more powerful than carbon dioxide when it comes to warming the planet over a long period. In addition to coal mining, other major sources of methane emissions globally include wetlands, agriculture, and oil and gas facilities.

The study is one of the first to account for methane leaking from old, abandoned mines. Kholod said that when a closed mine is flooded, water stops methane from leaking almost completely within about seven years. But when an abandoned mine is closed without flooding, as many are, methane leaks into the air for decades.

Methane emissions are a constant concern at coal mines, which vent the gas as it's emitted when coal seams are disturbed. While methane produced in some industries is captured and used to create additional energy, it's more difficult to capture from coal mines, where the gas typically makes up a tiny fraction of the overall air stream.

Globally, coal mining is decreasing in the United States and Europe but increasing rapidly in other parts of the world, such as southeast Asia and India. The authors point out that less coal production doesn't translate to less methane.

"As more coal mines close, the share of coal mines that have been abandoned but are still emitting methane will increase," said Kholod. He is a scientist at the Joint Global Change Research Institute, a partnership between PNNL and the University of Maryland where researchers explore the interactions between human, energy and environmental systems.

More methane from deeper and defunct mines

The research team analyzed 250 coal samples from around the world, including North America, South America, Australia, Asia and Europe. The team found that coal from depths greater than 400 meters--depths many new mines reach--contains more than twice as much methane as coal mined at depths less than 200 meters. Mines are getting deeper every year.

The study is the first to attempt to account for methane escaping from abandoned mines. The reason is straightforward, Kholod said: Good data sets are hard to come by. His paper drew largely on data from the United States and Ukraine, countries where data about coal mine status and methane is fully available. In the United States in 2015, about one-third of abandoned mines were flooded. Ukraine reported that all its mines abandoned that year were flooded.

The team estimated that in 2010, 103 billion cubic meters of methane were released from working underground and surface mines and an additional 22 billion cubic meters from abandoned mines. That total of 125 billion cubic meters for 2010 is 50 percent higher than the estimate of 83 billion cubic meters for that year by the Community Emissions Data System, a highly regarded system developed by PNNL researchers and collaborators used for analyzing historical emissions data.

While the results are based on actual measurements from coal mines around the world, the scientists suggest further studies that take into account more such measurements from coal mines, including abandoned mines, would be helpful.

The future: More methane emissions from mines very likely

The study analyzed future methane emissions from coal mines under a range of scenarios. If efforts to address climate change remain similar to what they have been, the researchers estimate that methane emissions as a result of coal mining will increase dramatically by the end of the century: Nearly eight times what they are today from abandoned mines and four times what they are from working mines.

But Nazar notes that there is uncertainty about future coal production. If coal production decreases, then emissions from working mines would decrease.

However, in all scenarios, methane emissions from abandoned mines are expected to grow more quickly than those from established mines. The team cites deeper mines, more abandoned mines, and a greater percentage of surface mines from which methane escapes more freely as reasons why.

Those increases are significantly higher than what current climate models call for--for instance, 83 percent higher in 2050 than suggested by the widely used Global Change Analysis Model developed by PNNL.

The study estimates that if strong climate mitigation strategies are put in place, then by the end of this century the amount of methane escaping from abandoned mines would be about the same as 2020. Under the same conditions, the amount of methane escaping from working mines would be cut in half.

"If you stop producing coal, that doesn't mean that methane will stop being emitted from coal mines," said Kholod. "We can't just take coal out of the equation."

###

JGCRI scientist Meredydd Evans is also an author of the paper. Other authors include Raymond Pilcher of Raven Ridge Resources of Grand Junction, Colo.; Volha Roshchanka and Felicia Ruiz of the EPA; and Michael Coté and Ron Collings of Ruby Canyon Engineering of Grand Junction, Colo.

The research was funded by the EPA and the Global Methane Initiative.

Arctic warming and diminishing sea ice are influencing the atmosphere

Researchers of the University of Helsinki have resolved for the first time, how the environment affects the formation of nanoparticles in the Arctic. The results give additional insight into the future of melting sea ice and the Arctic atmosphere

UNIVERSITY OF HELSINKI

Research News

IMAGE

IMAGE: MEASUREMENTS IN NORTHERN GREENLAND view more 

CREDIT: NINA SARNELA

The researchers of the Institute for Atmospheric and Earth system research at the University of Helsinki have investigated how atmospheric particles are formed in the Arctic. Until recent studies, the molecular processes of particle formation in the high Arctic remained a mystery.

During their expeditions to the Arctic, the scientists collected measurements for 12 months in total. The results of the extensive research project were recently published in the Geophysical Research Letters journal.

The researchers discovered that atmospheric vapors, particles, and cloud formation have clear differences within various Arctic environments. The study clarifies how Arctic warming and sea ice loss strengthens processes where different vapors are emitted to the atmosphere. The thinning of sea ice enables more iodine emissions while broader open waters enable more emissions of sulfur-containing vapors.

Higher concentrations of vapors result in a higher amount of particles. This on the other hand will lead to more clouds, which can - depending on the season and location - either slow down or accelerate the Arctic warming. Detailed knowledge of these processes is crucial in order to understand the consequences of global warming.

"Our observations are contributing to further understanding of what happens in the Arctic atmosphere due to warming. In general, atmospheric particles and clouds play an important role in regulating the atmosphere's temperature, and any changing behavior of these has consequences on Arctic warming. Arctic areas are especially sensitive to changes in cloudiness and albedo", says Lisa Beck, a doctoral student at the Institute for Atmospheric and Earth System Research (INAR).

More in­for­ma­tion about the fu­ture of melt­ing sea ice

The researchers conducted measurements in Northern Greenland at Villum research station and in Svalbard at Ny-Ålesund for 6-months at each station. While both sites are located at similar latitudes, about 1000 km south of the North Pole, their environments are very different. Villum-station is surrounded by sea ice all year round, while the warm sea currents cause the sea around Ny-Ålesund to remain open.

In Northern Greenland the researchers discovered that in the spring after the Polar night the microalgae below the sea ice started to emit iodine compounds to the atmosphere. As the spring continues, the thinning sea ice leads to the emission of even more iodine compounds. These compounds form molecular clusters that can grow into bigger particles.

In Svalbard, surrounded by open waters, the observations showed how sulfur-compounds emitted by phytoplankton could form a large amount of particles that could grow fast, and can even form cloud droplets. In the studies of Svalbard also organic compounds were detected.

The large amount and role of organic compounds in the Arctic particle formation surprised the researchers.

"We did not expect to observe many organic vapors in the cold and bare Arctic environment as they have been mainly seen in areas covered by forests. We are planning to continue the studies in Svalbard to figure out what these organic compounds are and where they are coming from", Beck says.

The particle concentrations in Svalbard were clearly higher than the ones measured in Northern-Greenland.

"Currently, the Arctic sea ice is melting fast. As a result, we can assume that the processes observed in Svalbard will be more common in the Arctic areas that will be liberated from sea ice", Beck says.

###

The published research is connected to the recent Polarstern studies that have continued the studies in the high Arctic in the middle of sea ice areas.

More information:

Lisa Beck
Doctoral student, University of Helsinki
Institute for Atmospheric and Earth System Research (INAR)
lisa.beck@helsinki.fi

Nina Sarnela
Postdoctoral researcher, University of Helsinki
Institute for Atmospheric and Earth System Research (INAR)
+358505741513,
nina.sarnela@helsinki.fi
@NinaSarnela

Mikko Sipilä
Associate professor, University of Helsinki
Institute for Atmospheric and Earth System Research (INAR)
+358407093103
mikko.sipila@helsinki.fi

Read more: The Polar and arctic atmospheric research group

Local emissions amplify regional haze and particle growth

INSTITUTE OF ATMOSPHERIC PHYSICS, CHINESE ACADEMY OF SCIENCES

Research News

IMAGE

IMAGE: A SCHEMATIC PLOT TO SHOW ENHANCED PARTICLE GROWTH BY LOCAL PRIMARY EMISSIONS CONTRIBUTE TO MORE SEVERE HAZE AT GROUND LEVEL. view more 

CREDIT: YELE SUN

New particle formation (NPF) is a major source of aerosol particles in the global atmosphere. In polluted megacities, such as Beijing, the role of new particle formation events and their contribution to haze formation through subsequent growth is still unclear.

To improve the understanding of the sources, meteorological conditions, and chemistry behind air pollution, the research teams led by Prof. Yele Sun with the Institute of Atmospheric Physics at the Chinese Academy of Sciences and Prof. Markku Kulmala with the University of Helsinki performed simultaneous measurements of aerosol composition and particle number size distributions at ground level and at 260 m in central Beijing, China, during a total of 4 months in 2015-2017. Their study was recently published in npj Climate and Atmospheric Science.

"The haze formation is initiated by the growth of freshly formed particles at both ground level and city aloft. However, the haze was more severe at ground level because of higher particle growth rates due to the impacts of local primary particles and gaseous precursors." said Prof. Sun.

According to Prof. Sun, the particle growth creates a feedback loop, in which a further development of haze increases the atmospheric stability. It in turn strengthens the persisting apparent decoupling between the two heights and increases the severity of haze at ground level.

The team further complemented the field observations with NAQPMS+APM model analyses, and found that the haze associated with NPF and growth was formed on a regional scale in Beijing-Tianjin-Hebei area. Prof. Sun said, "The growth of NPF-originated particles accounts for up to ?60% of the accumulation mode particles, and drives the haze formation in the Beijing-Tianjin-Hebei area."

The team also performed simulations on how emission reductions would affect haze development. "Concentration of both primary and secondary particles in the accumulation mode would decrease drastically, and the haze formation would be reduced if the emission cuts are higher than 30%." Concluded Prof. Sun. "Our results show that a reduction in anthropogenic gaseous precursors can suppress particle growth, and therefore is a critical step for haze alleviation."


Human activity caused the long-term growth of greenhouse gas methane

Emissions from the oil and gas sectors, coal mining and ruminant farming drive methane growth over the past three decades

NATIONAL INSTITUTE FOR ENVIRONMENTAL STUDIES

Research News

IMAGE

IMAGE: EVOLUTION OF THE OBSERVED AND SIMULATED CONCENTRATIONS (TOP) AND GROWTH RATES (BOTTOM) IN THE SOUTHERN HEMISPHERE (SH) DURING 1988-2016. MEASUREMENT DATA FROM FOUR REMOTE MARINE STATIONS IN THE SH (NAMELY,... view more 

CREDIT: NIES

Methane (CH4) is the second most important greenhouse gas after carbon dioxide (CO2). Its concentration in the atmosphere has increased more than twice since the preindustrial era due to enhanced emissions from human activities. While the global warming potential of CH4 is 86 times as large as that of CO2 over 20 years, it stays in the atmosphere for about 10 years, much shorter than more than centuries of CO2. It is therefore expected that emission controlling of CH4 can benefit for relatively short time period toward the Paris Agreement target to limit the global warming well below 2 degrees.

A study by an international team, published in Journal of Meteorological Society of Japan, provides a robust set of explanations about the processes and emission sectors that led to the hitherto unexplained behaviors of CH4 in the atmosphere. The growth rate (annual increase) of CH4 in the atmosphere varied dramatically over the past 30 years with three distinct phases, namely, the slowed (1988-1998), quasi-stationary (1999-2006) and renewed (2007-2016) growth periods (Fig. 1). No scientific consensus is however reached on the causes of such CH4 growth rate variability. The team, led by Naveen Chandra of National Institute for Environmental Studies, combined analyses of emission inventories, inverse modeling with an atmospheric chemistry-transport model, the global surface/aircraft/satellite observations to address the important problem.

They show that reductions in emissions from Europe and Russia since 1988, particularly from oil-gas exploitation and enteric fermentation, led to the slowed CH4 growth rates in the 1990s (Fig. 2), where reduced emissions from natural wetlands due the effects of Mount Pinatubo eruption and frequent El Niño also played roles. This period was followed by the quasi-stationary state of CH4 growth in the early 2000s. CH4 resumed growth from 2007, which were attributed to increases in emissions from coal mining mainly in China and intensification of livestock (ruminant) farming and waste management in Tropical South America, North-central Africa, South and Southeast Asia. While the emission increase from coal mining in China has stalled in the post-2010 period, the emissions from oil and gas sector from North America has increased (Fig. 2). There is no evidence of emission enhancement due to climate warming, including the boreal regions, during our analysis period.

These findings highlight key sectors (energy, livestock and waste) for effective emission reduction strategies toward climate change mitigation. Tracking the location and source type is critically important for developing mitigation strategies and the implementation the Paris Agreement. The study also underlines need of more atmospheric observations with space and time density higher than the present.

CAPTION

Timeseries (1988-2016) of regional CH4 emission anomalies as derived from the inverse analysis, and the emission changes from 3 aggregated sectors during the three distinct phases of the growth rate (bar plots). The figure shows the emission anomalies from the long-term (2000-2016) mean for each region. The numbers in each panel are the long-term mean of the a posteriori emissions (in Tg yr-1).


UArizona researchers develop smartphone-based COVID-19 test

The method analyzes saliva samples and delivers results in about 10 minutes

UNIVERSITY OF ARIZONA COLLEGE OF ENGINEERING

Research News

IMAGE

IMAGE: UARIZONA RESEARCHERS IMAGE A SAMPLE USING A SMARTPHONE MICROSCOPE. view more 

CREDIT: UARIZONA BIOSENSORS LAB

Researchers at the University of Arizona are developing a COVID-19 testing method that uses a smartphone microscope to analyze saliva samples and deliver results in about 10 minutes.

The UArizona research team, led by biomedical engineering professor Jeong-Yeol Yoon, aims to combine the speed of existing nasal swab antigen tests with the high accuracy of nasal swab PCR, or polymerase chain reaction, tests. The researchers are adapting an inexpensive method that they originally created to detect norovirus - the microbe famous for spreading on cruise ships - using a smartphone microscope.

They plan to use the method in conjunction with a saline swish-gargle test developed by Michael Worobey, head of the UArizona Department of Ecology and Evolutionary Biology and associate director of the University of Arizona BIO5 Institute.

The team's latest research using water samples - done in collaboration with Kelly A. Reynolds, chair of the Department of Community, Environment and Policy in the UArizona Mel and Enid Zuckerman College of Public Health - is published today in Nature Protocols.

"We've outlined it so that other scientists can basically repeat what we did and create a norovirus-detecting device," said Lane Breshears, a biomedical engineering doctoral student in Yoon's lab. "Our goal is that if you want to adapt it for something else, like we've adapted it for COVID-19, that you have all the ingredients you need to basically make your own device."

Yoon - a BIO5 Institute member who is also a professor of biosystems engineering, animal and comparative biomedical sciences, and chemistry and biochemistry - is working with a large group of undergraduate and graduate students to develop the smartphone-based COVID-19 detection method.

"I have a couple of friends who had COVID-19 that were super frustrated, because their PCR results were taking six or seven days or they were getting false negatives from rapid antigen tests. But when they got the final PCR tests, they found out they had been sick, like they'd suspected," said Katie Sosnowski, a biomedical engineering doctoral student who works in Yoon's lab. "It's really cool to be working on a detection platform that can get fast results that are also accurate."


CAPTION

Biomedical engineering professor Jeong-Yeol Yoon and his team show University of Arizona President Robert C. Robbins and Provost Liesl Folks around the Biosensors Lab.

CREDIT

Chris Richards / University of Arizona

Cheaper, Simpler Detection

Traditional methods for detection of norovirus or other pathogens are often expensive, involve a large suite of laboratory equipment or require scientific expertise. The smartphone-based norovirus test developed at UArizona consists of a smartphone, a simple microscope and a piece of microfluidic paper - a wax-coated paper that guides the liquid sample to flow through specific channels. It is smaller and cheaper than other tests, with the components costing about $45.

The basis of the technology, described in a 2019 paper published in the journal ACS Omega, is relatively simple. Users introduce antibodies with fluorescent beads to a potentially contaminated water sample. If enough particles of the pathogen are present in the sample, several antibodies attach to each pathogen particle. Under a microscope, the pathogen particles show up as little clumps of fluorescent beads, which the user can then count. The process - adding beads to the sample, soaking a piece of paper in the sample, then taking a smartphone photograph of it under a microscope and counting the beads - takes about 10 to 15 minutes. It's so simple that Yoon says a nonscientist could learn how to do it by watching a brief video.

The version of the technology described in the Nature Protocols paper makes further improvements, such as creating a 3D-printed housing for the microscope attachment and microfluidic paper chip. The paper also introduces a method called adaptive thresholding. Previously, researchers set a fixed value for what quantity of pathogen constituted a danger, which limited precision levels. The new version uses artificial intelligence to set the danger threshold and account for environmental differences, such as the type of smartphone and the quality of the paper.

On-Campus Impact

The researchers plan to partner with testing facilities at the University of Arizona to fine-tune their method as they adapt it for COVID-19 detection. Pending approval of the university's institutional review board, students who are already being tested on campus through other methods will have the option to provide written consent for their sample to be run through the smartphone-based testing device as well. Ultimately, the researchers envision distributing the device to campus hubs so that the average person - such as a resident assistant in a dorm - could test saliva samples from groups of people.

"Adapting a method designed to detect the norovirus - another highly contagious pathogen - is an outstanding example of our researchers pivoting in the face of the pandemic," said University of Arizona President Robert C. Robbins. "This promising technology could allow us to provide fast, accurate, affordable tests to the campus community frequently and easily. We hope to make it a regular part of our 'Test, Trace, Treat' strategy, and that it will have a broader impact in mitigating the spread of the disease."

Yoon and his team are also working on another idea, based on a 2018 paper they published in Chemistry--A European Journal, which is even simpler but leaves slightly more room for error. It involves the same technology, but instead of a smartphone microscope and specially designed enclosure, users would only need to download a smartphone app and use a microfluidic chip stamped with a QR code.

"Unlike the fluorescent microscope technique, where you get the chip into just the right position, you just take a snapshot of the chip," said biomedical engineering master's student Pat Akarapipad. "No matter the angle or distance the photo is taken from, the smartphone app can use AI and the QR code to account for variances and run calculations accordingly."

The method requires no training, so, if perfected, it could potentially allow students to pick up microfluidic chips from a campus location and test their own samples. The team is also working with other members of the university's COVID-19 testing group, including Deepta Bhattacharya, an associate professor in the Department of Immunobiology.

###

Association Between Receipt of Unemployment Insurance and Food Insecurity Among People Who Lost Employment During the COVID-19 Pandemic in the United States

JAMA Netw Open. 2021;4(1):e2035884. doi:10.1001/jamanetworkopen.2020.35884
Key Points

Question  Was the receipt of unemployment insurance and a $600/wk federal supplement to unemployment insurance associated with reduced food insecurity among people in low- and middle-income households who lost work during the coronavirus disease 2019 (COVID-19) pandemic?

Findings  In this cohort study of 1119 adults who lost work during the COVID-19 pandemic, unemployment insurance was associated with a 35% relative decline in food insecurity and a 48% relative decline in eating less due to financial constraints. The $600/wk federal supplement was associated with additional reductions in food insecurity.

Meaning  These findings suggest that expanding the amount and duration of unemployment insurance may be an effective approach to reducing food insecurity.

Abstract

Importance  More than 50 million US residents have lost work during the coronavirus disease 2019 (COVID-19) pandemic, and food insecurity has increased.

Objective  To evaluate the association between receipt of unemployment insurance, including a $600/wk federal supplement between April and July, and food insecurity among people who lost their jobs during the COVID-19 pandemic.

Design, Setting, and Participants  This cohort study used difference-in-differences analysis of longitudinal data from a nationally representative sample of US adults residing in low- and middle-income households (ie, <$75 000 annual income) who lost work during the COVID-19 pandemic. Data were from 15 waves of the Understanding Coronavirus in America study (conducted April 1 to November 11, 2020).

Exposure  Receipt of unemployment insurance benefits.

Main Outcomes and Measures  Food insecurity and eating less due to financial constraints, assessed every 2 weeks by self-report.

Results  Of 2319 adults living in households earning less than $75 000 annually and employed in February 2020, 1119 (48.3%) experienced unemployment during the COVID-19 pandemic and made up our main sample (588 [53.6%] White individuals; mean [SD] age 45 [15] years; 732 [65.4%] women). Of those who lost employment, 415 (37.1%) reported food insecurity and 437 (39.1%) reported eating less due to financial constraints in 1 or more waves of the study. Among people who lost work, receipt of unemployment insurance was associated with a 4.3 (95% CI, 1.8-6.9) percentage point decrease in food insecurity (a 35.0% relative reduction) and a 5.7 (95% CI, 3.0-8.4) percentage point decrease in eating less due to financial constraints (a 47.8% relative reduction). Decreases in food insecurity were larger with the $600/wk supplement and for individuals who were receiving larger amounts of unemployment insurance.

Conclusions and Relevance  In this US national cohort study, receiving unemployment insurance was associated with large reductions in food insecurity among people who lost employment during the COVID-19 pandemic. The $600/wk federal supplement and larger amounts of unemployment insurance were associated with larger reductions in food insecurity.

READ ON/PDF

Association Between Receipt of Unemployment Insurance and Food Insecurity Among People Who Lost Employment During the COVID-19 Pandemic in the United States | Health Disparities | JAMA Network Open | JAMA Network


Association of Social and Demographic Factors With COVID-19 Incidence and Death Rates in the US

JAMA Netw Open. 2021;4(1):e2036462. doi:10.1001/jamanetworkopen.2020.36462
Key Points

Question  Are population-level social factors associated with coronavirus disease 2019 (COVID-19) incidence and mortality?

Findings  In this cross-sectional study including 4 289 283 COVID-19 cases and 147 074 COVID-19 deaths, county-level sociodemographic risk factors as assessed by the Social Vulnerability Index were associated with greater COVID-19 incidence and mortality.

Meaning  These findings suggest that to address inequities in the burden of the COVID-19 pandemic, these sociodemographic risk factors and their root causes must be addressed.

Abstract

Importance  Descriptive data have revealed significant racial/ethnic disparities in coronavirus disease 2019 (COVID-19) cases in the US, but underlying mechanisms of disparities remain unknown.

Objective  To examine the association between county-level sociodemographic risk factors and US COVID-19 incidence and mortality.

Design, Setting, and Participants  This cross-sectional study analyzed the association between US county-level sociodemographic risk factors and COVID-19 incidence using mixed-effects negative binomial regression, and COVID-19 mortality using zero-inflated negative binomial regression. Data on COVID-19 incidence and mortality were collected from January 20 to July 29, 2020. The association of social risk factors with weekly cumulative incidence and mortality was also examined by interacting time with the index measures, using a random intercept to account for repeated measures.

Main Outcomes and Measures  Sociodemographic data from publicly available data sets, including the US Centers for Disease Control and Prevention’s Social Vulnerability Index (SVI), which includes subindices of socioeconomic status, household composition and disability, racial/ethnic minority and English language proficiency status, and housing and transportation.

Results  As of July 29, 2020, there were a total of 4 289 283 COVID-19 cases and 147 074 COVID-19 deaths in the US. An increase of 0.1 point in SVI score was associated with a 14.3% increase in incidence rate (incidence rate ratio [IRR], 1.14; 95% CI, 1.13-1.16; P < .001) and 13.7% increase in mortality rate (IRR, 1.14; 95% CI, 1.12-1.16; P < .001), or an excess of 87 COVID-19 cases and 3 COVID-19 deaths per 100 000 population for a SVI score change from 0.5 to 0.6 in a midsize metropolitan county; subindices were also associated with both outcomes. A 0.1-point increase in the overall SVI was associated with a 0.9% increase in weekly cumulative increase in incidence rate (IRR, 1.01; 95% CI, 1.01-1.01; P < .001) and 0.5% increase in mortality rate (IRR, 1.01; 95% CI, 1.01-1.01; P < .001).

Conclusions and Relevance  In this cross-sectional study, a wide range of sociodemographic risk factors, including socioeconomic status, racial/ethnic minority status, household composition, and environmental factors, were significantly associated with COVID-19 incidence and mortality. To address inequities in the burden of the COVID-19 pandemic, these social vulnerabilities and their root causes must be addressed.

READ THE REST / PDF

CCNY researchers demonstrate how to measure student attention during remote learning

CITY COLLEGE OF NEW YORK

Research News

The Covid-19 pandemic has made home offices, virtual meetings and remote learning the norm, and it is likely here to stay. But are people paying attention in online meetings? Are students paying attention in virtual classrooms? Researchers Jens Madsen and Lucas C. Parra from City College of New York, demonstrate how eye tracking can be used to measure the level of attention online using standard web cameras, without the need to transfer any data from peoples computers, thus preserving privacy. In a paper entitled "Synchronized eye movements predict test scores in online video education," published in the Proceedings of the National Academy of Sciences, they show that just by looking at students eyes they can predict how well students will do on quizzes based on educational videos.


"Experienced teachers pay close attention to their students, adjusting their teaching when students seem lost. This dynamic interaction is missing in online education," said Madsen. "But in our study, we proposed to measure attention to online videos remotely by tracking eye movements and hypothesized that attentive students follow videos similarly with their eyes."

The CCNY team, was able to show that inter-subject correlation of eye-movements during educational video presentation is substantially higher for attentive students, and that synchronized eye movement are predictive of individual test scores on the material presented in the video.

"These findings replicate for videos in a variety of production styles, learning scenarios and for recall and comprehension questions alike," noted Parra. "We were able to reproduce the results using standard web cameras to capture eye-movements in a classroom setting, and with over 1,000 participants at home, without the need to transmit user data."

Their results suggest that online education can be made adaptive to a student's level of attention in real-time. "The internet has turned attention into a commodity. With video content increasing online, remote sensing of attention to video at scale may have applications beyond education, including entertainment, advertising, or politics. The applications are limitless."

###