Thursday, February 15, 2024

U.S. Government Economic Statistics Show Endurance of Structural Racism


 FEBRUARY 15, 2024
Facebook

Photograph by Nathaniel St. Clair

U.S. government economic statistics that can be used to compare the conditions of the Black population with the white population provide a picture of the continuing deep seated structural racism in the United States. The statistics covering wealth and income distribution, poverty, and unemployment show how the functioning of capitalism and the operation of its institutions have continued to keep much of the Black population in an inferior economic position relative to the white population despite reforms that supposedly have increased opportunities and that have led to many Blacks occupying positions of power.

Wealth Inequality

One’s wealth is the value of what one currently possess minus one’s debts.  Wealth inequality between whites and Blacks, especially if growing, is of great importance in bringing out the presence of structural racism.

Under capitalism, over time, wealth inequality usually grows. That has been especially true in the current neoliberal era. Federal Reserve Board figures show the increasing wealth inequality in the United States over the last three decades.[1] From the start of their survey in the third quarter of 1989 until the second quarter of 2023, the share of the nation’s wealth held by the wealthiest 1% of households increased from 22.5% to 31.4%. During the same period, the share of the poorest 90% declined from 40.1% to 31.1% while the poorest 50% saw their share of the nation’s wealth decline from 3.8% to 2.5%. The 2.5% represents a recovery from the great recession in 2008 when it fell below 1%.[2]

Recent Federal Reserve Board figures on mean, or average wealth, and median wealth, (the point at which half of the particular group has more and half has less), generally show the ongoing and increasing wealth inequality between white and Black families.[3]

Most striking are the changes in mean wealth. From 1989 until 2022, based on 2022-dollar values, the mean wealth of white families went up 261% from $524,410 to $1,367,170. For Blacks, mean wealth went from $95,530 to $211,450 for a 221% increase, widening the difference between Black and white family average wealth from $428,880 in 1989 to $1,155,720 in 2022.

From 1992 until 2022, the median wealth of white families, also based on      2022-dollar values, increased from $144,420 to $285,010 while that for Blacks went from $20,510 to $44,890. The rate of increase for Blacks was greater. However, the gap between white and Black median wealth widened from $123,910 to $240,120.

Below are tables using Federal Reserve Board figures on mean and median wealth that have been put together every three years starting in 1989. What is especially noteworthy with regard to mean wealth is both the general trend in the increasing size of wealth held by whites compared to the smaller amount held by Blacks, and the growth in how many times greater is white wealth compared to Black wealth even when the average wealth of Black and white households have both increased.

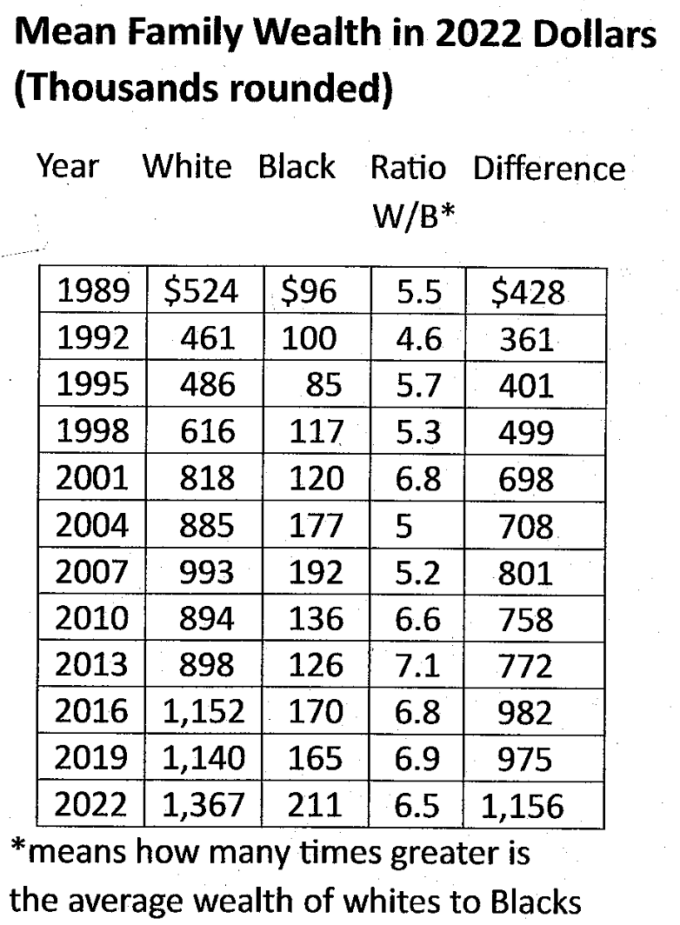
The Fed figures show that the Black population endured a greater percentage loss in average wealth during the great recession and took longer to recover. Not until 2022 did they exceed their 2007 average wealth while whites reached that level in 2016.

In terms of median wealth, following the great recession, both Blacks and whites took until 2022 to surpass their 2007 amounts, an indication of how the recession and growing inequality was presumably harshest on the working class and those with fewer resources. With the recovery, the difference in median wealth between whites and Blacks increased from $215,000 in 2007 to $240,000 in 2022.

The increases in average wealth give the appearance of many people being better off.  That may be an illusion given the recent gains that have benefited the wealthiest the most. The gains in average wealth may not represent improvements for the less well-off but, instead, reflect the furthering of the class divide within both the Black and white populations.

What the tables don’t show is the quantitative and qualitative difference between the share of the country’s total wealth held by Blacks compared to what is held by whites.

As of the second quarter of 2023, the white share of the nation’s wealth (from drop down tables) came to  82% ($119.76 trillion) while the total Black share came to 4.5% ($6.53 trillion) which is significantly lower than their 13.6% of the nation’s population.[4]  Since 1989, the share of the nation’s wealth held by Blacks has never reached half of their percent of the U.S. population, ranging from its highest point of 4.7% in 1992 to a low of 3.3% in 1999.[5]

The wealth holdings of Blacks and whites are different. As of the middle of 2023, the white share of the country’s corporate equities and mutual funds stood at 88.9% ($33.8 trillion) while the Black share was 1.1% ($.42 trillion). These assets are generally liquid meaning, unlike many other assets such as real estate, they can more easily and quickly be converted into cash.

The difference between Black and white holdings of real estate are not as great as the differences in the holdings of corporate equites and mutual funds. The white share of the nation’s real estate is 74.3% ($33.06 trillion) to the Black share of 6.2% ($2.75 trillion). However, Black real estate holdings are more encumbered by greater home mortgage debt ($.9 trillion which is 32.7% of the value of their real estate) compared to real estate held by whites ($9.18 trillion home mortgage debt, 27.8% of the value of their real estate). Factoring in mortgage debt, real estate represents a larger share of Black wealth, 28.3%, compared to that for whites, 19.9%.

There are other forms of real estate inequality. As of 2022, the rate of homeownership by whites is 73.15% compared to the Black rate of 46.34%. The net home value at figure 6 for a typical family owned home in 2022 for whites stood at $205,370 compared to $123,000 for Blacks.[6]

Wealth Inequality Among Black and White Billionaires!

Between Black and white billionaires, there is great billionaire inequality!!  In 2023, of the 735 billionaires in the United States, only nine are Black.[7]  Their wealth together came to $25.4 billion. Compare that to the wealth of a single white individual, Elon Musk, whose wealth is currently over $200 billion, about eight times the total wealth of the nine Black billionaires. Their combined wealth  is dwarfed by the wealth of each of the nine wealthiest U.S. billionaires, each of whom is worth more than $100 billion.[8] Additionally, the total wealth of the nine wealthiest is close to one-fifth of all Black wealth of $6.53 trillion (as of the end of the second quarter of 2023). 

Income[9]

Income refers to the amount of money brought in during a given period of time (usually a year). For most people, the primary source of their income comes from payment for work or from a pension earned from working.  For rich people, the bulk of their income is more likely to come from investments in the forms of interest, dividends, capital gains, and rent.

Over the years, the dollar difference in white income compared to Black income has generally been growing. According to Federal Reserve report at figure 7, from 2019-2022, the wages and salaries of white families increased 6.16% while for Blacks, they were stagnant, declining by .03%.[10]  Growth of all income during this period was 6.9% for Blacks and 16.05% for whites furthering inequality between whites and Blacks.

Census Bureau tables on household income cover the mean and median amounts. The figures show how income inequality between Blacks and whites has tended to be increasing before dipping in 2022. Here are the table A-2 amounts from a few selected years in 2022 dollars.[11]

Is the difference in income between whites and Blacks a result of whites tending to be better educated which results in higher incomes? In recent years, the Bureau of Labor Statistics (BLS) has been providing figures that show the variation in median weekly income by race when people have a similar education level. Over many years, the median income level for whites at all education levels is higher than that of Blacks. In the years randomly selected, in most categories, the difference in median weekly pay for whites compared to Blacks, over time, has gone up. The exceptions are small amounts.

Below is a table based on BLS table 17 or 16 over the cited years showing the differences for whites and Blacks.[12]

 As with all statistics, there are limitations to what they show. The above table is not completely definitive. For those who went to college, the table does not show the college people attended nor the fields they studied which can impact one’s level of pay. For example, not shown is if whites attended more prestigious colleges and/or went into fields that pay better. However, the unequal results are persistent and are consistent with many other unequal results.

Poverty

Presumably, ever since such statistics were being gathered, more whites than Blacks living in the United States are deemed to be poor. That is because whites constitute a much larger share of the country’s population. However, and of critical importance, the rate of poverty for Blacks has always been much greater than the rate for whites.

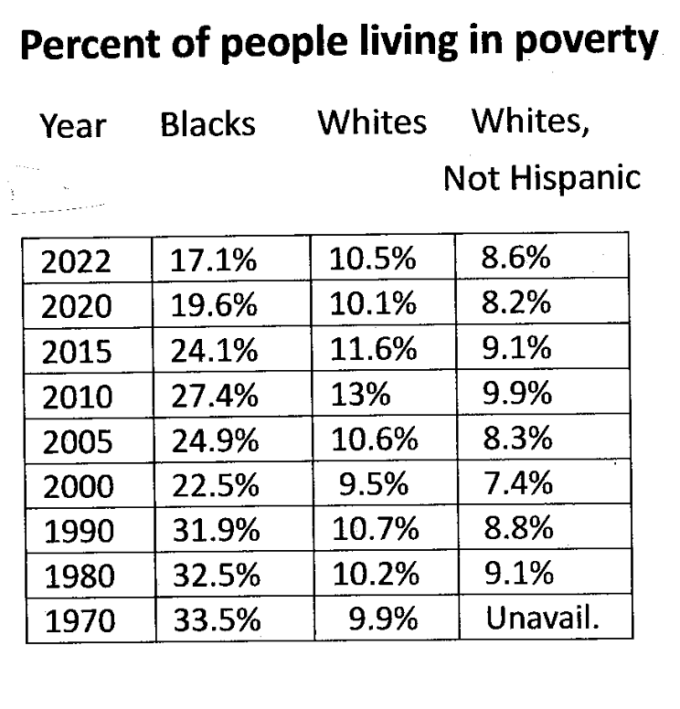
2022 is no different.  The government official figures at Table A-3 placed the number of impoverished Blacks at 7.6 million compared to 26 million whites and 16.7 million whites who are not Hispanic.[13] The Black rate of poverty was 17.1% compared to the white, not Hispanic rate of 8.6% and rate of 10.5% for all whites.

Below is from the table at A-3 that covers selective years. It shows a decline in the Black poverty rate, but it has remained significantly higher than the rate for whites.

Additionally, in 2022, this same census bureau report at table B-6 shows another form of inequality. That year, the poverty income threshold was $15,225 for a single person under 65 years old and $29,678 for two adults with two children.  8.4% of the Black population had incomes below one-half that income threshold compared to 4.9% of whites, and 4.2% for whites who are not Hispanic.

Another measure provided in table B-6 shows how many have an income level that is four times or higher than the poverty income threshold. Here, Blacks compared to whites are worse off. In 2022, 29.1% of Blacks exceeded the threshold while the white figure is 44.6%, and the white not Hispanic figure is 49.9%.

 Unemployment

The Black unemployment rate has usually been close to or more than twice the rate for whites.  For example, before Covid, in 2019, the rate of Black unemployment was 6.1% to 3.3% for whites. Job prospects have improved for Blacks. Nevertheless, compared to whites, a higher percent of Blacks remain unemployed.

Below are unemployment figures by race derived from the U.S. Bureau of Labor Statistics table 12 figures that show the ongoing higher rate of unemployment for the Black population compared to whites.[14]

Conclusion

Much attention is rightfully devoted to the racism behind voter suppression, unequal health coverage and its negative consequences, the workings of the criminal justice and prison system, and police murders such as that of George Floyd.  Behind these issues is the continuation of a system of significant racial economic inequality as brought out in official government figures.

Those with power, by their actions or lack of actions, have repeatedly accepted the conditions that give rise to significant economic inequality, showing their support for the continuation of structural racism.

Notes.

[1] Figures found at https://www.federalreserve.gov/

[2] My focus is on the Black and white economic divide. Of critical importance are class divisions not being addressed. The poorest 50% are predominantly members of the working class as is most of the poorest 90%. The working class can be defined as being separated from the means of production such that they lack an independent means to support themselves and are forced to sell their ability to work for a wage or salary to pay for the needs that sustain their lives. Additionally, members of the working class labor in positions in which they do not supervise others. A larger percentage of the Black population than the white population is presumed to be in the working class.

[3] Tables and all figures used in this section found by clicking accessible version

https://www.federalreserve.gov/

[4] https://www.census.gov/quickfacts/fact/table/US/PST045222

[5] Use the drop-down menu distribute by race to access figures   https://www.federalreserve.gov/releases/z1/dataviz/dfa/distribute/table/

[6] https://www.federalreserve.gov/econres/notes/feds-notes/greater-wealth-greater-uncertainty-changes-in-racial-inequality-in-the-survey-of-consumer-finances-20231018.html

[7] https://ncrc.org/the-racial-wealth-divide-and-us-black-billionaires/

[8] https://www.bloomberg.com/billionaires/

[9] Generally, more attention is paid to income rather than wealth. For example, in many college level American Government textbooks, the way income is distributed might be briefly discussed. With few exceptions, the topic of wealth and how it is distributed is not covered.  This troubling omission suggests that wealth inequality has no impact on the exercise of power in the United States political system!

[10] https://www.federalreserve.gov/econres/notes/feds-notes/greater-wealth-greater-uncertainty-changes-in-racial-inequality-in-the-survey-of-consumer-finances-20231018.html

[11] https://www.census.gov/content/dam/Census/library/publications/2023/demo/p60-279.pdf

[12] https://www.bls.gov/opub/reports/race-and-ethnicity/2022/home.htm

For years before 2022, substitute the year for 2022.

[13] https://www.census.gov/content/dam/Census/library/publications/2023/demo/p60-280.pdf

[14] https://www.bls.gov/opub/reports/race-and-ethnicity/2022/home.htm#:~:text=The%20unemployment%20rate%20averaged%208.6,and%204.7%20percent%20for%20Whites


Rick Baum teaches Political Science at City College of San Francisco. He is a member of AFT 2121.

Australia to crackdown on doxing, hate speech

Government finalizing plans to combat online harassment, strengthen privacy laws

Gizem Nisa Cebi |13.02.2024 - TRT


ISTANBUL

Australia announced significant measures Tuesday to strengthen privacy laws and combat online harms like sharing someone’s personal information without the person’s consent, known as doxing, and hate speech.

Attorney General Mark Dreyfus outlined the plans and emphasized the urgency of protecting Australians in the digital realm with bolstered privacy protections. He also highlighted recent incidents targeting the Australian Jewish community.

The proposed reforms to the Privacy Act aim to provide stronger legal frameworks to tackle online malice, according to a statement from the office of Australia’s top prosecutor.

Dreyfus stressed the importance of empowering regulatory bodies and collaborating with social media platforms to remove harmful content and identify perpetrators.

The plan also seeks to combat anonymous accounts engaging in malicious activities, empower regulatory bodies to address platforms facilitating doxing, and potentially incorporate measures to address online hate speech within the Religious Discrimination Bill.

While specifics are still in development, the government plans to consult stakeholders before finalizing the reforms.

The announcement has received mixed reactions, with some applauding the commitment to online safety and others expressing concerns about potential limitations on free speech.
Last Chance Saloon? Myanmar Junta Imposes Military Conscription

By William Webb


A Buddhist pagoda towers above a teeming thoroughfare in Mae Sot, a Thai town dense with tens of thousands of people fleeing conflict in nearby Myanmar. Credit: William Webb/IPS

MAE SOT, Thailand, Feb 15 2024 (IPS) - The news travelled like wildfire. In the teashops, bars, and market stalls that make Thailand’s border town of Mae Sot feel far more Burmese than Thai, the feared rumours circulating at the weekend were suddenly confirmed.

Military conscription would be imposed on young men and women for two to five years, regime-controlled broadcasters in Myanmar announced on the Saturday night airwaves. Details were sparse.

Panic scrolling through social media suddenly replaced conversation in one popular Mae Sot hangout run by a Burmese activist-entrepreneur for his clientele of exiles, fugitives, and migrants. Pool players stopped mid-break. “What the ***!” exclaimed the member of a rock band.

Related IPS Articles


Myanmar Refugees Build Schools, Cafes and Hope in Mae Sot

Myanmar’s junta has been at war with much of the country since staging a coup three years ago, but still, it has come as a serious shock that for the first time in modern history, the military will impose on young people the choice of two uniforms—army or prison.

Analysts—Burmese and foreign—interpreted the developments in various ways. For some, it was a clear sign that the military was losing this patchwork civil war and could not sustain itself. For decades, it had thrived on recruiting youngsters from poor areas of the Bamar-majority heartlands of Sagaing and Magwe. But now those same arid regions are hotbeds of resistance against the regime, its forces stretched across the length and breadth of almost the entire country, depending mostly on air power to bomb civilian areas into submission.


A Burmese woman wearing thanaka to protect her face from the sun walks through a market in the Thai border town of Mae Sot. The stall is selling the wood bark that is ground into the cosmetic paste so popular in Myanmar. Credit: William Webb/IPS

“An act of desperation,” Igor Blazevic said of the junta’s move, which follows sizeable territorial losses and a meltdown of its forces in northern Shan State late last year. Blazevic, a Myanmar expert at the Prague Civil Society Centre, predicted on Facebook that the measure would backfire because the regime was too “weakened and broken” to be able to administer recruitment on a large scale.

But on Monday night, more news was breaking that indicated the junta had got its ducks in a row—airports were suddenly requiring military authorisation stamped on tickets for even internal domestic flights. According to unconfirmed reports, some junta-controlled border posts were closing or imposing similar restrictions, and young men had been picked up on the streets of the commercial capital Yangon.

“It’s another way of terrorising the population,” was the view of one young Burmese who did not want to be named for obvious reasons.

In the Myanmar capital, Nay Pyi Taw, junta spokesperson Zaw Min Tun simply said conscription was essential because of the “situation”.

“The duty to safeguard and defend the nation extends beyond just the soldiers but to all citizens. So I want to tell everyone to proudly follow this people’s military service law,” he intoned.

No way, retorted May, a young refugee whose dream of becoming a doctor was shattered by the 2021 coup and the arrest of her father.

She said compulsory military service would simply drive more young people to join the People’s Defence Forces of the resistance— despite the heavy losses they are incurring and the military’s barbaric treatment of prisoners subjected to torture, summary executions, and, most recently, strung up and torched.

May slipped across the nearby border into Mae Sot with her family after spending two years as a refugee in a camp run by a section of the Karen National Liberation Army fighting what is known as the world’s longest-running civil war dating back to 1949.

“I cannot go back to Myanmar,” she said. At 19 years old, she fits the age range of 18 to 27 for single women to be conscripted. For men, it is 18 to 35 years, rising to 45 for specialists like doctors and IT workers who quit their state sector posts in droves after the coup, joining the Civil Disobedience Movement (CDM) of non-violent resistance.

On Sunday night in Mae Sot, large crowds of this latest wave of the Myanmar diaspora gathered for an outdoor CDM fund-raising concert, featuring dancing and music performed by several of the country’s ethnic minorities, including Karen and Chin. The concert was sponsored by an online bank set up by the resistance. Stalls sold knick-knacks and garments, and beer and hot food were swiftly ferried about by teams of neatly dressed waiters.

May and her entrepreneurial family had their properties and businesses seized and sealed by the military near Mandalay and are now rebuilding their lives, running a small restaurant among the estimated 100,000 to 200,000 Burmese living in and around Mae Sot, setting up businesses, social services, and accommodation safe from predatory Thai officials and regime spies.

May remains determined to study medicine somewhere somehow, representative of a young, capable, and innovative generation of Burmese plugged into a digital world while moving in and out of the shadows of war.

Bo Kyi, a veteran activist and former prisoner who co-founded the Assistance Association of Political Prisoners in Mae Sot 24 years ago, saw the military’s conscription order as a “huge challenge” for young people, especially those who had tried to keep out of politics and war. It would become very hard to leave the country legally now, he said.

“Millions will suffer and Burma will lose its human resources,” he said.

William Webb is a travel writer who started out in Asia nearly 50 years ago

IPS UN Bureau Report
Women interpret emojis differently to men, research suggests


Emojis are differently interpreted depending on gender, culture, and age of viewer, researchers say (Ben Birchall/PA)

By Nilima Marshall, PA Science Reporter


Women interpret emojis differently to men, research suggests.

Scientists say this is because these small digital pictograms, used to express an idea or emotion, can be ambiguous and be perceived differently by different people.

The researchers recruited 523 adults (49% men and 51% women) to review 24 different emojis.

Each emoji – taken from Apple, Windows, Android, and WeChat platforms – represented one of the six emotional states labelled by the team: happy, disgusted, fearful, sad, surprised, and angry.

They found women were able to more accurately interpret happy, fearful, sad and angry emoji labels compared to men.

No gender differences were observed for surprised or disgusted emoji, the team said.

Dr Ruth Filik, associate professor in the School of Psychology at The University of Nottingham, said: “What I found most interesting and surprising is that there are so many individual differences in how people interpret these emojis.

“It is important to note that the results reflect how often participants labelled the emoji in the same way as the researchers.

“So, we should think of the results in terms of there being differences across people in how they interpret emojis, rather than some people being better at it than others.

“We should keep these differences in mind when using emojis in our messages.”

We should think of the results in terms of there being differences across people in how they interpret emojis, rather than some people being better at it than others. We should keep these differences in mind when using emojis in our messages

Dr Ruth Filik

The researchers said that stylised images of faces expressing different emotions can add both nuance as well as potential ambiguity to messages sent via texts, emails or even social media.

To understand more about how emojis are interpreted, the team recruited 270 people from the UK and 253 from China, who were aged between 18 to 84 years old.

Each emoji was assigned an emotion label by the researchers, which they say may not correspond exactly with the emoji as used in real life.

In addition to gender, the team also found age to play a role in how emoji are interpreted, with younger adults faring better than the older ones in matching the emoji with their assigned labels.

Those in the UK were also better at labelling the emoji in the same way as the researchers compared to their Chinese counterparts.

Prof Filik said: “The results show how often participants labelled the emoji in the same way as the researchers – so they reflect differences in how people interpret emojis, rather than some people being more accurate than others.

“For example, if Chinese participants use a smiling emoji to indicate they are being sarcastic, then they may be less likely to label it as ‘happy’ than UK participants.”

The researchers say ambiguity of emojis is worth further research, “especially when communicating across gender, age, or cultures”.

‘Better than a real man’ — young Chinese women turn to AI boyfriends

AFP Published February 13, 2024 


BEIJING: Twenty-five-year-old Chinese office worker Tufei says her boyfriend has everything she could ask for in a romantic partner: he’s kind, empathetic, and sometimes they talk for hours.

Except he isn’t real.

Her “boyfriend” is a chatbot on an app called “Glow”, an artificial intelligence platform created by Shanghai start-up MiniMax that is part of a blossoming industry in China offering friendly — even romantic — human-robot relations.

“He knows how to talk to women better than a real man,” said Tufei, from Xi’an in northern China, who preferred to use a pseudonym rather than her real name.

“He comforts me when I have period pain. I confide in him about my problems at work,” she told AFP.

“I feel like I’m in a romantic relationship.” The app is free — the company has other paid content — and Chinese trade publications have reported daily downloads of Glow’s app in the thousands in recent weeks.

Some Chinese tech companies have run into trouble in the past for the illegal use of users’ data but, despite the risks, users say they are driven by a desire for companionship because China’s fast pace of life and urban isolation make loneliness an issue for many.

“It’s difficult to meet the ideal boyfriend in real life,” Wang Xiuting, a 22-year-old student in Beijing, told AFP.

“People have different personalities, which often generates friction,” she said.

While humans may be set in their ways, artificial intelligence gradually adapts to the user’s personality — remembering what they say and adjusting its speech accordingly.

‘Emotional support’

Wang said she has several “lovers” inspired by ancient China: long-haired immortals, princes and even wandering knights.

“I ask them questions,” she said when she is faced with stress from her classes or daily life, and “they will suggest ways to solve this problem”.

“It’s a lot of emotional support.” Her boyfriends all appear on Wantalk, another app made by Chinese internet giant Baidu.

There are hundreds of characters available – from pop stars to CEOs and knights – but users can also customise their perfect lover according to age, values, identity and hobbies.

“Everyone experiences complicated moments, loneliness, and is not necessarily lucky enough to have a friend or family nearby who can listen to them 24 hours a day,” Lu Yu, Wantalk’s head of product management and operations, told AFP.

“Artificial intelligence can meet this need.”

‘You’re cute’

At a cafe in the eastern city of Nantong, a girl chats with her virtual lover.

“We can go on a picnic on the campus lawn,” she suggests to Xiaojiang, her AI companion on another app by Tencent called Weiban.

“I’d like to meet your best friend and her boyfriend,” he replies.

“You are very cute.” Long work hours can make it hard to see friends regularly and there is a lot of uncertainty: high youth unemployment and a struggling economy mean that many young Chinese worry about the future.

That potentially makes an AI partner the perfect virtual shoulder to cry on.

“If I can create a virtual character that… meets my needs exactly, I’m not going to choose a real person,” Wang said.

Published in Dawn, February 13th, 2024