Wednesday, November 10, 2021

MINING IS NOT SUSTAINABLE

Sask. company at forefront of sustainable lithium mining with new tech

Saskatoon / 650 CKOM
Sask. company at forefront of sustainable lithium mining with new tech

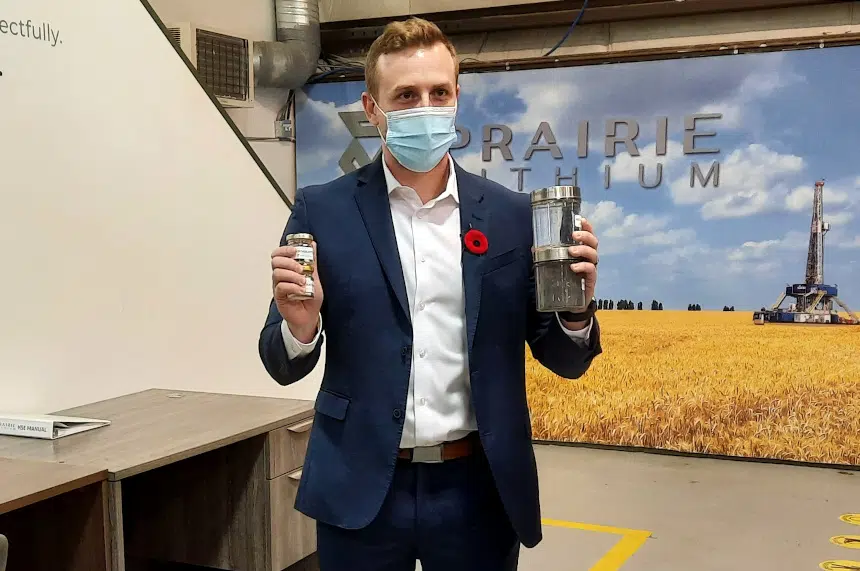
Zach Maurer, the president and CEO of Prairie Lithium, holds a small jar of lithium and other jars of the chemicals used in the process of extracting lithium from oil well brine on Nov. 9, 2021. (Lisa Schick/980 CJME)


The demand for lithium has jumped substantially in the last few years and is poised to keep doing so as electric vehicles continue storming the vehicle market.

The hitch is that mining the lithium itself isn’t very green, but a Saskatchewan company believes it has figured out a solution.

Prairie Lithium’s pilot processing facility is in a small, unassuming building in Emerald Park 10 minutes east of Regina — but if its work pans out, it could have large potential for Saskatchewan.

“If the goal is to de-carbonize transport through electrification, everybody has to be very cognizant of the materials going into those vehicles and how those materials were mined in the world,” said Zach Maurer, president and CEO of Prairie Lithium.

Maurer explained that sustainability is what the company had in mind when developing the new process to extract lithium from subsurface brine water in the oilfields.

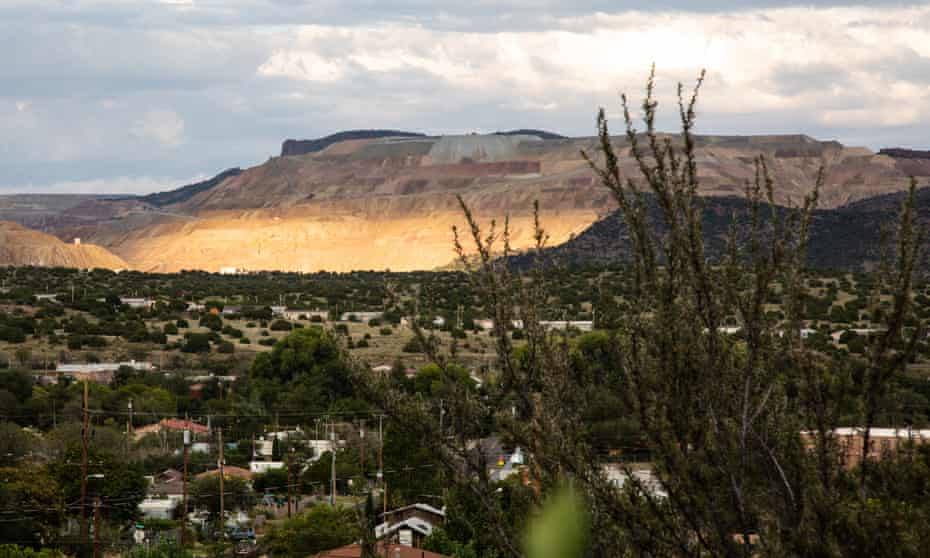
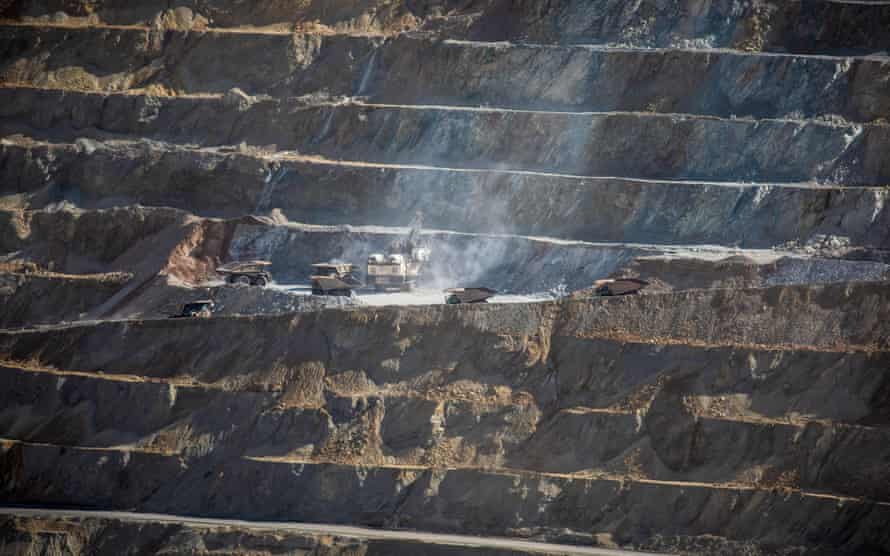
Other ways of lithium mining and in other parts of the world are criticized for using a lot of land and huge amounts of water, and have been linked to contamination and animal deaths.

However, in creating its process, Maurer said Prairie Lithium really focused on reducing land use, and the volume of freshwater used, waste generated and CO2 produced.

“In terms of sustainability, it’s obviously at the forefront of the transition to electric vehicles,” said Maurer.

In simplified terms, to get the lithium, the company drills into the brine underground and gets the fluid to the surface using brackish water that has been converted to reverse osmosis water. The company uses an ion exchange material to get the lithium out and then put the brine back underground.

Maurer said the company started work on the technology in test tubes and beakers in January 2020.

“From there we really focused on scaling up the chemistry and the process for total proof of concept,” explained Maurer.

This fall, the company finished drilling its first dedicated lithium brine well in the southeast part of the province, which was also a first for Saskatchewan. The company’s processing facility has managed to extract 99.7 per cent of lithium from brine “in a matter of minutes,” according to a news release.

“Now we’re actively working to interpret that data, quantify the resource and then put the best resource development plan in place so that when we do expand, it’s methodical and ready to go,” said Maurer.

It could take between two and four years to scale all the way up, according to Maurer.

The company used the Saskatchewan Advantage Innovation Fund and Saskatchewan Petroleum Innovation Incentive to help fund the work — help Maurer said was incredibly important.

“We didn’t have a lot of cash flowing into the business, if any. So to receive those grants in 2020 when COVID hit really, ultimately put the project onto the trajectory it is. It allowed us to work through what happened with the global pandemic so that we can continue to build this project here in the province,” said Maurer.

The well drilled this fall created more than 100 temporary jobs, but Maurer couldn’t say how many jobs — permanent or temporary — could be created once the company is scaled up.

Maurer said the company is still in the process of figuring out how big its operations could scale to, so he wasn’t willing to say how much lithium could be produced, but did say the potential is large for Saskatchewan.

Global demand for lithium is expected to increase five times its current rate by 2030, and a recent price for lithium hydroxide hit $29,000 USD per ton, according to Maurer.

Energy and Natural Resources Minister Bronwyn Eyre agreed there is potential in lithium.

“There’s enormous potential in terms of signals that we’re getting from the sector around subsurface disposition interest (and) exploration,” said Eyre.

She said the innovations in lithium mining are building on strengths the province already has.

“We have an opportunity to put ourselves in the forefront here in that global conversation … If we can position Saskatchewan for the future and for growing demand in these growing areas, of course, we’re all in,” said Eyre.

According to the provincial government, so far this year sub-surface mineral public offerings — which target minerals including but not limited to lithium — have raised more than $4.2 million in revenue for the province


About 26,000 tonnes of plastic Covid waste pollutes world’s oceans – study

Increased demand for PPE has put pressure on an already out-of-control global problem, report finds

Increased use of personal protective equipment including gloves and masks during the pandemic has added to an existing problem of mismanaged plastic waste, the report found.
 Photograph: Seaphotoart/Alamy

Mon 8 Nov 2021

Plastic waste from the Covid-19 pandemic weighing 25,900 tonnes, equivalent to more than 2,000 double decker buses, has leaked into the ocean, research has revealed.

The mismanaged plastic waste, consisting of personal protective equipment such as masks and gloves, vastly exceeded the capability of countries to process it properly, researchers said.

Covid has made us use even more plastic – but we can reset

Since the beginning of the pandemic, an estimated 8.4m tonnes of plastic waste has been generated from 193 countries, according to the report, published on Monday.

“The Covid-19 pandemic has led to an increased demand for single-use plastics that intensifies pressure on an already out-of-control global plastic waste problem,” said Yiming Peng and Peipei Wu from Nanjing University, the authors of Magnitude and impact of pandemic-associated plastic waste published in the online journal PNAS.

“The released plastics can be transported over long distances in the ocean, encounter marine wildlife, and potentially lead to injury or even death,” they added.

study in March presented the first case of a fish entrapped in a medical glove, encountered during a canal cleanup in Leiden, the Netherlands. In Brazil a PFF-2 protective mask was found in the stomach of a dead Magellanic penguin.

The scientists predicted that by the end of the century almost all pandemic-associated plastics will end up on either the seabed or on beaches.

The Chinese study found that 46% of the mismanaged plastic waste came from Asia, due to the high level of mask-wearing by individuals there, followed by Europe, 24%, and North and South America, 22%.

Peng and Wu said their research suggested 87.4% of the excess waste was from hospitals, rather than from individual use. PPE usage by individuals contributed only 7.6% of the total, while packaging and test kits accounted for 4.7% and 0.3% respectively.

“Most of the plastic is from medical waste generated by hospitals that dwarfs the contribution from personal protection equipment and online-shopping package material,” they wrote.

“This poses a long-lasting problem for the ocean environment and is mainly accumulated on beaches and coastal sediments.”

The thousands of tonnes of masks, gloves, testing kits and face visors which leached into the oceans from the start of the pandemic up to August this year, were transported in 369 major rivers.

Chief among these were Shatt al-Arab in south-eastern Iraq, which carried 5,200 tonnes of PPE waste to the ocean; the Indus river, which arises in western Tibet, carried 4,000 tonnes and the Yangtze river in China 3,700 tonnes. In Europe, the Danube carried the most plastic pandemic waste into the ocean: 1,700 tonnes.

The top 10 rivers accounted for 79% of pandemic plastic discharge, the top 20 for 91%, and the top 100 for 99%. About 73% of the discharge was from Asian rivers followed by European watercourses (11%), with minor contributions from other continents, the report said.

“These findings highlight the hotspot rivers and watersheds that require special attention in plastic waste management,” the authors said.

“We find a long-lasting impact of the pandemic-associated waste release in the global ocean. At the end of this century, the model suggests that almost all the pandemic-associated plastics end up in either the seabed (28.8%) or beaches (70.5%).”

The authors saidthe findings showed better medical waste management was needed in pandemic epicenters, especially in developing countries.


Plastic waste release caused by COVID-19 and its fate in the global ocean

Yiming Peng, Peipei Wu, Amina T. Schartup, and View ORCID Profile
Yanxu Zhang


See all authors and affiliations
PNAS November 23, 2021 118 (47) e2111530118; https://doi.org/10.1073/pnas.2111530118


Edited by B. L. Turner, Arizona State University, Tempe, AZ, and approved October 6, 2021 (received for review June 22, 2021)


Article
Figures & SI
Info & Metrics
PDF


Significance

Plastic waste causes harm to marine life and has become a major global environmental concern. The recent COVID-19 pandemic has led to an increased demand for single-use plastic, intensifying pressure on this already out-of-control problem. This work shows that more than eight million tons of pandemic-associated plastic waste have been generated globally, with more than 25,000 tons entering the global ocean. Most of the plastic is from medical waste generated by hospitals that dwarfs the contribution from personal protection equipment and online-shopping package material. This poses a long-lasting problem for the ocean environment and is mainly accumulated on beaches and coastal sediments. We call for better medical waste management in pandemic epicenters, especially in developing countries.

Abstract

The COVID-19 pandemic has led to an increased demand for single-use plastics that intensifies pressure on an already out-of-control global plastic waste problem. While it is suspected to be large, the magnitude and fate of this pandemic-associated mismanaged plastic waste are unknown. Here, we use our MITgcm ocean plastic model to quantify the impact of the pandemic on plastic discharge. We show that 8.4 ± 1.4 million tons of pandemic-associated plastic waste have been generated from 193 countries as of August 23, 2021, with 25.9 ± 3.8 thousand tons released into the global ocean representing 1.5 ± 0.2% of the global total riverine plastic discharge. The model projects that the spatial distribution of the discharge changes rapidly in the global ocean within 3 y, with a significant portion of plastic debris landing on the beach and seabed later and a circumpolar plastic accumulation zone will be formed in the Arctic. We find hospital waste represents the bulk of the global discharge (73%), and most of the global discharge is from Asia (72%), which calls for better management of medical waste in developing countries.
plastic
ocean
MITgcm
COVID-19

Plastics have an excellent strength to weight ratio, and they are durable and inexpensive, making them the material of choice for most disposable medical tools, equipment, and packaging (12). The COVID-19 pandemic has demonstrated the indispensable role of plastic in the healthcare sector and public health safety (2). As of August 23, 2021, about 212 million people worldwide have been infected with the COVID-19 virus with the most confirmed cases in the Americas (47.6%) and Asia (31.22%) followed by Europe (17.26%) (3). The surging number of inpatients and virus testing substantially increase the amount of plastic medical waste (4). To sustain the enormous demand for personal protective equipment (PPE, including face masks, gloves, and face shields), many single-use plastic (SUP) legislations have been withdrawn or postponed (2). In addition, lockdowns, social distancing, and restrictions on public gathering increase the dependency on online shopping at an unprecedented speed, the packaging material of which often contains plastics (56).

Unfortunately, the treatment of plastic waste is not keeping up with the increased demand for plastic products. Pandemic epicenters in particular struggle to process the waste (7), and not all the used PPEs and packaging materials are handled or recycled (89). This mismanaged plastic waste (MMPW) is then discharged into the environment, and a portion reaches the ocean (10). The released plastics can be transported over long distances in the ocean, encounter marine wildlife, and potentially lead to injury or even death (1114). For example, a recent report estimated that 1.56 million face masks entered the oceans in 2020 (15). Earlier studies have also raised the potential problem of COVID-19 plastic pollution and its impact on marine life (1618). Some cases of entanglement, entrapment, and ingestion of COVID-19 waste by marine organisms, even leading to death, have been reported (1920). The plastic debris could also facilitate species invasion and transport of contaminants including the COVID-19 virus (2123). Despite the potential impacts, the total amount of pandemic-associated plastic waste and its environmental and health impacts are largely unknown. Here, we estimate the amount of excess plastic released during the pandemic that enters the global ocean and its long-term fate and potential ecological risk.

Results
MMPW Generation.

As of August 23, 2021, the total excess MMPW generated during the pandemic is calculated as 4.4 to 15.1 million tons (Fig. 1). We use the average of scenarios with different assumptions as our best estimate (Methods), which is about 8.4 ± 1.4 million tons. A dominant fraction (87.4%) of this excess waste is from hospitals, which is estimated based on the number of COVID-19 inpatients (24) and per-patient medical waste generation for each country (25). PPE usage by individuals contributes only 7.6% of the total excess wastes. Interestingly, we find that the surge in online shopping results in an increased demand for packaging material. However, we find that packaging and test kits are minor sources of plastic waste and only account for 4.7% and 0.3%, respectively.

Download figure
Open in new tab
Download powerpoint
Fig. 1.

Global generation of mismanaged plastics from different sources (hospital medical waste, test kits, PPE, and online packaging) attributable to the COVID-19 pandemic. High- and low-yield scenarios are considered for each source (Methods).


Table 1 shows the distribution of COVID-19 cases across different continents (Asia, Europe, North America, South America, Oceania, and Africa). About 70% of COVID-19 cases are found in North and South America and Asia (Table 1). We find that MMPW generation does not follow the case distribution, as most MMPW is produced in Asia (46%), followed by Europe (24%), and finally in North and South America (22%) (Table 1 and Fig. 2E). This reflects the lower treatment level of medical waste in many developing countries such as India, Brazil, and China (range between 11.5 and 76% as the low- and high-end estimates) compared with developed countries with large numbers of cases in North America and Europe (e.g., the United States and Spain) (0 to 5%) (Fig. 2A). The MMPW generated from individual PPE is even more skewed toward Asia (Fig. 2C and SI Appendix, Table S1) because of the large mask-wearing population (26). Similarly, the MMPW generated from online-shopping packaging is the highest in Asia (Fig. 2D). For instance, the top three countries in the express-delivery industry of global share are China (58%), United States (14.9%), and Japan (10.3%) followed by the United Kingdom (4%) and Germany (4%) (27).

VIEW INLINE
VIEW POPUP
Table 1.

Percentage of the confirmed COVID-19 cases (as of August 23, 2021), the generated mass of pandemic-associated MMPW ending up in the environment, and the pandemic-associated MMPW that is transported to river mouths for different continents


Download figure
Open in new tab
Download powerpoint
Fig. 2.

Accumulated riverine discharge of pandemic-associated mismanaged plastics to the global ocean. Panels are for the discharges caused by (A) hospital medical waste, (B) COVID-19 virus test kits, (C) PPE, (D) online-shopping packaging material, and (E) the total of them. The background color represents the generated MMPW in each watershed, while the sizes of the blue circles are for the discharges at river mouths.

Riverine Discharge of MMPW.

Based on the MMPW production from each country and a hydrological model (28), we calculate a total discharge of 25.9 ± 3.8 (12.3 as microplastics [< 5 mm] and 13.6 as macroplastics [> 5 mm]) thousand tons of pandemic-associated plastics to the global ocean from 369 major rivers and their watersheds (Fig. 2E). We believe that the 369 rivers (account for 91% of the global riverine plastic discharge to the sea) considered here include a vast majority of the global pandemic-associated plastic discharge. The top three rivers for pandemic-associated plastic waste discharge are Shatt al Arab (5.2 thousand tons, in Asia), Indus (4.0 thousand tons, in Asia), and Yangtze River (3.7 thousand tons, in Asia) followed by Ganges Brahmaputra (2.4 thousand tons, in Asia), Danube (1.7 thousand tons, in Europe), and Amur (1.2 thousand tons, in Asia). These findings highlight the hotspot rivers and watersheds that require special attention in plastic waste management.

Overall, the top 10 rivers account for 79% of pandemic plastic discharge, top 20 for 91%, and top 100 for 99%. About 73% of the discharge is from Asian rivers followed by Europe (11%), with minor contributions from other continents (Table 1). This pattern is different from that of the generation of MMPW (Table 1) because of the different ability of rivers to export plastic load to the ocean, which is measured as the yield ratio (defined as the ratio between the plastic discharges at the river mouth and the total MMPW generation in the watershed). The yield ratio is influenced by factors such as the distribution of plastic release along rivers and the physical conditions of rivers (e.g., water runoff and velocity) (28). The top five rivers with the highest yield ratios are the Yangtze River (0.9%), Indus (0.5%), Yellow River (0.5%), Nile (0.4%), and Ganges Brahmaputra (0.4%). These rivers have either high population density near the river mouth, large runoff, fast water velocity, or a combination of them. The combination of high pandemic-associated MMPW generations and yield ratio for Asian rivers results in their high discharge of MMPW to the ocean.
The Fate of MMPW in the Ocean.

We simulate the transport and fate of the 25,900 ± 3,800 tons of pandemic-associated plastic waste by the Nanjing University MITgcm-Plastic model (NJU-MP) to evaluate its impact on the marine environment. The model considers the primary processes that plastics undergo in seawater: beaching, drifting, settling, biofouling/defouling, abrasion, and fragmentation (29). The model reveals that a large fraction of the river discharged plastics are transferred from the surface ocean to the beach and seabed within 3 y (Fig. 3). At the end of 2021, the mass fraction of plastics in seawater, seabed, and beach are modeled as 13%, 16%, and 71% respectively. About 3.8% of the plastics are in the surface ocean with a global mean concentration of 9.1 kg/km2. Our model also suggests that the discharged pandemic-associated plastics are mainly distributed in ocean regions relatively close to their sources, for example, middle- and low-latitude rivers distributed in East and South Asia, South Africa, and the Caribbean (Fig. 4 and SI Appendix, Fig. S2). The beaching and sedimentation fluxes are mainly distributed near major river mouths (Fig. 4 and SI Appendix, Fig. S2). This suggests that the short-term impact of pandemic-associated plastics is rather confined in the coastal environment.

Download figure
Open in new tab
Download powerpoint
Fig. 3.

Projection of the fate of discharged pandemic-associated plastics (including both microplastics and macroplastics) in the global ocean. (A) The mass fractions and average concentrations in the surface ocean. (B) The mass fractions in the seawater, seabed, and beaches.


Download figure
Open in new tab
Download powerpoint
Fig. 4.

Modeled spatial distribution of mass concentrations of COVID-19-associated plastics in the surface ocean (A–C, J–L), on the beaches (D–F, M–O), and the seabed (G–I, P–R) in 2021, 2025, and 2100, respectively. The black boxes on the Top panel indicate the five subtropical ocean gyres (North Pacific Gyre, North Atlantic Gyre, South Pacific Gyre, South Atlantic Gyre, and Indian Gyre). Panels A–I are for the microplastics, while J–R are for the macroplastics.


The model suggests the impact could expand to the open ocean in 3 to 4 y. The mass fraction of plastics in the seawater is predicted to decrease in the future while those in seabed and beach are modeled to gradually increase. At the end of 2022, the fractions of riverine discharged, pandemic-associated MMPW in seawater, seabed, and beach are modeled as 5%, 19%, and 76%, respectively, and the mean surface ocean concentration sharply decreases to 3.1kg/km2. In 2025, five garbage patches in the center of subtropic gyres merge, including the four in North and South Atlantic and Pacific and the one in the Indian Ocean (Fig. 4 and SI Appendix, Fig. S2). Hot spots for sedimentation fluxes are also modeled in the high-latitude North Atlantic and the Arctic Ocean in 2025 (Fig. 4 and SI Appendix, Fig. S2), reflecting the large-scale vertical movement of the seawaters (SI Appendix, Fig. S3).

We find a long-lasting impact of the pandemic-associated waste release in the global ocean. At the end of this century, the model suggests that almost all the pandemic-associated plastics end up in either the seabed (28.8%) or beaches (70.5%), potentially hurting the benthic ecosystems. The global mean pandemic-associated plastic concentrations in the surface ocean are predicted to decrease to 0.3 kg/km2 in 2100, accounting for 0.03% of the total discharged plastic mass. However, two garbage patches are still modeled over the northeast Pacific and the southeast Indian Ocean, exerting persistent risk for ecosystems over there. The fate of microplastics and macroplastics are similar but with a higher fraction of macroplastics ending up in the beaches due to their lower mobility (Fig. 4 and SI Appendix, Fig. S1).

The Arctic Ocean appears to be a dead-end for plastic debris transport due to the northern branch of the thermohaline circulation (30). About 80% of the plastic debris discharged into the Arctic Ocean will sink quickly, and a circumpolar plastic accumulation zone is modeled to form by 2025. In this year, the Arctic seabed accounts for 13% of the global plastic sedimentation flux, but this fraction will increase to 17% in 2100. The Arctic ecosystem is considered to be particularly vulnerable due to the harsh environment and high sensitivity to climate change (3132), which makes the potential ecological impact of exposure to the projected accumulated Arctic plastics of special concern.

Discussion

It is speculated that the pandemic will not be completely controlled in a couple of years, and many of the containing policies will continue to be implemented (33). By the end of 2021, it is conservatively estimated that the number of confirmed cases will reach 280 million (34). The generated pandemic-associated MMPW will reach a total of 11 million tons, resulting in a global riverine discharge of 34,000 tons to the ocean. The MMPW generation and discharge are expected to be more skewed toward Asia due to record-breaking confirmed cases in India (3). Given the linearity between the discharge and ocean plastic mass, the fate and transport of the newly generated plastic discharge can be deduced from our current results.

There are substantial uncertainties associated with our estimate of pandemic-associated MMPW release due to the lack of accurate data (e.g., the number of used masks and online-shopping packages and the fraction of mismanaged waste under the over-capacity conditions). For example, our estimate for the discharge from face mask usage is much lower than that of Chowdhury et al. (35), which assumes that a person uses a single mask daily while we assume a mask lasts for 6 d based on survey data (Methods). We thus consider multiple scenarios to cap the actual situations (Methods). The estimated MMPW as hospital medical waste varies by ±53%, while that from packaging and PPE vary by ±25% and a factor of ∼3.5, respectively. The estimated amounts of riverine MMPW discharge to the ocean have also uncertainty as they are based on a coarse resolution (i.e., watershed-wise) hydrological model (28). In addition, factors such as the fragmentation, abrasion, and beaching rate of plastics in NJU-MP also have a substantial influence on the simulation results (29). Despite these uncertainties, the spatial pattern of the pandemic-associated releases and their relative fate in different compartments of the ocean is more robust.

The pandemic-associated plastic discharge to the ocean accounts for 1.5 ± 0.2% of the total riverine plastic discharges (2836). A large portion of the discharge is medical waste that also elevates the potential ecological and health risk (37) or even the spreading of the COVID-19 virus (38). This offers lessons that waste management requires structural changes. The revoking or delaying of the bans on SUPs may complicate plastic waste control after the pandemic. Globally public awareness of the environmental impact of PPE and other plastic products needs to be increased. Innovative technologies need to be promoted for better plastic waste collection, classification, treatment, and recycling, as well as the development of more environmentally friendly materials (1539). Better management of medical waste in epicenters, especially in developing countries, is necessary.

READ ON HERE

ROMANIA

‘Danger unites us’: coalminers on the frontline of clean energy

As Romanian mines close, some cannot afford the EU-funded ‘Just Transition’ retraining

Sebastian Tirintică operating machinery inside the mine. 
Photograph: Adrian Catu/The Guardian

Andrada Fiscutean and Ashira Morris
THE GUARDIAN
Wed 10 Nov 2021

Three hundred metres below ground, Sebastian Tirintică operates an elevator at the Livezeni mine in Romania’s Jiu valley. His eyes widen with concentration as he guides the lever to lower the cage, ferrying the iron, wood, and other materials his co-workers need to extract coal. His focus keeps his fellow miners alive, which could be said for everyone working at Livezeni. Most of the equipment is more than 30 years old. Miners go underground knowing that a ceiling support could collapse or that a conveyor belt could snap. In seven years working inside the mine, Tirintică has been buried in coal three times. Each time, his co-workers pulled him out.

“Danger unites us,” he said. “The brotherhood of the underground. You know that your colleague behind you can save your life.”


Miners work inside the Livezeni mine.
 Photograph: Adrian Catu/The Guardian

Outside the mine at an institutional level, he says, there’s no one to watch his back. Coal has been on the decline for 3o years with little else created to replace the lost jobs. In the mid-1990s, 15 mines in the Jiu valley employed 45,000 people. Now, only about 3,000 workers remain in four mines: Livezeni, Vulcan, Lonea, and Lupeni. They are all scheduled to shut by 2030, as Romania strives to meet the EU climate targets. Coal makes up about a fifth of the country’s energy supply, less than wind and solar combined.

But as operations close, people in these monotowns reliant on the coal industry are left with few options other than moving away to find decently paying work. Many have already left. In Tirintică’s five-storey apartment building, almost half of the homes are empty.

“We need something to replace mining jobs with,” Lucian Enculescu, the leader of the Livezeni ‘Libertatea 2008’ union said. “Anything.”

Multiple EU funds will begin to distribute money in an effort to help countries phase out coal and facilitate a “just transition” to clean energy. But currently, only one programme is under way in the valley: a training centre about to open in the city of PetroÈ™ani, the closest town to Livezeni. It aims to re-skill 200 people in the next two years as wind turbine technicians. The project is run by the Renewable Energy School of Skills (RESS) with the support of the Romanian Wind Energy Association.

Miners receive training aimed at helping them move into the wind industry. 
Photograph: Adrian Catu/The Guardian

The centre, which began operations at the end of September, is funded through the Human Capital European programme. It is the pilot project of a larger proposal to reskill 8,000 miners and other people in the valley over the next 10 years, a goal that could be achieved using EU funds, said Sebastian Enache, senior managing director of RESS.

“We have the commitment of the industry that those who will graduate from the academy will have priority on the job market,” Enache said.

The one- to four-month training programme, valued at about €8,000 (£6,828), is free for miners to take part in. The course certifies them to work on turbines across Romania and abroad.

“This reskilling programme is maybe the best thing that has happened in the Jiu valley in the past 10 years,” said former miner Adrian Borbel, now a wind energy technician trainer. “Wind energy offers jobs that allow people to support their families, even if there’s only one person working in that family.”

Tirintică and his fellow miners are aware that coal is on its way out and they welcome the new programme, saying they are eager to learn, and that the wind energy jobs suit them. After mining with decades-old machines, the state-of-the-art wind turbine equipment feels like a luxury.

“Many people ask: wouldn’t you be afraid to work on a wind turbine?” he said. “How can I be afraid to work 100m above the ground? Inside the mine, I go 300 metres below ground every day.”

But while there is enthusiasm for the wind energy training programme, miners say it is not perfect. The valley is not suitable for wind energy, so anyone who wants to work in the industry will have to leave. Many miners say the wages offered by the renewable sector are not high enough to compensate them for the time spent away from their families. Tirintică already took a wind industry reskilling course, and said he was offered €1,350 a month take-home pay to work as an entry-level technician. That would be more than the €600-800 he makes at the mine, but it would also mean spending half of the year away from his home and family, giving up on his side hustles and paying rent, possibly in a city with a higher cost of living than the Jiu valley.

The training is designed to provide miners with hands-on experience so their starting salaries can match their mining pay. In time, graduates from the programme could earn up to €5,000 a month, Enache argues. But the necessity of taking time to build a career in renewables collides with the miners’ need to earn money in the short term. Some said that if they have to be away from their family anyway, they might consider taking other better-paid jobs. Working in construction or picking asparagus in Germany pays €2,000-2,800 a month.

For people such as Tirintică, who have families in the valley, mining has always been a profession chosen out of economic logic. He grew up hearing stories about working underground from his father and did not want to join their ranks himself. But since most employers in the region only offer €300-400 a month, he saw the mine as his only route to financial stability.

For decades, the local economy has been dominated by a single industry: coal. The incoming European money aims to diversify the region. Romania can access around €2bn billion from the EU’s Just Transition Fund. That process starts with creating specific plans for the country’s coal regions, including the Jiu valley. The European Commission hired the consulting firm PwC to run the planning process, and the consultants have held multiple meetings and workshops with local stakeholders, including mayors, union leaders, priests, and NGOs. However, the miners say the consultants have not spoken to a single frontline worker.

The most recent draft proposes to remake the economy, build infrastructure, improve quality of life, and support local entrepreneurship. It calls for programmes to attract international investors, to build centres where people could train for careers in technology and other industries, and to develop tourism in the region. How those plans are implemented remains an open question.

“Everybody asks: Why don’t investors come?” said Florin Tiberiu Iacob-Ridzi, mayor of PetroÈ™ani. “We are 100km away from any highway. The Jiu valley is a bit isolated.”

Until a strategy is implemented, the miners are left to find solutions on their own, knowing that their employment could end soon. Those close to the retirement age of 45 plan to take the government’s €10,000 buyout, which is periodically offered in a bid to reduce the number of jobs relying on coal. In addition to the lump sum, they rely on the generous pension given for dangerous working conditions. Younger miners are forced to come up with their own backup plans. Some already work second jobs on top of their mining shifts, doing repairs, laying floor tiles, or driving delivery trucks.

Mădălin Brândău, who has been a miner for six years, recently took a wind energy course on working at heights, taught by the same organisation that opens the PetroÈ™ani centre. At the moment, he says the mine is the best option and has not signed a contract to transition to renewables yet. He knows, though, Romania’s coal phase-out date is near, and he’s making backup plans.

“I’m preparing for when the mines close,” he said. “I did a welding course. I got my truck driving licence. I took every possible course that was available. When the mines close, I’ll put all my certifications on the table.”

If possible, he wants to stay in his home town, where he is the lead singer of a traditional Romanian band that has other miners.

For now, with few other lucrative jobs, miners such as Tirintică and Brândău continue to go underground hoping they will emerge alive at the end of their shifts.

“As a child, seeing how many accidents and explosions kept happening, I cried into the night praying to God to close the Petrila mine where my father worked,” Brândău said. He has still not told his mother that he works as a rescuer, going inside the most dangerous underground areas to save his colleagues or put out fires.

The wind energy courses in PetroÈ™ani will begin by the end of the year, but the Jiu valley’s future remains uncertain.

“We know what we should do,” Iacob-Ridzi, the mayor of PetroÈ™ani said. “But nobody knows how we should do it.”


This story was produced in partnership with the Pulitzer Center
How the rise of copper reveals clean energy’s dark side

View of the Chino mine from across the valley.
 Photograph: Julie Dermansky/Earthworks


As the world shifts to wind energy and electric cars, demand for the conductive metal has increased. But mining copper brings its own environmental hazards

Supported by


Gitanjali Poonia for New Mexico In Depth; Graphics by Aliya Uteuova
Tue 9 Nov 2021 10.00 GMT
This story is co-published by New Mexico In Depth and Guardian US


Corky Stewart, a retired geologist, and his wife live in a rural subdivision in New Mexico’s Grant county, about a mile north of the sprawling Tyrone copper mine

“We’ve been here three years and we’ve heard four blasts,” Stewart said of the mine, one of four on an expanse of land partitioned into dozens of four-acre lots. From his perspective, the blasts don’t seem unreasonable, given that a mining company owns the property and has the right to do what it wants.

But he didn’t know when he bought the property that the company would propose a new pit called the Emma B just a half-mile from the wells he and his wife depend on for drinking water. “If they were to somehow tap into our aquifer and drain our water supply, then our houses become valueless,” he said.

“We’re not making any effort to prevent the pit from being built,” he said. “All we’re really asking is for them to give us some commitment that they will fix whatever they do to our water supply.” But the mine, owned by the company Freeport-McMoRan, refuses to give them this assurance, he said. Freeport-McMoRan did not respond to multiple requests for comment by New Mexico In Depth and the Guardian.

The company’s effort to expand comes as the US expects to invest in energy sources that are cleaner than fossil fuels, and the global demand for copper rises. Copper conducts electricity, bends easily, and is recyclable – which makes it a critical material for most forms of renewable energy, from wind and solar to electric vehicles.

But when “clean energy” relies on the extraction of metals like copper, it can also pollute the surrounding environment.
The Chino mine, also known as the Santa Rita mine, is an open-pit copper mine in the town of Santa Rita, New Mexico, 15 miles east of Silver City. 
Photograph: Julie Dermansky/Earthworks

While Freeport-McMoRan touts sustainability practices and other measures taken to reduce the company’s own greenhouse gas emissions, there’s little doubt that copper mining poses significant risks to communities on the ground, threatening everything from water access to air quality to Indigenous cultural sites.

Companies dig huge holes into the ground, going deeper than the water table. Heavy machinery kicks up dust, polluting the air. Chemicals are used to leach the mineral out of ore, and exposed water is forever contaminated. Some operations, like Freeport’s Tyrone mine, will have to pump water in perpetuity, even after there is no longer copper to be found, so that contaminated water from the mine site doesn’t flow back into the wider water table.

Chris Berry, an independent analyst focused on energy metals, said the push for clean energy is a big reason for increased demand for copper, which is estimated to grow by 350% by 2050 if the world moves towards clean energy. Its price nearly doubled from 2019 to 2020 in the US.

That’s partly because copper’s role in the transition to clean energy cannot be overstated. “We’re really going to have to re-engineer the electricity grid to make it cleaner and greener and more efficient. And that’s going to take a lot more copper, and copper mining.”

This reality puts environmentalists like Allyson Siwik, executive director of the Gila Resources Information Project, a local environmental advocacy organization in Grant county, in a tricky spot.

“We are trying to transition to a clean energy economy, right?” said Siwik. “So we obviously are very supportive of that.” However, she adds, “the increase in global demand for these metals is very disconcerting to me. You know, it’s frontline communities like us here in Grant county that bear the cost of the increased exploration, expansion of mining.”

Tucked away in rural areas of Grant county in south-western New Mexico, the vast Chino and Tyrone copper mines owned by Freeport-McMoRan don’t garner much attention in the state’s metropolitan center. But the state ranks third in copper production nationally, and the mines employ more than 1,300 people. As demand for copper increases, local employment could grow.


Freeport-McMoRan is betting on it.


The company’s 2020 annual report estimates that the demand for copper will double in the next five years as a result of growth in electric vehicles and renewable technology.

“There is an increased interest to mine copper at both existing and proposed mines to support clean energy,” Holland Shepherd, manager of the mining act reclamation program at New Mexico’s department of energy, minerals, and natural resources, said in an email.

In Sierra county, another mining company is proposing to reboot the Copper Flat mine, which briefly operated in the early 1980s before prices fell and it shut down. Themac Resources is applying for a 12-year mining permit, which also requires acquisition of enough water rights to satisfy state regulators.
Advertisement


Nearby, residents of the village of Hillsboro are concerned.


“We depend on our wells here in town for all our water,” said Gary Gritzbaugh, who has lived in Hillsboro for 25 years and is the president of the Hillsboro Mutual Domestic Water Consumers Association. The small water association serves 80 to 90 customers and has operated for more than half a century. “It is a good system,” he said, but he’s deeply concerned that the mine will drain or contaminate their wells.

Gritzbaugh said that while engineers from the mining company reassured the town that contaminated water from the mine won’t reach Hillsboro’s water supply, he isn’t certain. “Groundwater is just an underground river, it goes wherever it wants to go. People say, well, it’s not going to drain this way, it’s going to drain towards Rio Grande. Well, maybe, maybe not.”

For environmentalists set on reducing carbon emissions, there are no easy solutions to the threat that mining for copper and other essential minerals poses for communities like Hillsboro or rural residents like Stewart.

Noah Long, the western region director of the climate and clean energy program at the Natural Resources Defense Council, said that without an energy transition, there will be devastating consequences, some of which are already surfacing. “We can’t afford to wait,” he said. But he noted the need for adequate regulation of mines, as well as reusing and then recycling electric vehicle batteries.

Establishing a market to recycle electric vehicle batteries – which can last a dozen or more years – could help reduce demand for copper and rein in mining operations in areas like New Mexico, where copper ore is abundant.

“We need to shift to a policy that creates clear incentives for recycling,” said Aimee Boulanger, the executive director of the Initiative for Responsible Mining Assurance. She noted that extracting metals is now more profitable than recycling them.

In 2020, an estimated 35% of copper was recycled in the US, and about a third of total global demand is met with recycled copper. But electric vehicle battery recycling is minimal. Electric vehicle batteries contain copper, nickel, cobalt and lithium; of these, cobalt and nickel are usually recoverable for new batteries, but lithium and copper are captured for use in other industries or products, or lost in the process.

When lead-acid batteries came into the picture in 1859, they were rarely recycled – but now they are easily broken down for reuse. This could be the blueprint for electric vehicle batteries. China has already issued provisional regulations that encourage manufacturers to set up networks for collecting and recycling used batteries. The EU has a drafted act that tackles sustainable batteries.

If electric vehicles are the alternative to oil-guzzling cars, then their impact – from the mining and extraction of raw materials needed to build them to managing the waste from that process – should be addressed, said Boulanger. “And we need to make sure that we’re working to reduce that impact.”

Encouraging automakers and electronics companies to work with suppliers who source minerals responsibly is also important, environmentalists say. At the end of the day, such mines won’t ever be 100% safe, said Siwik, who recently joined Indigenous tribes and environmental groups calling on the federal government to revise hardrock mining regulations.

“We need to demand the maximum amount of environmental protection, that mines are following best management practices and being as protective as possible.” That means lining stockpiles, preventing toxic pollutants from entering groundwater, mitigating air quality impacts, and ensuring that mines reclaim the land as soon as a particular mining area is used up.
Allyson Siwik, executive director of the Gila Resources Information Project, next to Chino mine’s tailing pond. 
Photograph: Julie Dermansky/Earthworks

Encouraging automakers and electronics companies to work with suppliers who source minerals responsibly is also important.

Siwik suggests an accreditation standard awarded by the Initiative for Responsible Mining Assurance (IRMA) for scoring companies’ mining practices.

IRMA was developed independently of other standards adopted by mining industry associations. It uses public audits based on social and environmental responsibility, business integrity, and what it calls “planning for positive legacies” to measure performance. The results, reviewed by an independent auditor, are released with details about the mining operation, visited facilities and interviews that the auditors conducted with company representatives from across different departments.

The public audit covers “everything from protecting Indigenous people’s rights, to biodiversity and water, to worker health and safety”, said Boulanger. IRMA has already conducted public audits of a platinum mine in Zimbabwe and a lead-zinc mine in Mexico.

Tiffany’s, BMW and Ford Motors have already committed to sourcing responsibly, so if a mine wants to be a part of these supply chains, they would have to adhere to high standards, said Boulanger.

But environmentalists worry that copper mining giants in New Mexico will be reluctant to follow such standards.

Last year, Freeport-McMoRan announced its commitment to another standard, the Copper Mark Responsible Production Framework. Designed specifically for copper operations, it was developed by the International Copper Association, an influential trade group. This standard does not give governance and voting power to affected communities, organized labor, non-governmental environment or human rights organizations, like IRMA’s multi-stakeholder system does. But Copper Mark does issue reports based on sustainability standards. And according to Shepherd, of the state energy, minerals, and natural resources department, the Copper Mark and another standard created by the industry-led Council on Mining and Metals are both good.

But communities affected by mine operations are often skeptical of data and reports provided by industry.

When the company assures him that the water polluted by the proposed Emma B mine won’t reach his water wells, Stewart is unconvinced. “It’s the mine providing the data, right?” he said. “They’re the ones paying an expert and you know, if you want an expert to say something, [you can] just pay him money.”

Once the company has the permit, the only recourse residents like Stewart would have in the event of water contamination would be suing in court, which takes significant financial resources, he said.

“I can’t afford to hire my own hydrology firm and lawyers and all this,” says Stewart.
BLUE H2
Hyzon Motors and TC Energy announce modular hydrogen production hub development agreement

- Each production hub will produce up to 20 tonnes of low-to-negative carbon intensity hydrogen per day, close to Hyzon fleet deployments


NEWS PROVIDED BYHyzon

Nov 10, 2021, 08:35 ET

ROCHESTER, N.Y. and HOUSTON, Nov. 10, 2021 /PRNewswire/ -- Hyzon Motors Inc. (NASDAQ: HYZN), (Hyzon) a leading supplier of hydrogen-powered fuel cell electric vehicles, and TC Energy Corporation (TSX,NYSE: TRP), (TC Energy), today announced an agreement to collaborate on development, construction, operation, and ownership of hydrogen production facilities (hubs) across North America.

The hydrogen production facilities will be used to meet hydrogen fuel cell electric vehicle demand by focusing on low-to-negative carbon intensity hydrogen from renewable natural gas, biogas and other sustainable sources. The facilities will be located close to demand, supporting Hyzon back-to-base vehicle deployments.

"Through this agreement we are marrying the expertise of TC Energy in natural gas and renewables with that of Hyzon, which has its technology in fuel cell electric vehicles being delivered around the world today," said Corey Hessen, TC Energy's Senior Vice President and President, Power and Storage. "TC Energy is committed to exploring and developing energy solutions in North America for our own assets as well as those of customers to meet their energy transition needs. We believe we are well positioned to execute on the development of hydrogen and CO2 pipelines."

Under the agreement, the companies will evaluate sites across multiple states and provinces to develop hydrogen production facilities with the goal of hydrogen delivery to fuel heavy duty vehicles. The hubs will be prioritized near existing and potential customer demand with a goal to produce up to 20 tonnes of hydrogen per hub per day. TC Energy will operate the hubs, supply the power and gas commodities, and provide asset development, management services, and power and gas sales marketing.

"By partnering with TC Energy on modular hydrogen production hubs from a range of sustainable production feedstocks close to Hyzon fleet deployments we can fully decarbonize mobility at a very low cost and time to build," said Parker Meeks, Chief Strategy Officer, Hyzon Motors Inc. "This agreement is just one of the many steps and strategic partnerships that Hyzon Motors will be announcing in the coming months to confirm our ability to bring clean hydrogen infrastructure to market with our vehicles in the very near term."

Currently, Hyzon and TC Energy are evaluating near-term potential hydrogen hub production sites in a number of states, tied to prospective fleet customer deployments. In addition to Hyzon vehicle customers, the partnership will jointly market third-party hydrogen volumes to industrial sectors, power generation and energy distribution.

Utilizing existing partnerships with modular hydrogen technology partners, such as Raven SR and ReCarbon, TC Energy and Hyzon look to site hydrogen hubs to serve Hyzon fleet deployments, enabling unique speed to market for low-cost, low-to-negative carbon intensity hydrogen infrastructure development. This also complements TC Energy's strong renewable natural gas interconnections and pipeline network.

About Hyzon
Headquartered in Rochester, N.Y., with U.S. operations in the Chicago and Detroit areas, and international operations in the Netherlands, Singapore, Australia, Germany, and China, Hyzon is a leader in fuel cell electric mobility with an exclusive focus on the commercial vehicle market, and a near-term focus on back to base (captive fleet) operations. Utilizing its proven and proprietary hydrogen fuel cell technology, Hyzon aims to supply zero-emission heavy duty trucks and buses to customers in North America, Europe and around the world to mitigate emissions from diesel transportation, which is one of the single largest sources of carbon emissions globally. The Company is contributing to the escalating adoption of fuel cell electric vehicles through its demonstrated technology advantage, leading fuel cell performance and history of rapid innovation. Visit www.hyzonmotors.com.

About TC Energy
We are a vital part of everyday life - delivering the energy millions of people rely on to power their lives in a sustainable way. Thanks to a safe, reliable network of natural gas and liquids pipelines, along with power generation and storage facilities, wherever life happens — we're there. Guided by our core values of safety, responsibility, innovation, collaboration and integrity, our 7,500 people make a positive difference in the communities where we operate across Canada, the U.S. and Mexico.

TC Energy's common shares trade on the Toronto (TSX) and New York (NYSE) stock exchanges under the symbol TRP. To learn more, visit us at TCEnergy.com.

FORWARD-LOOKING INFORMATION
This release contains certain information that is forward-looking and is subject to important risks and uncertainties (such statements are usually accompanied by words such as "anticipate", "expect", "believe", "may", "will", "should", "estimate", "intend" or other similar words). Forward-looking statements in this document are intended to provide TC Energy security holders and potential investors with information regarding TC Energy and its subsidiaries, including management's assessment of TC Energy's and its subsidiaries' future plans and financial outlook. All forward-looking statements reflect TC Energy's beliefs and assumptions based on information available at the time the statements were made and as such are not guarantees of future performance. As actual results could vary significantly from the forward-looking information, you should not put undue reliance on forward-looking information and should not use future-oriented information or financial outlooks for anything other than their intended purpose. We do not update our forward-looking information due to new information or future events, unless we are required to by law. For additional information on the assumptions made, and the risks and uncertainties which could cause actual results to differ from the anticipated results, refer to the most recent Quarterly Report to Shareholders and Annual Report filed under TC Energy's profile on SEDAR at www.sedar.com and with the U.S. Securities and Exchange Commission at www.sec.gov .


AUSTRALIA

Huge amounts of cash ‘thrown around’ for hydrogen projects


The Australian’s Resources Writer Nick Evans says the concern some investors have with Fortescue’s involvement in signing projects to make hydrogen is if they were “so good, you might argue they would have been built already”.

It comes as Fortescue Metals Group chairman Andrew Forrest has signed several projects to create hydrogen with renewable energy but investors are concerned over a few issues such as the cost to construct the many projects.

Mr Forrest has admitted to shareholders it would cost hundreds of billions of dollars to turn Fortescue into a green energy powerhouse.

“The total that I got to, and we’re probably under rather than over to be honest, is about US$146.5 billion, which let’s call it $195-200 Aussie dollars, billion,” Mr Evans told Sky News host Andrew Bolt.

He named a few of Mr Forrest’s projects, such as US$80 billion for the Grand Inga project in Democratic Republic of the Congo, which involves building dams and a hydro-electric project.

“I mean these are huge figures that have been sort of thrown up and thrown around.

“You’re still talking about hundreds, and hundreds of billions of dollars when we’re done.

“These are in very difficult jurisdictions; not many companies want to go into a business in DRC, for example.”

Humans are guilty of breaking an oceanic law of nature: study

Humans guilty of breaking an oceanic law of nature
Credit: Ian Hatton, Eric Galbraith et al.

A new international study carried out by the Institute of Environmental Science and Technology of the Universitat Autònoma de Barcelona (ICTA-UAB) has examined the distribution of biomass across all life in the oceans, from bacteria to whales. Their quantification of human impact reveals a fundamental alteration to one of life's largest scale patterns.

As policymakers assemble in Glasgow for the UN Climate Change Conference, there is growing recognition that  on the environment are going global and growing urgent. However, gaining a quantitative perspective on these impacts has remained elusive.

Scientists from the ICTA-UAB in Spain, the Max Planck Institute for Mathematics in the Sciences in Germany, Queensland University of Technology in Australia, Weizmann Institute of Science in Israel, and McGill University in Canada have used advances in ocean observation and large meta-analyses to show that human impacts have already had major consequences for the larger oceanic species, and have dramatically changed one of life's largest scale patterns—a pattern encompassing the entire ocean's biodiversity, from bacteria to whales.

Early samples of marine plankton biomass from 50 years ago led researchers to hypothesize that roughly equal amounts of biomass occur at all sizes. For example, although bacteria are 23 orders of magnitude smaller than a blue whale, they are also 23 orders of magnitude more abundant. This size-spectrum hypothesis has since remained unchallenged, even though it was never verified globally from bacteria to whales. The authors of the study, published in the journal Science Advances, sought to test this hypothesis on a global scale for the first time. They used historical reconstructions and marine ecosystem models to estimate biomass before industrial scale fishing got underway (pre-1850) and compared this data to the present-day.

"One of the biggest challenges to comparing  spanning bacteria to whales is the enormous differences in scale," recalls ICTA researcher and lead author Dr. Ian Hatton, currently based at the Max Planck Institute for Mathematics in the Sciences. "The ratio of their masses is equivalent to that between a human being and the entire Earth. We estimated organisms at the small end of the scale from more than 200,000 water samples collected globally, but larger marine life required completely different methods."

Their approach focused on 12 major groups of aquatic life over roughly 33,000 grid points of the ocean. Evaluating the pre-industrial ocean conditions (pre-1850) largely confirmed the original hypothesis: There is a remarkably constant biomass across size classes.

"We were amazed to see that each order of magnitude size class contains approximately 1 gigaton of biomass globally," remarks co-author Dr. Eric Galbraith of the ICTA-UAB and a current professor at McGill University. However, he was quick to point out exceptions at either extreme. While bacteria are over-represented in the cold, dark regions of the ocean, the largest whales are relatively rare, thus highlighting exceptions from the original hypothesis.

In contrast with an even biomass spectrum in the pre-1850 ocean, an investigation of the spectrum at present revealed human impacts on ocean biomass through a new lens. While fishing and whaling only account for less than 3 percent of human food consumption, their effect on the biomass spectrum is devastating: large fish and marine mammals such as dolphins have experienced a biomass loss of 2 Gt (60% reduction), with the largest whales suffering an unsettling almost 90% decimation. The authors estimate that these losses already outpace potential  losses even under extreme climate change scenarios.

"Humans have impacted the  in a more dramatic fashion than merely capturing fish. It seems that we have broken the size spectrum—one of the largest power law distributions known in nature," reflects ICTA researcher and co-author Dr. Ryan Heneghan. These results provide a new quantitative perspective on the extent to which anthropogenic activities have altered life at the global scale. How to use marine ecosystem models to improve climate change impact forecasts

More information: Ian A. Hatton et al, The global ocean size spectrum from bacteria to whales, Science Advances (2021). DOI: 10.1126/sciadv.abh3732

Journal information: Science Advances 

Provided by Autonomous University of Barcelona 

30 Countries Pledged To Give Up Gasoline By 2040. The U.S. Didn't.

Apparently, we can't even sign on to "work towards" going zero-emissions


By Steve DaSilva


Photo: Ian Forsyth (Getty Images)


Right now, world leaders are gathered in Glasgow for the 26th running of the United Nations Climate Change Conference. COP26, as the cool kids are calling it, is focused around the radical idea that maybe we shouldn’t set the entire planet on fire to make a few incomprehensibly rich dudes slightly richer. The UN is aiming to make change through a series of vaguely-worded, entirely non-binding agreements, including one that sets a goal for new car sales to go zero-emission by 2040. It’s the absolute minimum a country can do, signing an agreement with no consequences for failure, but apparently still a bridge too far for the United States.


The declaration comes after over a week of panels, discussions, and agreements at the event. It’s specifically targeted at the automotive market, but not exclusive to consumer cars — fleets, both private and public, are included as well. From the full declaration:

A. As governments, we will work towards all sales of new cars and vans being zero emission by 2040 or earlier, or by no later than 2035 in leading markets.

B. As governments in emerging markets and developing economies, we will work intensely towards accelerated proliferation and adoption of zero emission vehicles. We call on all developed countries to strengthen the collaboration and international support offer to facilitate a global, equitable and just transition.

C. As cities, states, and regional governments, we will work towards converting our owned or leased car and van fleets to zero emission vehicles by 2035 at the latest, as well as putting in place policies that will enable, accelerate, or otherwise incentivise the transition to zero emission vehicles as soon as possible, to the extent possible given our jurisdictional powers.

D. As automotive manufacturers, we will work towards reaching 100% zero emission new car and van sales in leading markets by 2035 or earlier, supported by a business strategy that is in line with achieving this ambition, as we help build customer demand.

E. As business fleet owners and operators, or shared mobility platforms, we will work towards 100% of our car and van fleets being zero emission vehicles by 2030, or earlier where markets allow.

Notice how incredibly vague and non-binding all this language is. “Work towards,” “strengthen the collaboration,” “where markets allow.” There are no hard responsibilities, deadlines, or penalties to be seen anywhere in the document. “Working towards” a goal could mean nearly anything — our country can’t even commit to something that open-ended?

Thirty countries signed on to this declaration, including Britain, Canada, and India, as well as other nations from Europe and Africa. California and Washington State even signed on, doing on a state level what the federal government still refuses to do. The COP26 declarationi s already less stringent than California’s executive order on ICE vehicle sales, but sets a new bar for Washington.


Protesters, young enough to have to live through the consequences of climate change, protest outside COP26Photo: Jeff J Mitchell (Getty Images)

COP26 has been criticized and protested for its lax approach to making change. The conference aims to limit warming to 1.5 degrees Celsius, a temperature that will already irreparably change the planet’s climate, and analysts claim that these new climate pledges won’t even come close to halting things there. If we can’t even sign on to a declaration that’s so lax as to be entirely ineffective, what chance do we have at actually making the changes necessary to let the planet survive?
Six automakers agree to climate pledge but VW, Toyota hold back

Volvo, Ford, GM, Mercedes, Jaguar Land Rover will sign COP26 commitment


BLOOMBERG


GLASGOW -- A group of countries, companies and cities committed to phasing out fossil-fuel vehicles by 2040, as part of efforts to cut carbon emissions and curb global warming.

But the world's top two automakers, Toyota and Volkswagen, as well as major car markets China, the U.S. and Germany, did not sign up, highlighting the challenges in shifting to zero emissions.

Stellantis was also missing from the latest pledge, as were Honda, Nissan, BMW and Hyundai.


The Glasgow Declaration on Zero Emission Cars and Vans, unveiled on Wednesday at climate talks in the Scottish city, sees the groups pledge to "rapidly" accelerate the transition to low-carbon emissions vehicles.

Headline signatories included Ford and General Motors, the world's second-most populous country India and major corporate purchasers of vehicles including Leaseplan, which rents 1.7 million cars in 30 countries.

GM said it is "proud to now stand alongside other companies, governments and civil society organizations to support the declaration to commit to working towards a transition to 100 percent zero emissions vehicles by 2035."

Ford confirmed its participation and said: "It will take everyone working together to be successful."

Volvo, Mercedes-Benz, BYD and Jaguar Land Rover, were also set to sign the commitment.

Volvo has already committed to going all-electric by 2030. The Jaguar brand will become all-electric starting in 2025. Ford has said its passenger car fleet in Europe will be all-electric by 2030. Mercedes has said it will be ready to go all-electric at the end of the decade, where market conditions allow.

VW Group CEO Herbert Diess said the proposed phase-out of internal combustion engine cars by 2040 was "not doable."

"We need raw materials, new mines, a circular economy. Battery capacity and building renewable energy grids across Europe will be the bottleneck," Diess said Wednesday during an online conference organized by German newspaper Handelsblatt.

VW brand has so far committed to producing only full-electric vehicles in Europe from 2035, and having a CO2-neutral fleet globally by 2050.

Cars, trucks, ships, buses, and planes account for about a quarter of all global carbon emissions, data from the International Energy Agency showed, of which the bulk comes from road vehicles.

The apparent unwillingness of Germany, along with China, the world's largest car market, and the U.S. -- the world's largest economy and second-largest car market -- to join the pledge raises questions about its effectiveness.

A German environment spokesman said the country's government would not sign because it had not reached internal consensus on a "marginal aspect" of the pledge concerning whether fuels made from renewable energy but burned in a combustion engine could form part of the solution.

Sources said that while the U.S. is not joining the pledge, key car-buying states such as California and New York have signed up.

An auto industry source said some automakers are wary of the pledge because it commits them to a costly shift in technology but lacks a similar commitment from governments to ensure that the necessary charging and grid infrastructure would be built to support electric vehicles.

In the summer, the European Commission proposed an effective ban on fossil-fuel vehicles by 2035, accompanied by a commitment to charging infrastructure that automakers had demanded.