About 26,000 tonnes of plastic Covid waste pollutes world’s oceans – study
Increased demand for PPE has put pressure on an already out-of-control global problem, report finds
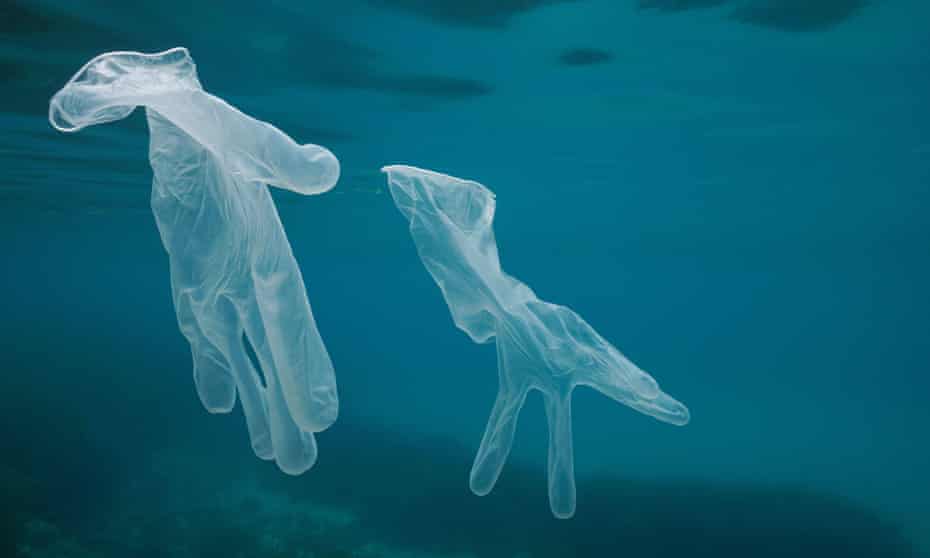
Increased use of personal protective equipment including gloves and masks during the pandemic has added to an existing problem of mismanaged plastic waste, the report found.
Photograph: Seaphotoart/Alamy
Mon 8 Nov 2021
Plastic waste from the Covid-19 pandemic weighing 25,900 tonnes, equivalent to more than 2,000 double decker buses, has leaked into the ocean, research has revealed.
The mismanaged plastic waste, consisting of personal protective equipment such as masks and gloves, vastly exceeded the capability of countries to process it properly, researchers said.
Covid has made us use even more plastic – but we can resetSince the beginning of the pandemic, an estimated 8.4m tonnes of plastic waste has been generated from 193 countries, according to the report, published on Monday.
“The Covid-19 pandemic has led to an increased demand for single-use plastics that intensifies pressure on an already out-of-control global plastic waste problem,” said Yiming Peng and Peipei Wu from Nanjing University, the authors of Magnitude and impact of pandemic-associated plastic waste published in the online journal PNAS.
“The released plastics can be transported over long distances in the ocean, encounter marine wildlife, and potentially lead to injury or even death,” they added.
A study in March presented the first case of a fish entrapped in a medical glove, encountered during a canal cleanup in Leiden, the Netherlands. In Brazil a PFF-2 protective mask was found in the stomach of a dead Magellanic penguin.
The scientists predicted that by the end of the century almost all pandemic-associated plastics will end up on either the seabed or on beaches.
The Chinese study found that 46% of the mismanaged plastic waste came from Asia, due to the high level of mask-wearing by individuals there, followed by Europe, 24%, and North and South America, 22%.
Peng and Wu said their research suggested 87.4% of the excess waste was from hospitals, rather than from individual use. PPE usage by individuals contributed only 7.6% of the total, while packaging and test kits accounted for 4.7% and 0.3% respectively.
“Most of the plastic is from medical waste generated by hospitals that dwarfs the contribution from personal protection equipment and online-shopping package material,” they wrote.
“This poses a long-lasting problem for the ocean environment and is mainly accumulated on beaches and coastal sediments.”
The thousands of tonnes of masks, gloves, testing kits and face visors which leached into the oceans from the start of the pandemic up to August this year, were transported in 369 major rivers.
Chief among these were Shatt al-Arab in south-eastern Iraq, which carried 5,200 tonnes of PPE waste to the ocean; the Indus river, which arises in western Tibet, carried 4,000 tonnes and the Yangtze river in China 3,700 tonnes. In Europe, the Danube carried the most plastic pandemic waste into the ocean: 1,700 tonnes.
The top 10 rivers accounted for 79% of pandemic plastic discharge, the top 20 for 91%, and the top 100 for 99%. About 73% of the discharge was from Asian rivers followed by European watercourses (11%), with minor contributions from other continents, the report said.
“These findings highlight the hotspot rivers and watersheds that require special attention in plastic waste management,” the authors said.
“We find a long-lasting impact of the pandemic-associated waste release in the global ocean. At the end of this century, the model suggests that almost all the pandemic-associated plastics end up in either the seabed (28.8%) or beaches (70.5%).”
The authors saidthe findings showed better medical waste management was needed in pandemic epicenters, especially in developing countries.
Plastic waste release caused by COVID-19 and its fate in the global ocean
Yiming Peng, Peipei Wu, Amina T. Schartup, and View ORCID Profile
Yanxu Zhang
See all authors and affiliations
PNAS November 23, 2021 118 (47) e2111530118; https://doi.org/10.1073/pnas.2111530118
Edited by B. L. Turner, Arizona State University, Tempe, AZ, and approved October 6, 2021 (received for review June 22, 2021)
Article
Figures & SI
Info & Metrics
Significance
Plastic waste causes harm to marine life and has become a major global environmental concern. The recent COVID-19 pandemic has led to an increased demand for single-use plastic, intensifying pressure on this already out-of-control problem. This work shows that more than eight million tons of pandemic-associated plastic waste have been generated globally, with more than 25,000 tons entering the global ocean. Most of the plastic is from medical waste generated by hospitals that dwarfs the contribution from personal protection equipment and online-shopping package material. This poses a long-lasting problem for the ocean environment and is mainly accumulated on beaches and coastal sediments. We call for better medical waste management in pandemic epicenters, especially in developing countries.
Abstract
The COVID-19 pandemic has led to an increased demand for single-use plastics that intensifies pressure on an already out-of-control global plastic waste problem. While it is suspected to be large, the magnitude and fate of this pandemic-associated mismanaged plastic waste are unknown. Here, we use our MITgcm ocean plastic model to quantify the impact of the pandemic on plastic discharge. We show that 8.4 ± 1.4 million tons of pandemic-associated plastic waste have been generated from 193 countries as of August 23, 2021, with 25.9 ± 3.8 thousand tons released into the global ocean representing 1.5 ± 0.2% of the global total riverine plastic discharge. The model projects that the spatial distribution of the discharge changes rapidly in the global ocean within 3 y, with a significant portion of plastic debris landing on the beach and seabed later and a circumpolar plastic accumulation zone will be formed in the Arctic. We find hospital waste represents the bulk of the global discharge (73%), and most of the global discharge is from Asia (72%), which calls for better management of medical waste in developing countries.
plastic
ocean
MITgcm
COVID-19
Plastics have an excellent strength to weight ratio, and they are durable and inexpensive, making them the material of choice for most disposable medical tools, equipment, and packaging (1, 2). The COVID-19 pandemic has demonstrated the indispensable role of plastic in the healthcare sector and public health safety (2). As of August 23, 2021, about 212 million people worldwide have been infected with the COVID-19 virus with the most confirmed cases in the Americas (47.6%) and Asia (31.22%) followed by Europe (17.26%) (3). The surging number of inpatients and virus testing substantially increase the amount of plastic medical waste (4). To sustain the enormous demand for personal protective equipment (PPE, including face masks, gloves, and face shields), many single-use plastic (SUP) legislations have been withdrawn or postponed (2). In addition, lockdowns, social distancing, and restrictions on public gathering increase the dependency on online shopping at an unprecedented speed, the packaging material of which often contains plastics (5, 6).
Unfortunately, the treatment of plastic waste is not keeping up with the increased demand for plastic products. Pandemic epicenters in particular struggle to process the waste (7), and not all the used PPEs and packaging materials are handled or recycled (8, 9). This mismanaged plastic waste (MMPW) is then discharged into the environment, and a portion reaches the ocean (10). The released plastics can be transported over long distances in the ocean, encounter marine wildlife, and potentially lead to injury or even death (11⇓⇓–14). For example, a recent report estimated that 1.56 million face masks entered the oceans in 2020 (15). Earlier studies have also raised the potential problem of COVID-19 plastic pollution and its impact on marine life (16⇓–18). Some cases of entanglement, entrapment, and ingestion of COVID-19 waste by marine organisms, even leading to death, have been reported (19, 20). The plastic debris could also facilitate species invasion and transport of contaminants including the COVID-19 virus (21⇓–23). Despite the potential impacts, the total amount of pandemic-associated plastic waste and its environmental and health impacts are largely unknown. Here, we estimate the amount of excess plastic released during the pandemic that enters the global ocean and its long-term fate and potential ecological risk.
Results
MMPW Generation.
As of August 23, 2021, the total excess MMPW generated during the pandemic is calculated as 4.4 to 15.1 million tons (Fig. 1). We use the average of scenarios with different assumptions as our best estimate (Methods), which is about 8.4 ± 1.4 million tons. A dominant fraction (87.4%) of this excess waste is from hospitals, which is estimated based on the number of COVID-19 inpatients (24) and per-patient medical waste generation for each country (25). PPE usage by individuals contributes only 7.6% of the total excess wastes. Interestingly, we find that the surge in online shopping results in an increased demand for packaging material. However, we find that packaging and test kits are minor sources of plastic waste and only account for 4.7% and 0.3%, respectively.

Download figure
Open in new tab
Download powerpoint
Fig. 1.
Global generation of mismanaged plastics from different sources (hospital medical waste, test kits, PPE, and online packaging) attributable to the COVID-19 pandemic. High- and low-yield scenarios are considered for each source (Methods).
Table 1 shows the distribution of COVID-19 cases across different continents (Asia, Europe, North America, South America, Oceania, and Africa). About 70% of COVID-19 cases are found in North and South America and Asia (Table 1). We find that MMPW generation does not follow the case distribution, as most MMPW is produced in Asia (46%), followed by Europe (24%), and finally in North and South America (22%) (Table 1 and Fig. 2E). This reflects the lower treatment level of medical waste in many developing countries such as India, Brazil, and China (range between 11.5 and 76% as the low- and high-end estimates) compared with developed countries with large numbers of cases in North America and Europe (e.g., the United States and Spain) (0 to 5%) (Fig. 2A). The MMPW generated from individual PPE is even more skewed toward Asia (Fig. 2C and SI Appendix, Table S1) because of the large mask-wearing population (26). Similarly, the MMPW generated from online-shopping packaging is the highest in Asia (Fig. 2D). For instance, the top three countries in the express-delivery industry of global share are China (58%), United States (14.9%), and Japan (10.3%) followed by the United Kingdom (4%) and Germany (4%) (27).
VIEW INLINE
VIEW POPUP
Table 1.
Percentage of the confirmed COVID-19 cases (as of August 23, 2021), the generated mass of pandemic-associated MMPW ending up in the environment, and the pandemic-associated MMPW that is transported to river mouths for different continents

Download figure
Open in new tab
Download powerpoint
Fig. 2.
Accumulated riverine discharge of pandemic-associated mismanaged plastics to the global ocean. Panels are for the discharges caused by (A) hospital medical waste, (B) COVID-19 virus test kits, (C) PPE, (D) online-shopping packaging material, and (E) the total of them. The background color represents the generated MMPW in each watershed, while the sizes of the blue circles are for the discharges at river mouths.
Riverine Discharge of MMPW.
Based on the MMPW production from each country and a hydrological model (28), we calculate a total discharge of 25.9 ± 3.8 (12.3 as microplastics [< 5 mm] and 13.6 as macroplastics [> 5 mm]) thousand tons of pandemic-associated plastics to the global ocean from 369 major rivers and their watersheds (Fig. 2E). We believe that the 369 rivers (account for 91% of the global riverine plastic discharge to the sea) considered here include a vast majority of the global pandemic-associated plastic discharge. The top three rivers for pandemic-associated plastic waste discharge are Shatt al Arab (5.2 thousand tons, in Asia), Indus (4.0 thousand tons, in Asia), and Yangtze River (3.7 thousand tons, in Asia) followed by Ganges Brahmaputra (2.4 thousand tons, in Asia), Danube (1.7 thousand tons, in Europe), and Amur (1.2 thousand tons, in Asia). These findings highlight the hotspot rivers and watersheds that require special attention in plastic waste management.
Overall, the top 10 rivers account for 79% of pandemic plastic discharge, top 20 for 91%, and top 100 for 99%. About 73% of the discharge is from Asian rivers followed by Europe (11%), with minor contributions from other continents (Table 1). This pattern is different from that of the generation of MMPW (Table 1) because of the different ability of rivers to export plastic load to the ocean, which is measured as the yield ratio (defined as the ratio between the plastic discharges at the river mouth and the total MMPW generation in the watershed). The yield ratio is influenced by factors such as the distribution of plastic release along rivers and the physical conditions of rivers (e.g., water runoff and velocity) (28). The top five rivers with the highest yield ratios are the Yangtze River (0.9%), Indus (0.5%), Yellow River (0.5%), Nile (0.4%), and Ganges Brahmaputra (0.4%). These rivers have either high population density near the river mouth, large runoff, fast water velocity, or a combination of them. The combination of high pandemic-associated MMPW generations and yield ratio for Asian rivers results in their high discharge of MMPW to the ocean.
The Fate of MMPW in the Ocean.
We simulate the transport and fate of the 25,900 ± 3,800 tons of pandemic-associated plastic waste by the Nanjing University MITgcm-Plastic model (NJU-MP) to evaluate its impact on the marine environment. The model considers the primary processes that plastics undergo in seawater: beaching, drifting, settling, biofouling/defouling, abrasion, and fragmentation (29). The model reveals that a large fraction of the river discharged plastics are transferred from the surface ocean to the beach and seabed within 3 y (Fig. 3). At the end of 2021, the mass fraction of plastics in seawater, seabed, and beach are modeled as 13%, 16%, and 71% respectively. About 3.8% of the plastics are in the surface ocean with a global mean concentration of 9.1 kg/km2. Our model also suggests that the discharged pandemic-associated plastics are mainly distributed in ocean regions relatively close to their sources, for example, middle- and low-latitude rivers distributed in East and South Asia, South Africa, and the Caribbean (Fig. 4 and SI Appendix, Fig. S2). The beaching and sedimentation fluxes are mainly distributed near major river mouths (Fig. 4 and SI Appendix, Fig. S2). This suggests that the short-term impact of pandemic-associated plastics is rather confined in the coastal environment.

Download figure
Open in new tab
Download powerpoint
Fig. 3.
Projection of the fate of discharged pandemic-associated plastics (including both microplastics and macroplastics) in the global ocean. (A) The mass fractions and average concentrations in the surface ocean. (B) The mass fractions in the seawater, seabed, and beaches.

Download figure
Open in new tab
Download powerpoint
Fig. 4.
Modeled spatial distribution of mass concentrations of COVID-19-associated plastics in the surface ocean (A–C, J–L), on the beaches (D–F, M–O), and the seabed (G–I, P–R) in 2021, 2025, and 2100, respectively. The black boxes on the Top panel indicate the five subtropical ocean gyres (North Pacific Gyre, North Atlantic Gyre, South Pacific Gyre, South Atlantic Gyre, and Indian Gyre). Panels A–I are for the microplastics, while J–R are for the macroplastics.
The model suggests the impact could expand to the open ocean in 3 to 4 y. The mass fraction of plastics in the seawater is predicted to decrease in the future while those in seabed and beach are modeled to gradually increase. At the end of 2022, the fractions of riverine discharged, pandemic-associated MMPW in seawater, seabed, and beach are modeled as 5%, 19%, and 76%, respectively, and the mean surface ocean concentration sharply decreases to 3.1kg/km2. In 2025, five garbage patches in the center of subtropic gyres merge, including the four in North and South Atlantic and Pacific and the one in the Indian Ocean (Fig. 4 and SI Appendix, Fig. S2). Hot spots for sedimentation fluxes are also modeled in the high-latitude North Atlantic and the Arctic Ocean in 2025 (Fig. 4 and SI Appendix, Fig. S2), reflecting the large-scale vertical movement of the seawaters (SI Appendix, Fig. S3).
We find a long-lasting impact of the pandemic-associated waste release in the global ocean. At the end of this century, the model suggests that almost all the pandemic-associated plastics end up in either the seabed (28.8%) or beaches (70.5%), potentially hurting the benthic ecosystems. The global mean pandemic-associated plastic concentrations in the surface ocean are predicted to decrease to 0.3 kg/km2 in 2100, accounting for 0.03% of the total discharged plastic mass. However, two garbage patches are still modeled over the northeast Pacific and the southeast Indian Ocean, exerting persistent risk for ecosystems over there. The fate of microplastics and macroplastics are similar but with a higher fraction of macroplastics ending up in the beaches due to their lower mobility (Fig. 4 and SI Appendix, Fig. S1).
The Arctic Ocean appears to be a dead-end for plastic debris transport due to the northern branch of the thermohaline circulation (30). About 80% of the plastic debris discharged into the Arctic Ocean will sink quickly, and a circumpolar plastic accumulation zone is modeled to form by 2025. In this year, the Arctic seabed accounts for 13% of the global plastic sedimentation flux, but this fraction will increase to 17% in 2100. The Arctic ecosystem is considered to be particularly vulnerable due to the harsh environment and high sensitivity to climate change (31, 32), which makes the potential ecological impact of exposure to the projected accumulated Arctic plastics of special concern.
Discussion
It is speculated that the pandemic will not be completely controlled in a couple of years, and many of the containing policies will continue to be implemented (33). By the end of 2021, it is conservatively estimated that the number of confirmed cases will reach 280 million (34). The generated pandemic-associated MMPW will reach a total of 11 million tons, resulting in a global riverine discharge of 34,000 tons to the ocean. The MMPW generation and discharge are expected to be more skewed toward Asia due to record-breaking confirmed cases in India (3). Given the linearity between the discharge and ocean plastic mass, the fate and transport of the newly generated plastic discharge can be deduced from our current results.
There are substantial uncertainties associated with our estimate of pandemic-associated MMPW release due to the lack of accurate data (e.g., the number of used masks and online-shopping packages and the fraction of mismanaged waste under the over-capacity conditions). For example, our estimate for the discharge from face mask usage is much lower than that of Chowdhury et al. (35), which assumes that a person uses a single mask daily while we assume a mask lasts for 6 d based on survey data (Methods). We thus consider multiple scenarios to cap the actual situations (Methods). The estimated MMPW as hospital medical waste varies by ±53%, while that from packaging and PPE vary by ±25% and a factor of ∼3.5, respectively. The estimated amounts of riverine MMPW discharge to the ocean have also uncertainty as they are based on a coarse resolution (i.e., watershed-wise) hydrological model (28). In addition, factors such as the fragmentation, abrasion, and beaching rate of plastics in NJU-MP also have a substantial influence on the simulation results (29). Despite these uncertainties, the spatial pattern of the pandemic-associated releases and their relative fate in different compartments of the ocean is more robust.
The pandemic-associated plastic discharge to the ocean accounts for 1.5 ± 0.2% of the total riverine plastic discharges (28, 36). A large portion of the discharge is medical waste that also elevates the potential ecological and health risk (37) or even the spreading of the COVID-19 virus (38). This offers lessons that waste management requires structural changes. The revoking or delaying of the bans on SUPs may complicate plastic waste control after the pandemic. Globally public awareness of the environmental impact of PPE and other plastic products needs to be increased. Innovative technologies need to be promoted for better plastic waste collection, classification, treatment, and recycling, as well as the development of more environmentally friendly materials (15, 39). Better management of medical waste in epicenters, especially in developing countries, is necessary.
READ ON HERE
No comments:
Post a Comment