Wednesday, August 11, 2021


Study finds high risk groups rejecting the COVID-19 vaccine in England

To increase COVID-19 vaccination rates, public health officials must understand who is refusing the vaccines. New research led by Ben Goldacre from the University of Oxford found that about 2% of people considered high-risk did not want the vaccine when offered. In addition, vaccination refusal in priority groups was most common among English people who are Black, South Asian, or from lower socioeconomic areas.

COVID-19 vaccines were offered to all patients in England within vaccine priority groups by mid-April 2021.

There is a concern of vaccine refusal from people labeled high-risk of contracting severe COVID-19 infection and who have a higher risk of dying from the disease. Also, the spreading of the coronavirus may heighten the chances of the virus festering and mutating in the body of an immunocompromised person — increasing the risk for a potentially new and dangerous variant.

The study “Recording of COVID-19 vaccine declined” among vaccination priority groups: a cohort study on 57.9 million NHS patients’ primary care records in situ using OpenSAFELY” is published on the medRxiv* preprint server.

Study details

The researchers collected medical records from 57.9 million patients to identify patients in vaccine priority groups who refused the vaccine.

As of May 25, 2021, there were 24.5 million patients who were considered vaccine priority groups. Of these, 89.2% reported getting a COVID-19 vaccine, and 8.8% did not report any information on vaccination status.

People considered clinically extremely vulnerable (4.4%) were among the highest to have a vaccine refusal on record. This was followed by people over 80 (3.4%) and people considered at risk (3%).

Black people over the age of 80 were more likely to refuse a vaccine (15.3%) compared to South Asians (5.6%) and White people (1.5%).

Some factors may have contributed to vaccine refusal. For example, the research team found that people with severe mental health conditions or a learning disability had low vaccination rates. People were also more likely to refuse a vaccine if they were pregnant compared to nonpregnant people at childbearing age.
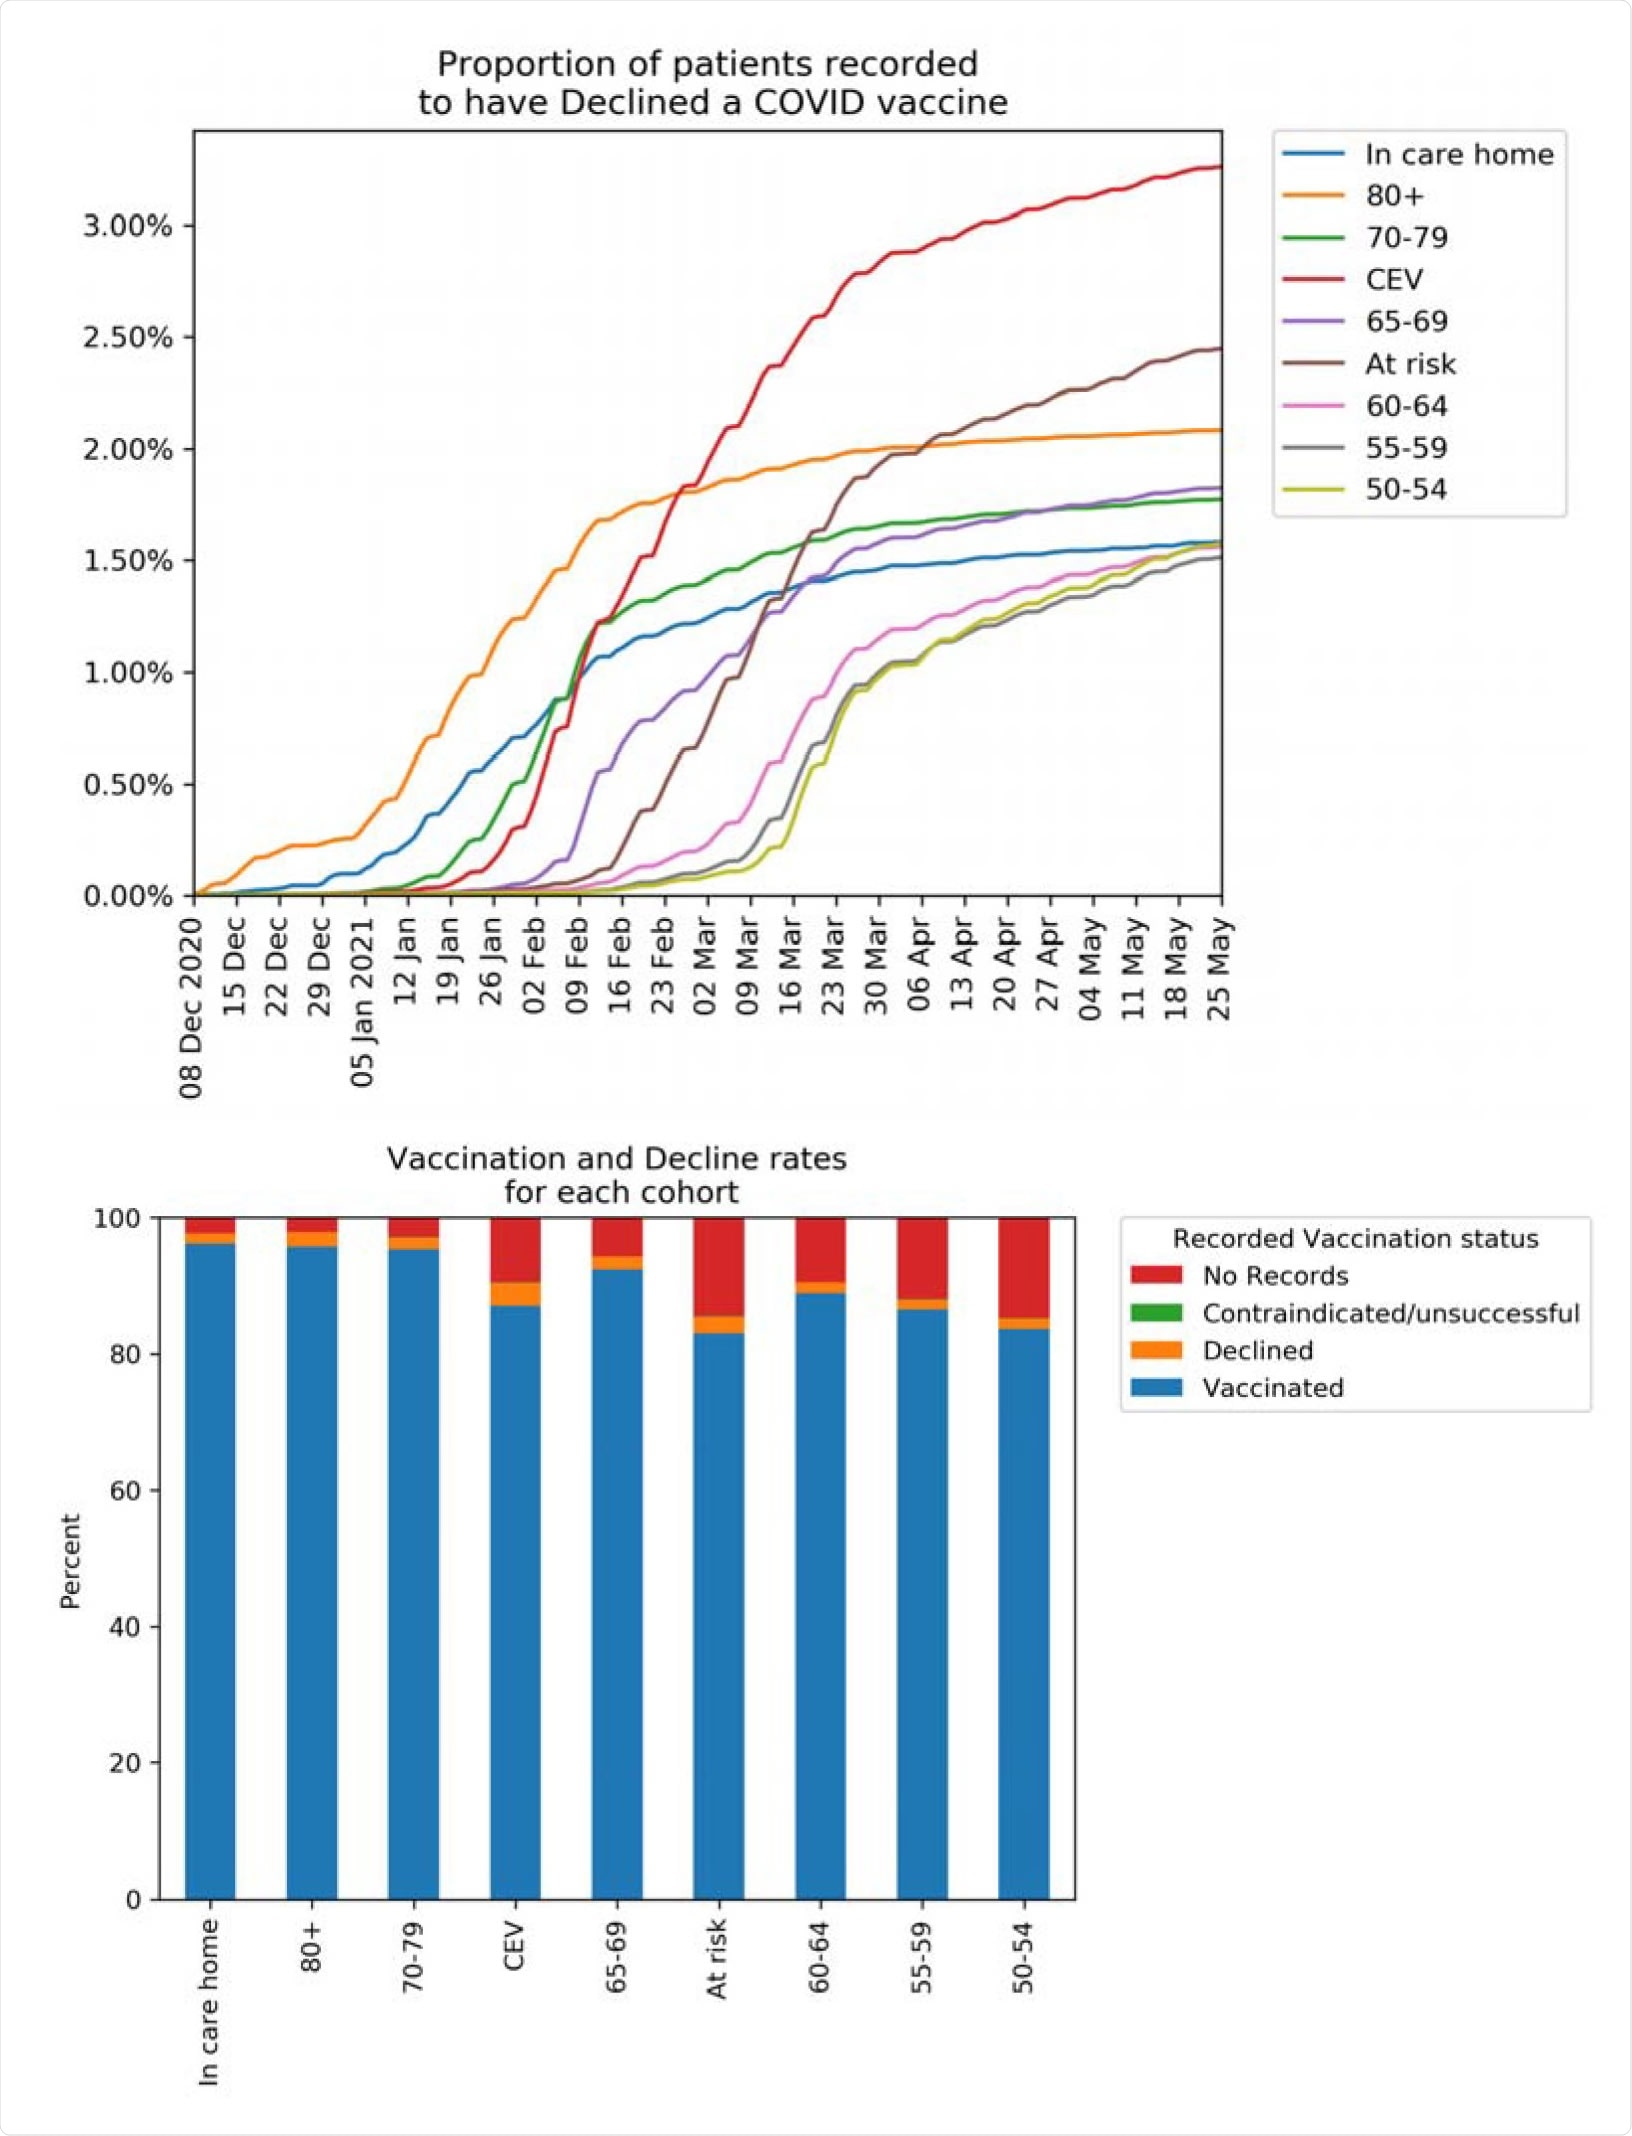
Recorded vaccination status of patients in OpenSAFELY up to May 25th 2021. (a) Cumulative percentage of patients in each priority group recorded as declining a COVID-19 vaccination and remaining unvaccinated. (b) Recorded COVID-19 vaccination status for patients by priority group. “Declined” excludes patients with a recorded vaccination. “Vaccinated” includes those previously recorded as declining.

About 18% of people who initially refused

 the vaccine changed their minds

About 2.7% stated that they declined the vaccine when it was offered to them. However, of the 2.7% who refused, 18.9% of these patients were later vaccinated.

Of the 18.9% who later became vaccinated, 13.1% were from the ‘At-Risk’ group and 30.7% in people over 80.

“As well as those who genuinely changed their mind, this will include some who always intended to be vaccinated, such as those who temporarily declined (eg. due to illness), rejected a repeated invitation after already booking a vaccine, or had a decline recorded in error or for administrative reasons,” explained the researchers.

The research team also noted that people who were later vaccinated might have changed their minds as more time passed and coronavirus information became more available.

Clinical coding of vaccine refusal across 

medical practices

Almost all medical practices in England have clinical codes to record whether someone has refused a vaccine. Results showed that almost every practice had at least one patient who refused the vaccine.

However, the team also found that the use of clinical codes varied across practices. Therefore, they suggest developing specific administrative codes specific to the COVID-19 vaccination campaign to help with recording patient data and for future booster shots.

“Until then, the limited number of available decline codes will inevitably be used in a broad range of individual patient situations, as such we recommend detailed survey and/or qualitative research with patients and NHS staff should be conducted to provide more descriptive information on how these codes are being used and shed light on the differences between groups,” concluded the researchers.

*Important Notice

medRxiv publishes preliminary scientific reports that are not peer-reviewed and, therefore, should not be regarded as conclusive, guide clinical practice/health-related behavior, or treated as established information.

Journal reference:
Jocelyn Solis-Moreira

Written by

Jocelyn Solis-Moreira

Jocelyn Solis-Moreira graduated with a Bachelor's in Integrative Neuroscience, where she then pursued graduate research looking at the long-term effects of adolescent binge drinking on the brain's neurochemistry in adulthood.

 APPLY THE WHIP SIR.

O'Toole says all Canadians should get a shot as Conservative MP calls mandatory vaccination 'tyrannical'

'Canadians deserve the right to liberty, whether they choose to be vaccinated or not,' MP David Yurdiga says THE RIGHT TO BE LEMMINGS

Conservative Leader Erin O'Toole reads from a teleprompter as he makes an announcement in Calgary on Thursday, July 8, 2021. (Jeff McIntosh/Canadian Press)

Conservative Leader Erin O'Toole said today that all Canadians should get vaccinated so that the country can turn the page on COVID-19 — but at least one member of his caucus is spoiling for a fight against efforts to make vaccines mandatory for federal public servants.

In a statement released late Tuesday, Conservative MP David Yurdiga, who represents Fort McMurray, Alta. in the Commons, said a government plan to study the value of making vaccination mandatory for federal bureaucrats was "another example of the Liberals using severe government overreach for political gain."

David Yurdiga, Conservative MP for Fort McMurray—Cold Lake attends the opening of the Fort Hills oilsands mine on Sept. 10, 2018. (David Thurton/ CBC)

Last week, Prime Minister Justin Trudeau directed the clerk of the Privy Council, the most senior public servant in Canada, to look into making vaccines mandatory for federal employees and those working in federally regulated sectors (airlines, banking, broadcasting and railways, among others) in an effort to boost stalled vaccination rates.

There are more than 300,000 federal public servants, and hundreds of thousands more people are working in industries that fall under the federal labour code.

Yurdiga said forcing these workers to get a vaccine is a "tyrannical" idea that should give all Canadians pause.

"Canadians deserve the right to liberty, whether they choose to be vaccinated or not. Mandating the vaccine as a requirement to work would be the beginning of a slippery slope," Yurdiga said.

The MP said such a policy would be discriminatory, punishing Canadians for "what they choose to do with their bodies."

Proponents of mandatory shots maintain it's the best way to develop herd immunity, protect the collective health of Canadians and rid the country of a very serious disease. Almost universal vaccine coverage has eradicated other diseases, such as polio and tetanus.

"It's time for people to get vaccinated, and for those who are hesitant to go and get their first and second doses," Trudeau said last week.

As the much more virulent delta strain of the virus takes hold in the U.S. and elsewhere, pushing case counts to levels not seen in months, a number of private companies and government departments already have said they will demand their employees either get a shot or find a new job.

While Canada has emerged as a world leader in vaccine coverage, there are still more than five million Canadians who haven't yet had at least one dose.

With a fourth wave of new infections poised to hit Canada in the coming weeks, experts say further boosting vaccine coverage will protect the country's health care system from again being overloaded with COVID-19 patients.

To date, the vast majority of new infections have been among the unvaccinated, even though they make up an increasingly smaller segment of the population.

There have been a number of "breakthrough" cases among the fully vaccinated but early data suggest those with two doses of a COVID-19 vaccine are much less likely to require hospitalization or die from the virus.

When asked to comment on Yurdiga's argument that mandatory shots would be "tyrannical," O'Toole was vague.

"I've been very clear — vaccines are the most critical tool in us fighting COVID-19. We encourage all Canadians to get vaccinated. It's actually why my wife and I took the unusual step of videotaping our own vaccinations," O'Toole said.

"I'd like to see everyone take a look at how safe and effective vaccines are for use. Let's all be part of the fight against COVID-19."

While Trudeau is floating the idea of mandatory vaccinations now, he hasn't always been keen on the idea. In January, in the early days of the immunization campaign, the prime minister said demanding that people get a shot would be a "divisive" approach to vaccination.

"There are a broad range of reasons why someone might not get vaccinated and I'm worried about creating knock-on, undesirable effects in our community," Trudeau told Reuters when asked about the prospect of a federal vaccine passport program.

"I think the indications that the vast majority of Canadians are looking to be vaccinated will get us to a good place without having to take more extreme measures that could have real divisive impacts on community and country."

O'Toole presents new plan to boost Canadian innovation

The Conservatives have long been critical of the government's vaccine procurement strategy, which relied entirely on foreign suppliers because the Canadian pharmaceutical industry has been hollowed out after years of cuts.

To boost innovation in this sector and others, O'Toole announced Wednesday that, if elected, a Conservative government would slash the income tax rate in half for new patented technologies developed in Canada. O'Toole said it would give Canadian tech companies some of the lowest tax rates in the world.

As part of O'Toole's COVID-19 recovery plan, a Conservative government would also establish the "Canadian Advanced Research Agency," a government body that would fund "major cutting-edge technologies" like carbon capture and storage, hydrogen fuel, small nuclear reactors, electric vehicle development and pharmaceutical research and production.

He also vowed to fix what he called the "broken" Scientific Research and Experimental Development (SR&ED) program, which provides companies with tax incentives to conduct research and development (R&D) in Canada.

In 2019, the program provided $3 billion in tax incentives to over 20,000 claimants but O'Toole said the current regime is an "administrative nightmare" that "fuels consultants and advisory firms instead of R&D."

"Make no mistake, the next great breakthrough — and the one after that — will come from right here in Canada," O'Toole said.

ABOUT THE AUTHOR

John Paul Tasker

Parliamentary Bureau

John Paul (J.P.) Tasker is a reporter in the CBC's Parliamentary bureau in Ottawa. He can be reached at john.tasker@cbc.ca.

Welcome to the ‘plastisphere’: the synthetic ecosystem evolving at sea

Ocean plastic has created a unique home for specialised organisms, from animals that travel on it to bacteria that ‘eat’ it


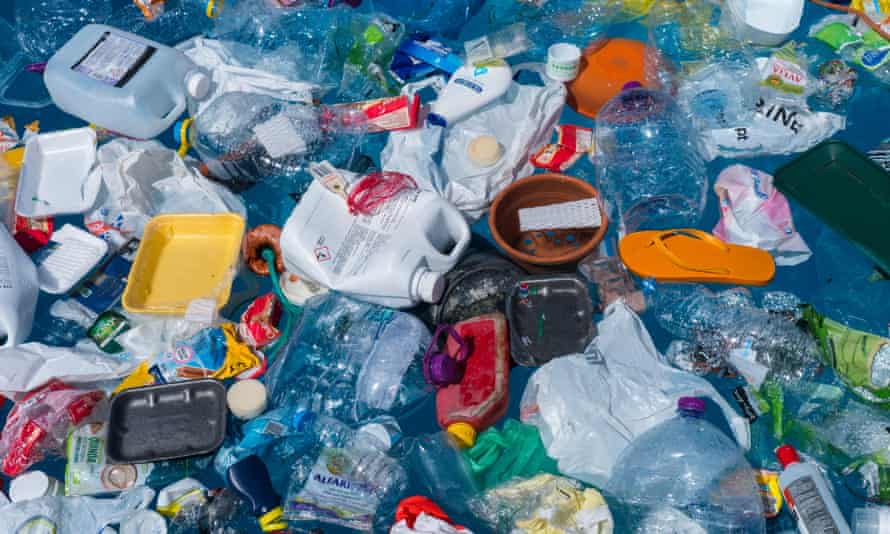
Plastic floating in the ocean. An estimated 1m plastic bottles 
reach the sea every minute. 
Photograph: Paulo Oliveira/Alamy


Russell Thomas
Wed 11 Aug 2021 

Plastic bottles dominate waste in the ocean, with an estimated 1m of them reaching the sea every minute. The biggest culprit is polyethylene terephthalate (Pet) bottles.

Last month, a study found two bacteria capable of breaking down Pet – or, as the headlines put it, “eating plastic”. Known as Thioclava sp. BHET1 and Bacillus sp. BHET2, the bacteria were isolated in a laboratory – but they were discovered in the ocean.

The bacteria are the latest example of new organisms that appear to be growing in a unique environment: the vast amounts of plastic at sea.

Like the atmosphere, magnetosphere and hydrosphere, the plastisphere is a region. But it is also an ecosystem, like the Siberian steppe or coral reefs – a plasticised marine environment. The best-known concentration of seaborne plastic waste is the Great Pacific garbage patch, a sort of plastic soup spread over an area roughly twice the size of France, but plastic is everywhere.

First described in a 2013 study to refer to a collective of plastic-colonising organisms, including bacteria and fungi, the term has since expanded. It now loosely encompasses larger organisms, from crabs to jellyfish, which raft across oceans on marine plastics.

The term was coined by Linda Amaral-Zettler, a marine microbiologist at the Royal Netherlands Institute for Sea Research.


Plastic rafting: the invasive species hitching a ride on ocean litter


“In 2010, we were planning to collect plastic samples for an upcoming cruise to characterise the biofilms [organisms that stick to each other and other things] on plastic,” says Amaral-Zettler. “I was trying to think of a convenient term to describe the community and came up with […] ‘plastisphere’.”

Although the term may be recent, the phenomenon is not. “The plastisphere has been around for as long as plastic has existed,” Amaral-Zettler says.

What is new is our understanding of just how complex an ecosystem the world of plastic can be. In the plastisphere there are organisms that photosynthesise; there are predators and prey; symbionts and parasites, allowing for “a full gamut of interactions possible, as in other ecosystems”, says Amaral-Zettler.

“If we take the definition of an ecosystem as ‘a biological community of interacting organisms and their physical environment’, then this is almost certainly true of the plastisphere,” says Robyn Wright, of the pharmacology department at Dalhousie University in Canada, and author of the June study.

Another unique feature of the plastisphere is that humans invented it. Every other ecosystem has evolved over millions of years. The meaning of that is not yet clear.

“I don’t think it’s necessarily important that it’s not natural in origin, because all of the members of the plastisphere are still ‘natural’, but it’s more an issue of scale,” Wright says. Unlike most naturally occurring materials, plastic is highly durable and persistent, allowing the growth and spread of attached organisms over a massive area.
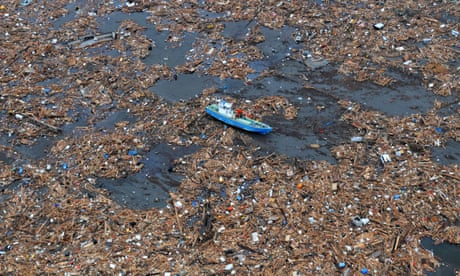
Plastic waste floating off the French coast. 
Photograph: Boris Horvat/AFP/Getty Images

Additionally, a study last year discovered that certain colours of plastic affected the diversity of the microbes colonising them: communities on blue microplastics had a richer diversity than those on yellow or transparent plastics.

There are also concerns about plastic-colonising organisms that can travel around the world. Amaral-Zettler’s 2013 study discovered Vibrio, a type of bacteria known to contain several species of pathogens, including some associated with gastroenteritis.

Though there is potential for the plastisphere to harbour pathogens, Wright is sceptical. “There isn’t really any concrete proof that plastics pose any more danger than any other surface that bacteria colonise, or any other area of the environment,” she says.

For the scientists, the plastisphere’s sheer presence is a less obvious concern than its potential health hazards. Most plastic ends up in landfill, but nearly a third of it ends up in the sea. The majority sinks, but a lot does not, becoming a home for all sorts of microbes that might not otherwise have a home.

The bacteria move in because when plastics are submerged in water they attract carbon, iron, nitrogen and phosphorus, which in turn attracts microbes. This is sometimes called the Zobell effect, after the marine microbiologist Claude E ZoBell.
[Microbes on] plastics are going to be the key place to look in the fight against plasticRobyn Wright, researcher

What happens then is largely unknown.

“At the moment that’s still very much an active area of research,” Wright says. There are two main fields of investigation: potential pathogens in the plastisphere, and the potential for some microbes to biodegrade hydrocarbons, such as the plastic-eaters identified last month.

Those are not unique to the ocean. In 2016, scientists in Japan discovered Ideonella sakaiensis, a species of bacteria at a rubbish tip that had evolved an enzyme that enabled it to eat plastic.

But another study in the same year found that, compared with bacteria in the surrounding waters, those in the plastisphere possessed an enriched collection of genes, suggesting that they had adapted for a “surface-attached lifestyle”.

Scientists caution that it’s important not to think of these as recent mutants.

“While plastics are a relatively new material on an evolutionary timescale, the chemicals that they’re made from aren’t new – mainly constituents of oil,” Wright says. “Bacteria have therefore had millions of years to develop mechanisms to degrade the chemicals that they’re made from.”

Could the plastisphere evolve in such a way that bacteria would essentially eat it, or at least help us identify ways to break down our plastic waste? “I’d definitely agree that [microbes on] plastics are going to be the key place to look in the fight against plastic,” says Wright.

Ideonella sakaiensis is a recently discovered bacterium that has the potential to ‘eat’ plastic waste. Illustration: Dr_Microbe/Getty/iStockphoto


But though Amaral-Zettler admits that some microbes can indeed feed off already UV-degraded plastic, she cautions against overstating the possibilities.

“It is important to realise that studies that look at plastic-‘eating’ bacteria only provide these bacteria with a single source of carbon,” she says. “This is in contrast to what is found in nature.”

Lab studies also do not take into account oceanic conditions, explains Wright, such as different temperatures, weather or the presence of other organisms. “But,” she adds, “even just knowing that this is theoretically possible is a really great step in the right direction.”

Just like our own gastrointestinal microbiome, which is massively important to our overall health, the plastisphere’s microbiome also has “an important role to play”, says Amaral-Zettler. Since we have modified our planet to the extent that these microbes have evolved to fit our plasticised oceans, understanding the new ecosystem we seem to have accidentally created is crucial.

“For better or for worse, like plastic,” she says, “the plastisphere is here to stay.”
IPCC 
Analysis: What the new IPCC report says about when world may pass 1.5C and 2C

ZEKE HAUSFATHER
10.08.2021
 
The Intergovernmental Panel on Climate Change’s (IPCC) sixth assessment report (AR6) is the first major IPCC review to specifically focus on when the world might pass the 1.5C and 2C warming levels.

AR6 uses a combination of historical observations, climate models and an updated estimate of climate sensitivity to provide a best-estimate that the world will pass – or temporarily “reach” – 1.5C somewhere between 2030 and 2035, depending on the future emissions scenario.

Even in the most stringent mitigation scenario examined in the report – SSP1-1.9 – the world exceeds 1.5C in most models during the middle of the 21st century, before falling back down below 1.5C by 2100 due to the large-scale deployment of negative emissions technologies (for more details on the Shared Socioeconomic Pathways (SSPs) used in the AR6, read Carbon Brief’s explainer).

The date that the world is expected to pass 1.5C is in “the early part of the range” suggested in Chapter 1 of the IPCC’s 2018 special report on 1.5C (SR15), due to a combination of revisions to historical temperature records and higher near-term warming projections. However, a separate, more directly comparable estimate found in Chapter 2 of the SR15 report is nearly identical to the new AR6 estimates.

The world is expected to pass 2C in emissions scenarios that do not feature strong near-term mitigation with a best-estimate of between the early 2040s and the early 2050s. These – and the 1.5C exceedance dates – are quite similar to those given in an earlier Carbon Brief analysis published in late 2020.

AR6 has also updated the remaining “carbon budget” that can be emitted before the world is committed to 1.5C or 2C of warming.

The carbon budget for a 50% chance to limit warming to 1.5C is quite similar to that given in the SR15 report. It shows that the world can emit around 460bn tonnes of CO2 (GtCO2) – or just 11.5 years of current (2020) emissions – after 1 January 2021 before being committed to 1.5C.

The carbon budgets for limiting warming to 1.5C with a 66% chance has been slightly increased due to the narrower range of climate sensitivity in the AR6. The remaining carbon budget to limit warming to 2C is similarly affected.

In addition, the report introduces new carbon budgets for limiting warming to 1.7C, as well as for limiting to each temperature with higher (83%) or lower (17%) probability.

The narrower range of future projected warming in the AR6 compared to past IPCC reports – coupled with more historical observations over the past few years – provides a better sense of when these important warming levels may be exceeded.
When will the world pass 1.5C?

AR6 focuses in some depth on when the world might pass 1.5C and 2C warming levels relative to the pre-industrial period. The authors suggest that the world is likely to pass 1.5C in the early 2030s, in the absence of rapid emissions mitigation. This is in the earliest part of the 2030-52 range reported in the SR15 summary for policymakers (SPM).

The 1.5C and 2C warming levels are noteworthy in part because they reflect the targets set in the Paris Agreement. However, Paris targets specifically refer to end-of-century warming outcomes, so scenarios such as SSP1-1.9 – which overshoot 1.5C mid-century before reducing temperatures back down through a large-scale deployment of negative emissions – are nominally consistent with Paris goals, even if they may exceed 1.5C during the 21st century.

(See Carbon Brief’s Q&A on the IPCC report for an introduction to the scenarios used by the IPCC, or Carbon Brief’s explainer for more details.)

Calculating when the world exceeds a particular temperature threshold is not a straightforward exercise. Global average surface temperatures in any given year are driven by a combination of long-term warming and short-term natural variability. The latter – driven by El Niño and La Niña events or volcanic eruptions – can result in a year being up to 0.2C warmer or cooler than the trajectory of long-term human-caused warming. This means it is quite possible for humans to have only warmed the world by 1.3C – only slightly above today’s level – and see a single year that exceeds 1.5C. In fact, the World Meteorological Organization estimated last year that there is a one-in-four chance that the world will exceed 1.5C for at least one year by 2025.

The international community of researchers and policymakers is more concerned with the effects of long-term human-caused warming than short-term natural variability. Because of this, passing the 1.5C and 2C limits has generally been defined based on a multi-year average rather than a single year, though there is no clear agreed-upon approach.

To avoid the problem of over-interpreting short-term variability, the AR6 authors calculate the 20-year periods where the average temperature reaches 1.5C (or 2C) warming above pre-industrial levels.

For example, in the SSP2-4.5 scenario, they find that 2021-40 is the first 20-year period when the average is most likely to exceed 1.5C. This formulation is a bit confusing – in order to simplify it (and compare it to other approaches) Carbon Brief uses the mid-point of the 20-year period (for example, 2030 in the case of a 2021-40) as the likely point at which the longer-term average temperature exceeds 1.5C, following the approach used in Chapter 4 of the AR6. This generally provides a good estimate of the likely exceedance year, though may be slightly off in cases where the rate of warming changes significantly over the course of the 20-year period (for example, in very high emissions scenarios).

Both the SR15 report and a 2020 analysis by Carbon Brief used a somewhat different approach; rather than looking at 20-year averages, these methods smoothed the data to remove short-term temperature variability before calculating the likely exceedance year. Carbon Brief used the new CMIP6 models, while the SR15 Chapter 1 assessment simply extrapolated historical warming trends and uncertainties into the future. AR6, on the other hand, uses its own assessed warming range based on CMIP6 models constrained by both observations and climate sensitivity estimates.

The SR15 report actually included two separate assessments of when the world might pass 1.5C. Chapter 1 of the report suggested that the world would pass 1.5C somewhere between 2030 and 2052, adding that there was stronger evidence to support the early part of this range.

Range of possible 1.5C exceedance years from Chapter 1 and Chapter 2 of the IPCC SR15 report (grey bar and dots, respectively), as well as AR6 and Carbon Brief exceedance year estimates for each of the SSPs. Dots represent central estimates (when available), while bars represent the very likely (5–95%) range. 20-year average periods in the AR6 are converted to expected exceedance years by taking the midpoint of the range. Note that bars extending to the top of the graph represent cases where the uncertainty range encompases outcomes that never exceed 1.5C. Chart by Carbon Brief using Highcharts

The Chapter 1 text did not give a central estimate, but did include a figure, showing the world passing 1.5C around 2040. This was based on an assumed continuation of the (at the time) historical warming trend of 0.2C per decade.

However, this value underestimates both recent observed warming trends (in part due to corrections to observational temperature records in the years since the publication of the SR15) and is lower than the near-term warming projections in most of scenarios evaluated in the SR15 report (and those in the new AR6).

In addition, deep in the supplementary materials of Chapter 2 of the SR15 report was an estimate (in Table 2. SM.12) that a 1.5C low overshoot scenario (similar to the SSP1-1.9 scenarios) would pass 1.5C around 2035. It suggested that well-below 2C scenarios (similar to SSP2-2.6) would pass 1.5C around 2033. These values are nearly identical to the best estimates in the new IPCC report, though because they were not highlighted in the main text, this was not widely understood at the time.

The figure below shows the main SR15 projection of 1.5C exceedance times (grey bar), along with the new AR6 likely exceedance year (and uncertainty ranges) for each of the new SSP scenarios. In addition, Carbon Brief’s estimates of when the world might pass 1.5C are shown alongside the new IPCC projections for comparison purposes.
Range of possible 1.5C exceedance years from Chapter 1 and Chapter 2 of the IPCC SR15 report (grey bar and dots, respectively), as well as AR6 and Carbon Brief exceedance year estimates for each of the SSPs. Dots represent central estimates (when available), while bars represent the very likely (5–95%) range. 20-year average periods in the AR6 are converted to expected exceedance years by taking the midpoint of the range. Note that bars extending to the top of the graph represent cases where the uncertainty range encompases outcomes that never exceed 1.5C. Chart by Carbon Brief using Highcharts.

The new AR6 values are notably in the earliest part of the range given by SR15 Chapter 1. The AR6 estimates that the world will pass 1.5C around 2030 under a moderate emissions scenario (SSP2-4.5), whereas SR15 gave a range of 2030-52.

However, as mentioned above, the AR6 numbers are in line with those in the SR15 Chapter 2 supplementary materials. More broadly, the AR6 finds a best-estimate exceedance year of 2027-35 across all of the models examined, albeit with a wide uncertainty range for each. In scenarios without rapid mitigation, the world is very likely to exceed 1.5C in the late 2030s (SSP5-8.5) or mid-2040s (SSP2-4.5) at the latest.

The new AR6 central estimates of when the world will likely pass 1.5C are generally quite similar to Carbon Brief’s 2020 analysis, though are, on balance, a few years earlier. More importantly, the uncertainty range in the AR6 is considerably larger, suggesting that the long-term average temperature may pass 1.5C as early as 2020 or 2021.

However, passing 1.5C this early is a very unlikely outcome given observed temperatures today. These early potential exceedance dates are likely something of an artifact of model-observation mismatches after the 1995-2014 normalisation periods – where models and observations are matched in the AR6. Carbon Brief’s earlier analysis, by contrast, used model projections from 2020 onwards based on a best-estimate of the human contribution to warming.

Crossing 2C

In addition to 1.5C exceedance years, the AR6 report provides estimates of when the world may pass 2C warming relative to pre-industrial levels. These are shown for each SSP scenario expected to pass 2C in the figure below, alongside Carbon Brief’s own estimates. Note that SSP1-1.9 and SSP2-2.6 are excluded as temperatures are unlikely to exceed 2C in most models under these scenarios.

Range of possible 2C exceedance years in the AR6 and Carbon Brief’s 2020 analysis. Dots represent central estimates (when available), while bars represent the very likely (5–95%) range. 20-year average periods in the AR6 are converted to expected exceedance years by taking the midpoint of the range. Chart by Carbon Brief using Highcharts.

Range of possible 2C exceedance years in the AR6 and Carbon Brief’s 2020 analysis. Dots represent central estimates (when available), while bars represent the very likely (5–95%) range. 20-year average periods in the AR6 are converted to expected exceedance years by taking the midpoint of the range. Chart by Carbon Brief using Highcharts.

AR6 finds that in the modest-mitigation SSP2-4.5 scenario the world is likely to exceed 2C around 2052, with a range of 2037 to 2084. For the high emissions SSP3-7.0 scenario, the world is likely to pass 2C around 2046 (with a range of 2035-2062), while in the very high emissions SSP5-8.5 scenario it is 2041 (with a range of 2032 to 2053).

These values are effectively identical to Carbon Brief’s earlier estimates, except for a wider range of possible later exceedance dates in SSP2-4.5 and SSP3-7.0. This may reflect differences between the unweighted CMIP6 models used by Carbon Brief and the assessed warming range in the AR6.

The results of the new AR6 report are clear: the best estimate is that the world will pass 1.5C in the 2030s, even under the rapid mitigation scenarios of SSP1-1.9 and SSP1-2.6. However, there is still a chance in these scenarios that the world will not pass 1.5C, particularly under the SSP1-1.9 scenario and if sensitivity of the climate to CO2 and other greenhouse gas emissions is on the low end of the range assessed in the AR6 report.

In the SSP1-1.9 scenario, the best estimate is that the world will overshoot 1.5C in the middle of the 21st century – warming by 1.6C relative to pre-industrial levels – before temperatures fall back down to below 1.5C by 2100 through the widespread use of negative emissions technologies.

The world is unlikely to warm more than 2C in either of the deep mitigation scenarios. In the other three scenarios examined, however, the best estimate is that the world will pass 2C somewhere between the early 2040s and early 2050s.
Updates to the remaining carbon budget

The year in which the world will exceed 1.5C and 2C warming levels is a related, but somewhat separate, question from the remaining carbon budget.

Carbon budgets are a simplified way to measure the maximum emissions that can still enter the atmosphere if the world wishes to limit global warming to levels such as 1.5C. They are based on the fact that the amount of warming that will occur can be approximated by total – that is, cumulative – CO2 emissions.

In practice, though, carbon budgets mask a lot of complexity. Because the world is already most of the way to 1.5C of warming, the remaining budget is relatively small and, therefore, quite sensitive to the approach used. The 2018 SR15 report significantly expanded the carbon budget, relative to what was reported in the IPCC fifth assessment report (AR5) in 2013-14. This was primarily due to the use of observations rather than climate model projections to estimate historical warming; for more technical details see this Carbon Brief analysis.

AR6 used a broadly similar approach to that of the SR15 (Chapter 2) to calculate the remaining budget and generally obtained similar results. The figure below shows the remaining carbon budgets for both a 50% chance and a 66% chance of avoiding more than 1.5C warming above pre-industrial levels from the SR15 and the AR6, as of 1 January 2021.

These are calculated by subtracting observed global emissions (as reported by the Global Carbon Project) over the 2018-20 period from the SR15 budget (which gives the remaining allowable budget starting in 2018) and by subtracting observed 2020 emissions from the AR6 budget (which provides a budget starting in 2020).
Remaining carbon budgets for a 50% and 66% chance of avoiding more than 1.5C warming as of January 1st 2021. Published budgets have been adjusted using observed CO2 emissions from the Global Carbon Project. Chart by Carbon Brief using Highcharts.

Remaining carbon budgets for a 50% and 66% chance of avoiding more than 1.5C warming as of January 1st 2021. Published budgets have been adjusted using observed CO2 emissions from the Global Carbon Project. Chart by Carbon Brief using Highcharts.

Both the SR15 and AR6 suggest that the world has around 460GtCO2 remaining in the 1.5C budget for a 50% avoidance chance. This means that the remaining carbon budget would be fully exhausted in just 11.5 years of current (2020) emissions – and less than that if global emissions rebound (as expected) in 2021 and do not decrease over the next decade. For example, the carbon budget would be used up in 10.7 years if emissions continued at 2019 levels. This would result in a world committed to a 1.5C temperature increase around 2031 – quite similar to the best estimate exceedance dates found in the AR6 discussed above.

For a 66% chance of limiting warming to 1.5C, AR6 reports that the world has a remaining carbon budget of 360GtCO2 – or nine years of current emissions.

This is a notable increase from the SR15 carbon budget of 295GtCO2. This increased carbon budget for a 66% avoidance chance reflects a narrower transient climate response to cumulative carbon emissions (TCRE) value calculated in the AR6 report (1C to 2.3C per 1000 gigatons of carbon – GtC) than in the SR15 (0.8C to 2.5C per 1,000GtC), resulting from the narrower estimate of climate sensitivity in the AR6. This TCRE revision does not affect the 50% avoidance chance as the best-estimate of TCRE is unchanged at 1.65C per 1,000GtC.


Methodological changes


A number of other important elements were updated in the AR6 carbon budget calculations.

First, updated temperature records were used that moved the world a bit closer to 1.5C than was assumed in the SR15 report, which, all things being equal, would result in a lower carbon budget. However, in the SR15 report the global surface air temperature (GSAT) was assumed to be warming faster than the global mean surface temperature (GMST), resulting in a smaller carbon budget.

(GMST is the standard metric used when discussing historical, observation-based recordings. It is based on a combination of land-surface air temperatures from weather stations and the sea surface temperature, measured using buoys and ships. It is subtly different from GSAT, which is generally used by climate models. It is also based on land surface air temperatures, but this is combined with temperatures of the air above seawater, rather than of the seawater itself.)

AR6 – based on more recent studies – found more limited evidence for this assumption, and did not assume any difference between GSAT and GMST. This change largely counterbalanced the reduction in the carbon budget associated with updated temperature records, resulting in a 50% avoidance budget nearly identical to that of the SR15.

The SR15 report suggested that unrepresented Earth system feedbacks – such as thawing permafrost – could result in a reduction of remaining carbon budgets of up to 100GtCO2 over the course of this century – and these were not included in the remaining carbon budgets numbers. The AR6 lowers this estimate of Earth system feedbacks to 26GtCO2 (albeit with an uncertainty of ±97GtCO2) and includes these feedbacks in its carbon budget numbers – while acknowledging that there is still low confidence in the exact magnitude of these estimates.
Carbon budget for 2C

In addition to remaining carbon budgets for 1.5C, both the SR15 and AR6 provide carbon budgets for 2C. These are shown – calculated as starting in 2021 – in the figure below.Remaining carbon budgets for a 50% and 66% chance of avoiding more than 2C warming as of January 1st 2021. Published budgets have been adjusted using observed CO2 emissions from the Global Carbon Project. Chart by Carbon Brief using Highcharts.

AR6 slightly reduces the remaining carbon budget for a 50% chance of avoiding 2C, relative to that in the SR15 – from 1,375GtCO2 (or 34 years of current emissions) to 1,310

GtCO2 (or 33 years of current emissions). This suggests that the world will exhaust its remaining 2C carbon budget around 2053 if current emissions continue – quite similar to the 2052 exceedance year in the modest mitigation SSP2-4.5 scenario discussed earlier.

For a 66% chance of avoiding 2C warming – which is how the Paris Agreement goal of limiting warming to well-below 2C is commonly interpreted – AR6 has slightly increased the remaining carbon budget from 1,045GtCO2 (26 years of current emissions) to 1,110GtCO2 (28 years of current emissions). This reflects the updated TCRE values in the AR6 compared to the SR15 report.

Overall, both the exceedance years and carbon budgets reported in the AR6 are similar to values reported in the SR15 report – despite notable updates to the models used for calculating exceedance years and the approach used for calculating carbon budgets. The AR6 exceedance estimate of around 2030 is in the earliest part of the range reported by Chapter 1 of SR15 but is very similar to the values reported in the supplementary materials of the SR15.