Wednesday, September 01, 2021


Hurricane Ida turned into a monster thanks to a giant warm patch in the Gulf of Mexico

Hurricane Ida turned into a monster thanks to a giant warm patch in the Gulf of Mexico – here's what happened
A computer animation reflects the temperature change as eddies spin off from the Loop 
Current and Gulf Stream along the U.S. Coast. Credit: NASA/Goddard Space Flight Center Scientific Visualization Studio

As Hurricane Ida headed into the Gulf of Mexico, a team of scientists was closely watching a giant, slowly swirling pool of warm water directly ahead in its path.

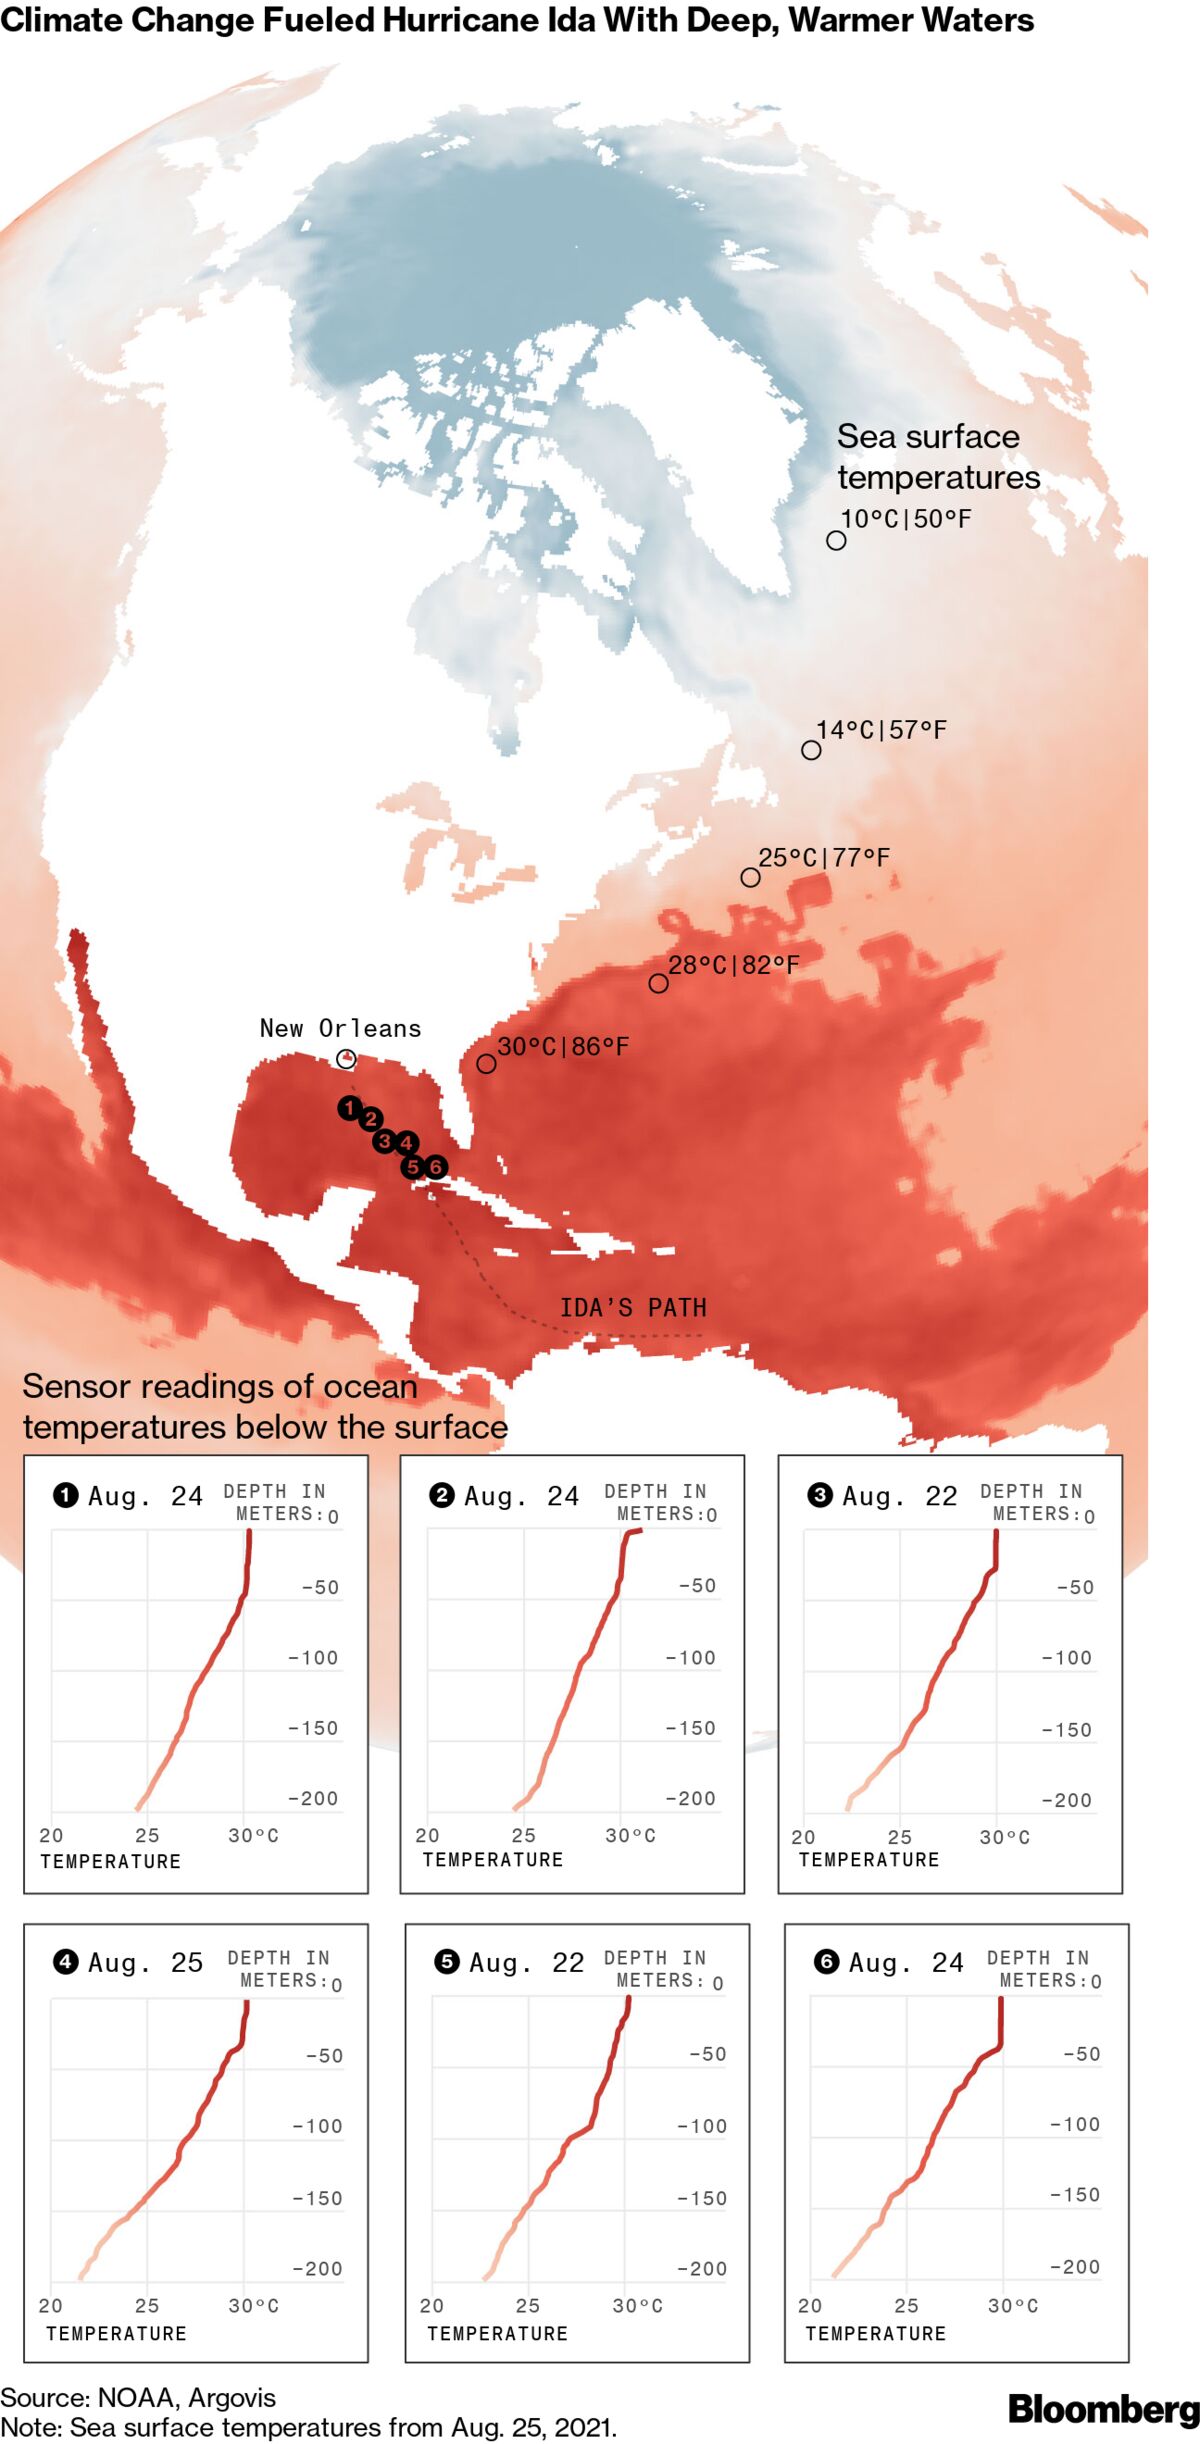
That warm pool, an eddy, was a warning sign. It was around 125 miles (200 kilometers) across. And it was about to give Ida the power boost that in the span of less than 24 hours would turn it from a weak  into the dangerous Category 4 storm that slammed into Louisiana just outside New Orleans on Aug. 29, 2021.

Nick Shay, an oceanographer at the University of Miami's Rosenstiel School of Marine and Atmospheric Sciences, was one of those scientists. He explains how these eddies, part of what's known as the Loop Current, help storms rapidly intensify into monster hurricanes.

How do these eddies form?

The Loop Current is a key component of a large gyre, a circular current, rotating clockwise in the North Atlantic Ocean. Its strength is related to the flow of warm  from the tropics and Caribbean Sea into the Gulf of Mexico and out again through the Florida Straits, between Florida and Cuba. From there, it forms the core of the Gulf Stream, which flows northward along the Eastern Seaboard.

In the Gulf, this current can start to shed large warm eddies when it gets north of about the latitude of Fort Myers, Florida. At any given time, there can be as many as three warm eddies in the Gulf. The problem comes when these eddies form during hurricane season. That can spell disaster for coastal communities around the Gulf.

Subtropical water has a different temperature and salinity than Gulf common water, so its eddies are easy to identify. They have warm water at the surface and temperatures of 78 degrees Fahrenheit (26 C) or more in water layers extending about 400 or 500 feet deep (about 120 to 150 meters). Since the strong salinity difference inhibits mixing and cooling of these layers, the warm eddies retain a considerable amount of .

When heat at the  is over about 78 F (26 C), hurricanes can form and intensify. The eddy that Ida passed over had surface temperatures over 86 F (30 C).

Hurricane Ida turned into a monster thanks to a giant warm patch in the Gulf of Mexico – here's what happened
The Loop Current runs from the tropics through the Caribbean and into the Gulf of Mexico, 
then joins the Gulf Stream moving up the East Coast. Credit: NASA/Goddard Space Flight Center Scientific Visualization Studio

How did you know this eddy was going to be a problem?

We monitor ocean heat content from space each day and keep an eye on the ocean dynamics, especially during the summer months. Keep in mind that warm eddies in the wintertime can also energize atmospheric frontal systems, such as the "storm of the century" that caused snowstorms across the Deep South in 1993.

To gauge the risk this heat pool posed for Hurricane Ida, we flew aircraft over the eddy and dropped measuring devices, including what are known as expendables. An expendable parachutes down to the surface and releases a probe that descends about 1,300 to 5,000 feet (400 to 1,500 meters) below the surface. It then send back data about the temperature and salinity.

This eddy had heat down to about 480 feet (around 150 meters) below the surface. Even if the storm's wind caused some mixing with cooler water at the surface, that deeper water wasn't going to mix all the way down. The eddy was going to stay warm and continue to provide heat and moisture.

That meant Ida was about to get an enormous supply of fuel.

When warm water extends deep like that, we start to see the atmospheric pressure drop. The moisture transfers, also referred to as latent heat, from the ocean to atmosphere are sustained over the warm eddies since the eddies are not significantly cooling. As this release of latent heat continues, the central pressures continue to decrease. Eventually the surface winds will feel the larger horizontal pressure changes across the storm and begin to speed up.

That's what we saw the day before Hurricane Ida made landfall. The storm was beginning to sense that really warm water in the eddy. As the pressure keeps going down, storms get stronger and more well defined.

When I went to bed at midnight that night, the wind speeds were about 105 miles per hour. When I woke up a few hours later and checked the National Hurricane Center's update, it was 145 miles per hour, and Ida had become a major hurricane.

Hurricane Ida turned into a monster thanks to a giant warm patch in the Gulf of Mexico – here's what happened
Ida’s route to Louisiana passed through very warm water. The scale, in meters, shows
 the maximum depth at which temperatures were 78 degrees Fahrenheit (26 C) or 
greater. Credit: University of Miami, CC BY-ND

Is rapid intensification a new development?

We've known about this effect on hurricanes for years, but it's taken quite a while for meteorologists to pay more attention to the upper ocean heat content and its impact on rapid intensification.

In 1995, Hurricane Opal was a minimal tropical storm meandering in the Gulf. Unknown to forecasters at the time, a big warm eddy was in the center of the Gulf, moving about as fast as Miami traffic in rush hour, with warm water down to about 150 meters. All the meteorologists saw in the satellite data was the surface temperature, so when Opal rapidly intensified on its way to eventually hitting the Florida Panhandle, it caught a lot of people by surprise.

Today, meteorologists keep a closer eye on where the pools of heat are. Not every storm has all the right conditions. Too much wind shear can tear apart a storm, but when the atmospheric conditions and ocean temperatures are extremely favorable, you can get this big change.

Hurricanes Katrina and Rita, both in 2005, had pretty much the same signature as Ida. They went over a warm eddy that was just getting ready to be shed form the Loop Current.

Hurricane Michael in 2018 didn't go over an eddy, but it went over the eddy's filament—like a tail—as it was separating from the Loop Current. Each of these storms intensified quickly before hitting land.

Of course, these warm eddies are most common right during hurricane season. You'll occasionally see this happen along the Atlantic Coast, too, but the Gulf of Mexico and the Northwest Caribbean are more contained, so when a  intensifies there, someone is going to get hit. When it intensifies close to the coast, like Ida did, it can be disastrous for coastal inhabitants.

How hurricanes draw fuel from water water. Credit: NOAA

What does climate change have to do with it?

We know global warming is occurring, and we know that surface temperatures are warming in the Gulf of Mexico and elsewhere. When it comes to rapid intensification, however, my view is that a lot of these thermodynamics are local. How great a role  plays remains unclear.

This is an area of fertile research. We have been monitoring the Gulf's ocean heat content for more than two decades. By comparing the temperature measurements we took during Ida and other hurricanes with satellite and other atmospheric data, scientists can better understand the role the oceans play in the rapid intensification of storms.

Once we have these profiles, scientists can fine-tune the computer model simulations used in forecasts to provide more detailed and accurate warnings in the futures.

Study targets warm water rings that fuel hurricane intensification in the Caribbean Sea
Provided by The Conversation 
This article is republished from The Conversation under a Creative Commons license. Read the original article.The Conversation

 ANOTHER SOURCE FOR CONSPIRACY THEORIES

Odds of asteroid Bennu hitting Earth put into perspective

Statisticians put odds of asteroid Bennu hitting Earth into perspective
A mosaic image of the asteroid Bennu made by a NASA spacecraft, which was in 
close proximity of the asteroid for more than two years. 
Credit: NASA/Goddard/University of Arizona

Even Harry Stamper would probably like these odds.

Recently NASA updated its forecast of the chances that the asteroid Bennu, one of the two most hazardous known objects in our solar system, will hit Earth in the next 300 years. New calculations put the odds at 1 in 1,750, a figure slightly higher than previously thought.

The , which has been tracking the building-sized rock since it was discovered in 1999, revised its prediction based on new tracking data.

Even with the small shift in odds, it seems likely we won't face the kind of scenario featured that in the 1998 science-fiction disaster film "Armageddon" when Stamper, played by Bruce Willis, and his team had to try to blow up a huge asteroid that was on an extinction-making collision course with the Earth.

(In an unrelated development, NASA plans to launch a mission in November to see whether a spacecraft could hit a sizeable space rock and change its trajectory just in case it ever needs to.)

This raises the question of just how good should we feel about our odds. We put that question to Lucas B. Janson and Morgane Austern, both assistant professors of statistics.

They compared Bennu's chances of hitting Earth to the approximate likelihood of:

  • Flipping a coin and having the first 11 attempts all land heads.
  • Any four random people sharing a birthday in the same month (the odds of this are 1 in 1,750 exactly).
  • Throwing a dart at a dartboard with your eyes closed and hitting a bullseye.
  • Winning the state's VaxMillions lottery on two separate days if every eligible adult resident is entered and a new drawing is held every second.

Bottom line? Janson, an affiliate in , says that if he were a betting man, he would put his money on our being just fine. Then again, he points out, if he is wrong, "Paying up would be the least of my worries."

Only slight chance of asteroid Bennu hitting Earth: NASA
Provided by Harvard University 
This story is published courtesy of the Harvard Gazette, Harvard University's official newspaper. For additional university news, visit Harvard.edu.

Student-designed experiment to measure Earth's magnetic field arrives at Space Station

ESA - Oscar the Qube
Credit: Oscar-Qube–J. Gorissen

Oscar-Qube, short for Optical Sensors based on CARbon materials: QUantum Belgium, is an experiment developed by a group of students from the University of Hasselt, Belgium. Part of ESA Education Office's Orbit Your Thesis! program, the experiment arrived at the International Space Station on Space X Dragon CR23 resupply mission yesterday.

This week, ESA astronaut Thomas Pesquet will install the experiment in the Ice Cubes Facility that offers commercial and educational access to the microgravity environment of the Space Station.

Oscar-Qube's mission is to create a detailed map of Earth's . It makes use of a new type of magnetometer that exploits diamond-based quantum sensing, meaning that it is highly sensitive, offers measurements to the nano scale, and has a better than 100-nanosecond response time.

These features combine to create a powerful experiment that, once in position, will allow it to map the Earth's magnetic field to an unrivaled level of precision.

Oscar-Qube is designed and built exclusively by the first student team to test a diamond-based  sensing device in space. They will go on to manage operations during its 10-month stay onboard the International Space Station.

ICE Cubes space research service open for business
Provided by European Space Agency 

Satellites measure drought stress in plants with aim of increasing crop yields

Increasing crop yields: Satellites measure drought stress in plants
The sensor system to observe areas of the Earth will be installed aboard the International 
Space Station (ISS). Credit: NASA

With a satellite system that measures drought stress in plants, two researchers from the Fraunhofer Institute for High-Speed Dynamics, Ernst-Mach-Institut, EMI, have now founded the spin-off ConstellR. Their technology enables the agricultural sector to optimize the irrigation of areas under cultivation to increase crop yields. The first sensor system will be launched into space in early 2022 and be installed on board the International Space Station (ISS).

The global population is growing—and demand for food is growing along with it. Since arable land is limited, farmers will need to harvest more from the same area in the future, meaning that cultivation will have to be improved, too. One important lever is an ideal supply of water—because when plants respond to drought stress, they invest less energy into their fruits, thereby reducing the harvest. One major problem is the difficulty of measuring the condition of plants on the vast arable land that spans the world. Although  has been used since the 1970s to provide a general overview, it remains relatively inaccurate. To date, scientists have primarily used visual and near-infrared sensors that detect the plant pigment chlorophyll which breaks down when plants are not watered enough. "But by then, it's already too late," says Max Gulde, a physicist at the Fraunhofer Institute for High-Speed Dynamics, Ernst-Mach-Institut, EMI, in Freiburg. "What we need is a technology that tells us within the space of a few hours whether plants have sufficient access to water."

Algorithms determine the temperature on the leaf's surface

Max Gulde and his colleague Marius Bierdel at Fraunhofer EMI have taken on the task of developing precisely this type of technology. Satellite technology is applied here too, with the research team using an advanced thermal imaging camera in the satellite. Special algorithms evaluate the data to determine the temperature on the surface of the plants' leaves, which enables researchers to draw conclusions on the water supply. When there is a water shortage, less water is evaporated through the leaves. This increases the temperature on the leaf's surface. "Within the space of two hours, the temperature can change by two to three degrees Celsius," explains Max Gulde. "Our method can measure temperature differences very precisely, to within a tenth of a degree." In technical terms, the sensor measures the amount of energy emitted by the plants in the form of photons.

One challenge that arose during the development stage was how to factor out interfering heat emitted by the atmosphere, the Earth's surface or from the satellite itself. This heat distorts the temperature data obtained from the leaf's surface. Thanks to their algorithms, the EMI researchers also succeeded in overcoming this challenge. And it was the European Space Agency (ESA), no less, that confirmed how well the system works: "We weren't sure about our approach until the ESA informed us that this was a real breakthrough. Before us, no one had been able to solve the problem of temperature measurement in such a compact system," emphasizes Max Gulde. The data is downloaded from the satellites to ground stations, processed in data centers, prepared for the user and finally transferred to the agricultural users' app.

Increasing crop yields: Satellites measure drought stress in plants
Agricultural areas, viewed from the satellite with the thermal imaging camera. In the example analysis, red represents high temperatures and impending water shortages. Credit: ConstellR

Optimal irrigation in close to real time

The technology's key advantage is that data and information about the water supplied to plants is available after just a few hours. As a result, farmers can adjust their irrigation levels practically in real time to specifically water those fields or plants that are most affected. Moreover, pinpoint precise irrigation systems help to save water and enable more accurate crop forecasts. This means that prices for agricultural products can be calculated accordingly at an early stage because farmers can predict how badly a drought could damage their crops many weeks in advance. "This provides agricultural producers with significantly increased planning security," clarifies Gulde.

The new technology is scheduled to go into operation in space aboard the International Space Station as early as the beginning of 2022. "I am very pleased that Fraunhofer EMI's first spin-off will use the technologies developed at the institute to help optimize the irrigation of fields and  as well as the yield of crops worldwide. This improves food security for people around the world and represents significant progress, especially in times of climate change," enthuses Professor Frank Schäfer, Head of the Systems Solutions department at the institute.

The path to ConstellR

Gulde and Bierdel founded the company ConstellR to further develop and commercialize the technology. Since 2015, the two scientists have been involved in research on the ERNST nanosatellite mission, which uses a compact thermal imaging camera. They came up with the idea of equipping their own satellites with high-resolution spatial thermal imaging cameras for temperature measurement in 2017. At the time, the task for young researchers was to design the smallest satellite with the greatest benefit for society as part of the European Copernicus Masters competition. The EMI researchers were accepted into a startup program—known as an accelerator—with their idea. "It was thanks to our involvement in that program that we learned all the basics of entrepreneurship," describes Max Gulde. But it was only a grant of 1.8 million euros from the German Federal Ministry for Economic Affairs and Energy—ten percent of which was awarded by Fraunhofer EMI—that enabled them to develop the  and found ConstellR.

The two experts will leave the Fraunhofer-Gesellschaft at the end of 2022 to devote themselves fully to their development company. Their research has already resulted in three patents.


Firms employing many scientists and engineers are riskier for investors

stock market
Credit: CC0 Public Domain

A highly skilled workforce of scientists and engineers may boost companies' performance but makes them a riskier investment on the stock market, research shows.

This was because firms with high numbers of scientists and engineers are more inflexible, as they are expensive to employ but too important to sack, the British Academy of Management online annual conference heard today.

Three researchers from Leeds University Business School analyzed data from 1997 to 2018 on 14,786 firms in 16 countries, including the UK, that were listed on the  market.

Dr. Chieh Lin, Professor Steven Toms and Professor Iain Clacher looked at the wage share—the percentage of the total wage bill—spent on staff working in science, technology, engineers or mathematics, known as STEM workers, in 269 industries, such as transport, manufacturing and education.

They found that in those industries where companies spent more of their wage bill on STEM workers, the  value of firms was more volatile.

Firms' "Beta measure" grew in industries where more STEM workers were employed. Beta is a measure of a stock's volatility in relation to the overall market, where a stock that swings more than the market over time has a beta of more than 1.0.

On average, an extra 20% of wage bill spent on STEM workers was linked to an increase in beta by between 9% and 17%.

Also, firms' profits became more sensitive to changes in their sales income as the firm relied more heavily on STEM workers. Because of this uncertainty, investors in the firms demanded a higher return.

STEM workers cost more but are often too important to lay off, making firms unresponsive to downturns. An average STEM  earns $91,000, compared with $47,000 for non-STEM staff. STEM workers account for around 13% of total workforce and 23% of total wages and salaries in the US.

"STEM workers are at the center of the global competition for talent due to their ability to leverage advanced technology both effectively and productively," Dr. Lin told the conference.

"While the contribution of STEM workers to high value-added activities such as R&D and innovation, and therefore growth, is typically emphasized, limited attention has been paid to the risk that a STEM-intensive workforce may entail for individual firms.

"We argue that reliance on STEM workers reduces the operating flexibility of firms by increasing the degree of fixity in labor costs, and therefore total operating costs.

"The operating leverage thus created increases the volatility of cash flow as it becomes more exposed to systematic risk. The risk associated with the employment of STEM workers must be balanced against their contribution to innovation and growth.

"Investment in STEM workers amplifies both the downside risk and upside potential of firms, but with the former effect being more dominant.

"The stocks of STEM worker-intensive firms are riskier due to higher exposure to systematic risk. Investors demand a high return on stocks of STEM worker-intensive firms to compensate for a higher exposure to systematic risk."

Dr. Lin said that while stocks of STEM-intensive  are risky investments in general, exceptions such as Amazon and other tech giants were possible given their robust business models.

The researchers controlled for the effects of several factors such as firm size, indebtedness and growth, in order to study the effect of STEM employment in isolation.

Low wages not education to blame for skills gap
Provided by British Academy of Management


UK

Women and ethnic minorities face 'severe disadvantages' in reaching top rank among surgeons

doctor
Credit: Pixabay/CC0 Public Domain

Women and ethnic minority surgeons who want to reach the top rank of their profession face "severe disadvantages" and a glass ceiling, new research shows.

Even when they have a similar work history to male surgeons, they are consistently less likely to reach the top rank of consultant, the British Academy of Management online annual conference heard today.

Three academics analyzed data on 3,402 NHS junior surgeons in England from 2009–2010, studying how many had progressed to consultant level by 2020.

The three are: Professor Carol Woodhams, of the University of Surrey Business School, with Ira Parnerkar of Queen Mary University, and Mukunda Sharma of Exoduspoint Capital LLC.

The raw data, from the Electronic Staff Record for NHS staff, showed that rates of promotion for  and ethnic minority groups were lower than those for . Compared to the promotion rates to consultant from 2016–2020 of white men:

  • Black women were 42 percentage points less likely to be promoted.
  • Women of Indian and Pakistani ethnicity were 28 percentage points less likely to be promoted.
  • White women were 21 percentage points behind.
  • Women of Chinese and south east Asian ethnicity were 14 percentage points behind.
  • Black men were 27 percentage points behind
  • Indian and Pakistani men were 10 percentage points behind.
  • Men of Chinese and south east Asian ethnicity were 6 percentage points behind.

The statistics also showed that in 2010, 57% of junior surgeons were men. By 2020 that had increased to 63% men as more women than men had dropped out of the career structure, and the proportion of men who had been promoted to consultant was 53.6%, and for women 36.5%.

Ethnic minority women comprised 15% of surgeons in 2020 but only 8% of trainees who were promoted to consultant were from this group.

Professor Woodhams adjusted the raw data to compare surgeons who were of similar age and background and who had worked a similar number of hours in training.

She found that taking maternity leave of any duration meant a 7 percentage points less chance of reaching consultant level by 2020. Taking any other kind of career break, such as working , perhaps to look after their children, reduced chances of promotion by 8 percentage points.

Even when comparing groups with the same amount of training hours and same record of career interruptions, women and Black men were less likely to be promoted to consultant.

"The most striking finding is that even when Indian women, white women and Black men conform to white male patterns of working, the progression gap is wide and, in some cases, very wide," Professor Woodhams said.

"This is objective evidence that disadvantage against diverse groups in surgery is deep-rooted and a new progressive milieu in the NHS and the broader society has not yet translated into concrete and progressive outcomes.

"Women, and especially non-white women, are under-represented in senior ranks of consultant, making a prima facie case for the existence of a glass ceiling.

"Black male surgeons are severely disadvantaged. Black males work long hours, take very few part time or career interruptions and tend to work in most elite subspecialties of surgery. Yet they are one of the least likely to secure promotion." Non-white trainees were less likely to be promoted to consultant in hospitals where there was a high proportion of white men, she said.

Part of the reason for the high promotion rate of white men may be an old-boys' network, she said. "Women and ethnic minority junior surgeons may have less access to important informal networks that bestow the sponsorship and patronage that is so important in securing a consultant post."

She said that her research quantified the effects of previous surveys in which a third of trainee surgeons said they had experienced bullying, undermining and harassment from, in most cases, a consultant.

"In an elite profession, surgery is arguably the most elite of specialties. It is competitive, pressurized and receives the highest reward but it is consistently associated with a bullying culture that is especially hostile to women."

Black and Latinx surgeons continue to hit glass ceiling in America
Provided by British Academy of Management


Using DNA to search for the true origins of imported honey

Using DNA to Search for the True Origins of Imported Honey
Scientists at the BTI Willson Lab have collected a library of imported honey for the Honey
DNA project. Credit: BTI

Have you ever wondered where the honey you add to your morning tea and drizzle on your desserts or oatmeal comes from (besides bees)? The easy answer would be to check the label, which typically offers the country of origin along with all those wonderful nutritional benefits. Unfortunately, as the Department of Homeland Security's Science and Technology Directorate (S&T) knows all too well, sometimes labels can be misleading, especially when it comes to honey imported into the U.S.

Honey imports have nearly doubled in the last decade—from 251 million pounds in 2010 to 416 million pounds in 2019—which is great news for consumers who now have more access to some of the sweetest stuff on earth. However, this tremendous growth in demand also has a dark side that many might not know about—adulteration and mislabeling of  to hide its true origin have become a global issue.

What does this mean for shoppers and our economy? Well, illicit importers, who are economically motivated to evade tariffs or sanctions, have made it a practice to affix fake labels onto jars, indicating the honey is from a different country of origin or disguising cheaper honey as sought-after expensive types. Some illicit actors even dilute honey with ingredients like syrups and sugar. New Zealand manuka honey, for example, commands a high price on the market, up to 100 times higher than other honey types, as it is very in-demand for its putative health benefits. It is also one of the most adulterated types of honey. In a recent lawsuit, U.S. beekeepers claimed adulterated honey from Asia caused prices to plummet and forced them into financial ruin.

"Adulterated honey is a tremendous problem for the U.S. honey industry, because it drives the market price down, and U.S. producers can't compete with the lower market value of imported honey," said Stephen Cassata, a senior science officer and acting lab director of the U.S. Customs and Border Protection (CBP) INTERDICT Science Center. "Dealing with this issue is a whole-of-government approach, and we are currently collaborating with other federal agencies (including the Food and Drug Administration and U.S. Department of Agriculture) on joint operations targeting honey enforcement."

CBP is tasked with enforcing hundreds of U.S. trade laws, including the proper classification of goods under the Harmonized Tariff Schedule of the United States, and assessing applicable tariffs to ensure that importers pay the appropriate duties on entered goods. To help CBP determine the true sources of honey, S&T enlisted the expertise of the Borders, Trade, and Immigration Institute Center of Excellence (BTI), led by the University of Houston, for a project called Honey DNA. S&T invested in cutting-edge forensic science that can improve the speed and efficiency in verifying the country of origin of commercially available honey and its path to the supermarket shelves—specifically, S&T has been looking at how the unique makeups of products coming to the U.S. match how they are represented on the packaging.

"This project developed a means to identify honey countries of origin using the DNA in pollen and DNA dissolved in filtered honey," said BTI executive director Kurt Berens.

Honey is filtered for a variety of reasons, including the attempt to hide its source plant by making plant identification by pollen very challenging.

"BTI's testing method could potentially provide another capability for CBP to determine country or region of origin for Antidumping and Countervailing Duty enforcement," said CBP deputy director Patricia Hawes. "It complements testing capabilities we already employ to determine country of origin of honey."

BTI conducts research to enhance U.S. border security, facilitate legitimate trade and travel, and ensure immigration system integrity, and for several years this S&T Center of Excellence has been working on detecting the source country of honey by identifying the plant species via DNA from pollen. The Honey DNA project started in early 2020.

"The size of the available database of known DNA sequences from particular plants has exploded recently, making it more likely that any DNA sequence we find can be associated with a particular plant species or small group of plants," said BTI Honey DNA principal investigator Dr. Richard Willson, who is also Huffington-Woestemeyer Professor of Chemical and Biomolecular Engineering. "Over the past 15 to 20 years, the cost of DNA sequencing has collapsed by 10,000-fold, making DNA-sequencing-based technologies much more attractive for a wide variety of applications."

Through the Honey DNA project, BTI was able to leverage these technologies to establish techniques that will help mitigate fraud and provide authentic and safe food for consumers. BTI scientists developed methods for sequencing DNA not only from whole pollen grains in unfiltered honey but also from the small amounts of DNA leaked from broken pollen grains in filtered honey.

To study the true origin of honey, BTI scientists collected samples from a variety of places, including directly from apiaries in multiple countries, from small specialty providers and farmers' markets, from friends traveling overseas, and even from online specialty stores during the pandemic when travel wasn't possible.

"We analyzed 300 honey samples from which we assembled country-specific plant DNA sequences," said Willson. "We also successfully isolated soluble trace DNA from pollen-free, ultra-filtered honey and sequenced it."

To extract DNA from pollen, Willson and his team diluted small samples of honey with water, centrifuged them to help the pollen sink to the bottom of the test tubes, and extracted the DNA. To isolate trace DNA from filtered honey, the BTI scientists again diluted a small sample of pollen-free honey with water, and then extracted and purified the DNA. The extracted DNA was then amplified and sequenced. These findings were recently released in a report.

DNA sequencing is performed to find the sequence in which the building blocks of DNA, the nucleotides, are arranged in a given DNA strand, which can help identify a .

When the BTI scientists tested the expensive New Zealand manuka honey, which is derived from the manuka plant, they found that many jar labels claiming to contain manuka honey were not accurate.

The BTI team believes that the Honey DNA tracing methods could find broad applications in other types of forensic cases, including identifying the species of other natural products, and even tracing the origins of imported goods and narcotics. "Also, the DNA sequences obtained from this project will enrich the public DNA database and help link occurrences of source plants across the world for a more precise identification of honey origin," said Willson.

"This new technology could potentially be one of the tools in CBP's toolbox to intercept illegal imports," said Hawes. "We are constantly looking at new ways to do our mission."

Origin of rare, healthy sugar found in stingless bee honey
More information: DNA Assays for Determining Honey Origins: uh.edu/bti/research/honey-dna/bti_honeydna.pdf


What's the point of homework?

What’s the point of homework?
Credit: Shutterstock

Homework hasn't changed much in the past few decades. Most children are still sent home with about an hour's worth of homework each day, mostly practicing what they were taught in class.

If we look internationally, homework is assigned in every country that participated in the OECD's Programme for International Student Assessment (PISA) in 2012.

Across the participating countries, 15-year-old students reported spending almost five hours per week doing  in 2012. Australian students spent six hours per week on average on homework. Students in Singapore spent seven hours on homework, and in Shanghai, China they did homework for about 14 hours per week on average.

Shanghai and Singapore routinely score higher than Australia in the PISA maths, science and reading tests. But homework could just be one of the factors leading to higher results. In Finland, which also scores higher than Australia, students spent less than three hours on homework per week.

So, what's the purpose of homework and what does the evidence say about whether it fulfills its purpose?

Why do teachers set homework?

Each school in Australia has its own homework policy developed in consultation with teachers and parents or caregivers, under the guiding principles of state or regional education departments.

For instance, according to the New South Wales homework policy "… tasks should be assigned by teachers with a specific, explicit learning purpose."

Homework in NSW should also be "purposeful and designed to meet specific learning goals," and "built on knowledge, skills and understanding developed in class." But there is limited, if any, guidance on how often homework should be set.

Research based on teacher interviews shows they set homework for a range of reasons. These include to:

  • establish and improve communication between parents and children about learning
  • help children be more responsible, confident and disciplined
  • practice or review material from class
  • determine children's understanding of the lesson and/or skills
  • introduce new material to be presented in class
  • provide students with opportunities to apply and integrate skills to new situations or interest areas
  • get students to use their own skills to create work.

So, does homework achieve what teachers intend it to?

Do we know if it 'works'?

Studies on homework are frequently quite general, and don't consider specific types of homework tasks. So it isn't easy to measure how effective homework could be, or to compare studies.

But there are several things we can say.

First, it's better if every  gets the kind of homework task that benefits them personally, such as one that helps them  they had, or understand a problem they couldn't quite grasp in class. This promotes students' confidence and control of their own learning.

Giving students repetitive tasks may not have much value. For instance, calculating the answer to 120 similar algorithms, such as adding two different numbers 120 times may make the student think maths is irrelevant and boring. In this case, children are not being encouraged to find solutions but simply applying a formula they learnt in school.

In , homework that aims to improve children's confidence and learning discipline can be beneficial. For example, children can be asked to practice giving a presentation on a topic of their interest. This could help build their competence in speaking in front of a class.

Homework can also highlight equity issues. It can be particularly burdensome for socioeconomically disadvantaged students who may not have a space, the resources or as much time due to family and work commitments. Their parents may also not feel capable of supporting them or have their own work commitments.

According to the PISA studies mentioned earlier, socioeconomically disadvantaged 15 year olds spend nearly three hours less on homework each week than their advantaged peers.

What kind of homework is best?

Homework can be engaging and contribute to learning if it is more than just a sheet of maths or list of spelling words not linked to class learning. From summarizing various studies' findings, "good" homework should be:

  • personalized to each child rather than the same for all students in the class. This is more likely to make a difference to a child's learning and performance
  • achievable, so the child can complete it independently, building skills in managing their time and behavior
  • aligned to the learning in the classroom.

If you aren't happy with the homework your child is given then approach the school. If your child is having difficulty with doing the homework, the teacher needs to know. It shouldn't be burdensome for you or your .

Is it time to get rid of homework? Mental health experts weigh in
Provided by Western Sydney University 
This article is republished from The Conversation under a Creative Commons license. Read the original article.The Conversation