Thursday, September 10, 2020

Greenland Ice Sheet Reached Tipping Point 20 Years Ago, New Study Finds

BY  |SEPTEMBER 2, 2020 CLIMATE, GLACIERHUB BLOG

At the turn of the 21st century, unbeknownst to the world, the Greenland ice sheet likely entered a state of sustained mass loss that will persist for the foreseeable future, according to a new study. Though the finding has raised concern over the future of the ice sheet, scientists emphasize that reducing emissions remains critical.

The study, which looked at 40 years of satellite data, was released on August 13 in Communications Earth & Environment. Second in size only to the Antarctic ice sheets, the Greenland ice sheet covers nearly 80 percent of the vast island. It contains the equivalent of about 24 feet of global mean sea level rise and, due to its accelerated retreat, is considered the largest single contributor to rising sea levels worldwide.

While the ice sheet’s decline has been well-documented over the past two decades, this latest study, led by Michalea King of the Byrd Polar and Climate Research Center, found that widespread glacier retreat helped push the ice sheet from a balanced to an imbalanced state. This work suggests that even if the oceans and atmosphere were to stop warming today, the ice sheet will continue to lose more ice than it will gain.

greenland ice sheet

The Greenland ice sheet likely lies above an ancient tundra landscape with its own complex topography. Photo: Michalea King

In the decades leading up to the turn of the century, the ice sheet was in a state of relative equilibrium. The ice lost in a given year would be replenished by wintertime snowfall, and the sheet maintained a near-constant mass. But beginning around the year 2000, ice discharged through outlet glaciers—channels that flow outward to the sea—started to outpace annual snowfall that, in a balanced year, would replenish lost ice. The authors sifted through 40 years of satellite data, tracking outlet glacier velocity, thickness, and calving front position over time to determine the rate of ice loss. The shift they found represents a tipping point that is unlikely to be reversible in the near future. King told GlacierHub, “It’s like a gear change… we’ve accelerated the drainage at the edge of the ice sheet, and now… we expect mass loss to be the new norm for the ice sheet in the near future.”

Ian Howat, director of the Byrd Polar and Climate Research Center and co-author of the paper, explained to GlacierHub that the dynamics of ice loss through outlet glaciers can be likened to the functioning of a dam. “Those glaciers act just like a spillway on a dam,” he said. “The more you open the spillway… the faster the reservoir gets drawn down.” The study suggests that longer-term thinning throughout the 20th century—likely due to warming oceans—led up to a mass retreat event in the early 2000s. The result was a “step-increase” in the rate of discharge through outlet glaciers; before 2000, 420 gigatons of ice were discharged annually. In the years following, the rate increased to 480 gigatons of ice discharged annually. A gigaton is equal to one billion metric tons, roughly the mass of all land mammals (excluding humans) on Earth. “When all of these glaciers retreated at once, it was enough to significantly increase the rate at which ice flows into the ocean. It’s like the spillway on the dam was opened up,” Howat said.

researchers working on the ice sheet

Members of the research team place equipment atop the ice sheet. Photo: Michalea King

According to King, the significance of this new rate of discharge is that “consistently, more ice is being lost through the flow of these glaciers than is being gained by snow accumulation.” Returning to a balanced state would require an extra 60 gigatons per year of snowfall or reduced melting. Yet under essentially all climate change scenarios, the opposite is expected.

The findings of this study—along with others that document the decline of the Greenland ice sheet—spell worrying news for sea level rise trajectories. Marco Tedesco, research professor of marine geology and geophysics at the Lamont-Doherty Earth Observatory, explained to GlacierHub that the Greenland ice sheet has been, and will increasingly be, a major contributor to rising sea levels. The two primary causes of sea level rise are thermal expansion—ocean water expands as it warms—and the melting of land-based ice. With sea level rise projected to submerge land home to 150 million people permanently below the high tide line (and that estimate assumes stability of the Antarctic ice sheet), Greenland finds itself in the spotlight. “In terms of direct contribution,” Tedesco said, “Greenland is actually the largest contributor now, with about 20 to 25 percent of sea level rise due to Greenland.” Moreover, the percentage of contribution could increase to 30 or 40 percent by the end of the century, according to Tedesco.

The ice loss shown above has resulted in about 0.8 millimeters per year of sea level rise. Source: NASA

Another study on the Greenland ice sheet, coauthored by Tedesco, made international headlines recently, concluding that 2019 was a year of record ice loss. According to scientists, the ice lost in 2019 was double the yearly average since 2003. Ian Joughin, a glaciologist at the University of Washington’s Polar Science Center, connected the dots between these two major studies. “Nobody really, 20 years ago, was expecting glaciers to speed up as rapidly as what we’ve seen,” he told GlacierHub. In terms of annual loss of ice, “people think of it as melting, but it’s basically the balance between how much snow falls each year, and how much icebergs calve off and how much melting actually occurs on the ice sheet itself.” Ultimately, neither melting nor ice discharge alone can explain the changing ice sheet. They are, rather, two processes in a complex dynamic, which glaciologists are racing to understand using a combination of field work, remote sensing, and modeling.

ice floating in water

Coastal waters of Greenland from above. Photo: Michalea King

Rapid international action is needed to limit global warming to 1.5˚C, which would allow more time for adaptation to rising sea levels. Addressing recent headlines declaring that the ice sheet has reached the point of no return, a statement that has since been discussed within the scientific community, Howat said, “I think it’s very important to emphasize that this loss of the ice sheet is not irreversible. We’ve witnessed a step-change that is unlikely to be reversible in the near future, but we still have a long way to go and we still have a lot of say in how quickly the ice sheet will continue to retreat.”


Deep Channels Linking Antarctic Glacier's Underside to Ocean Could Hasten Melting

BY  |SEPTEMBER 9, 2020

Newly discovered deep seabed channels beneath the Thwaites Glacier in West Antarctica may be pathways for warm ocean water to melt the undersides of the ice, and contribute to sea level rise, say scientists. The scientists have based their conclusions on data from two research missions, using aircraft and a ship.

Researchers from the UK- and U.S.-led International Thwaites Glacier Collaborationcollected the data from the glacier and adjoining Dotson and Crosson ice shelves during January–March 2019. While one team collected airborne data flying over the glacier and its adjoining ice shelf in a British Antarctic Survey aircraft, the other mapped the sea floor at the ice front from the U.S. Antarctic Program’s icebreaker Nathaniel B Palmer. Two research papers published this week in the journal The Cryosphere describe the discovery.

By flying geophysical instruments over the glacier, the researchers were able to map a system of channels and cavities extending some 100 kilometers back from the front of its floating ice shelf to where the ice sits on land, the so-called grounding line. Some of the features are 800 meters deep. The researchers say the maps give them for the first time a clear view of the pathways along which warm water may potentially reach the underside of the glacier, causing it to melt.

small plane flying over icy water

Above, a Twin Otter plane belonging to the British Antarctic Survey en route to Antarctica’s Thwaites Glacier. Below, leading edge of the glacier’s floating ice shelf; at this point, the ice sits about 70 meters above the water, with another 480 meters below the surface. (Both photos: Dave Porter/Lamont-Doherty Earth Observatory)

ice shelf

Dave Porter, a glaciologist at Columbia University’s Lamont Doherty Earth Observatory, who flew over Thwaites Glacier for the airborne survey, said, “Being able to see firsthand the changes occurring [there] was both awe-inspiring and disconcerting.”

Thwaites Glacier covers 192,000 square kilometers (74,000 square miles), equivalent to the area of Great Britain or the state of Florida. It is believed to be particularly susceptible to climate and ocean changes. During the past 30 years, the overall rate of ice loss from the Thwaites and its neighboring glaciers has increased more than fivefold. Already, ice draining from Thwaites into the adjoining Amundsen Sea accounts for about 4 percent of global sea level rise. A runaway collapse of the glacier could lead to an increase in sea levels of around 65 centimeters (25 inches). Scientists want to find out how quickly this could happen.

Lead author Tom Jordan, a geophysicist at British Antarctic Survey, said of the hidden features, “They form the critical link between the ocean and the glacier. The offshore channels, along with an adjacent cavity system, are very likely to be the route by which warm ocean water passes underneath the ice shelf up to the grounding line, where the ice meets the bed.”

Exceptional sea-ice breakup in early 2019 enabled the team on the Nathaniel B Palmerto survey more than 2,000 square kilometers of sea floor at the glacier’s ice front. The area surveyed had previously been hidden beneath part of the floating ice shelf extending from Thwaites Glacier, which broke off in 2002, and in most subsequent years the area was inaccessible due to thick sea-ice cover. The team’s findings reveal that the sea floor is generally deeper and has more deep channels leading toward the grounding line under the ice shelf than was previously thought.

“We found the coastal sea floor, which is incredibly rugged, is a really good analogue for the bed beneath the present-day Thwaites Glacier both in terms of its shape and rock type,” said Kelly Hogan, a British Antarctic Survey marine geophysicist. “By examining retreat patterns over this sea-floor terrain, we will be able to help numerical modelers and glaciologists in their quest to predict future retreat.”

Adapted from a press release by the British Antarctic Survey and the European Geosciences Union.


How to Read That Damning Sturgis Motorcycle Rally 'Superspreader' Study Like a Scientist

Ed Cara
Yesterday 11:20AM
Annual Sturgis Motorcycle Rally To Be Held Amid Coronavirus Pandemic : News Photo
People walking along Main Street during the 80th Annual Sturgis Motorcycle Rally in Sturgis, South Dakota on August 8, 2020.Photo: Michael Ciaglo (Getty Images)

A week-long rally attended by half a million motorcycle enthusiasts last month in Sturgis, South Dakota could have eventually led to an extra 250,000 cases of covid-19, according to new research released by a team of economists. But though it’s certainly likely that the rally was a superspreading event, this particular estimate may be off the mark, as two scientists not affiliated with the study explained to us.


The Sturgis Motorcycle Rally is an annual event held since 1938. This year, despite concerns of the large crowds being a conduit for covid-19, the rally ran from August 6 to 19 and is thought to have attracted around 460,000 people from all over the U.S. Infamously, Steve Harwell, the lead singer of Smash Mouth, mocked the seriousness of covid-19 while performing to a packed crowd during the rally.

By early September, at least 260 covid-19 cases were reported to have been linked to people attending the rally, along with one reported death. Most of these cases involved people in South Dakota, though some were traced back to people in 11 other states; the one death was a man in his 60s from Minnesota. But, at least according to this new paper, the true covid-19 spread from the rally is much higher than reported.

The researchers analyzed several different sources of information to come up with their estimates. This included anonymous cell phone location data of locals and travelers who attended the rally, foot traffic data to bars and restaurants, and data on reported covid-19 cases collected by the Centers for Disease Control and Prevention.

The team found that the Sturgis rally was associated with lots of visitors from out of town, more foot traffic to bars and restaurants in the area, and increased movement outside of the home by local residents. These factors combined to promote the spread of the contagious illness during and after the rally, they found, which led to a noticeable jump in cases in South Dakota and in areas where larger numbers of attendees came from


All told, they calculated that Meade County, home of Sturgis, had an extra six to seven cases of covid-19 per every 1,000 people than it would have normally by September 2. Counties with the highest number of residents who went to the rally were also said to have experienced a 7% to 12.5% increase in covid-19 cases, relative to similar counties where no people traveled to the rally. These spikes ultimately amounted to an added 250,000 cases, they concluded, amounting to nearly 20 percent of all cases believed to have occurred in the U.S. between August 2 and September 2.“The 250,000 estimate is a nice headline-grabber but pretty likely to be an overestimate.”

The paper was released recently as a preprint by the IZA Institute of Labor Economics, a private research group focused on labor markets that’s based in Germany. Its authors include several economists from San Diego State University’s Center for Health Economics & Policy Studies, the University of Colorado Denver, and the National Bureau of Economic Research. Preprints are preliminary research, meaning that they haven’t gone through the typical peer review process.

While right-wing folks on social media were quick to dismiss the results as politically motivated, this same group of economists also found little evidence for a spike in cases linked to the Tulsa, Oklahoma rally for President Trump’s reelection held in late June (some experts have argued otherwise, however). They similarly found little data to suggest that the widespread Black Lives Matter rallies held earlier this summer were linked to a substantial increase in cases in the cities where they held.

According to Elizabeth Stuart, a statistician and associate dean at the Johns Hopkins Bloomberg School of Public Health, the basic methodology used by the team is commonly deployed to evaluate the effects of policy interventions. But there’s a lot of uncertainty in applying these tools to studying how a never-before-seen disease like covid-19 might spread through a population—uncertainty that she felt the researchers could have done a better job of showing.

“I think they did a reasonable analysis. But there were many choices made along the way that could have been made differently,” said Stuart, who is not affiliated with the research.

One example she brought up was how the team compared South Dakota to other states like Vermont and New Hampshire in trying to create a “synthetic control,” a statistical tool that tries its best to imagine what would have happened in the same place had variable A (the rally happening in Sturgis in this case) never occurred. Because the states used were relatively small and may be different from South Dakota in many important ways, Stuart said, the exact numbers produced by the team’s model might not be as stable as they appear, even if the basic finding that the rally created a superspreading event is true.

“So the big, high-level conclusion from the study is that there were over 200,000 cases from this and that it accounted for 20% percent of cases nationwide. But there’s no uncertainty given to that—there’s no confidence interval,” Stuart said, referring to a common statistical method used to present the likely range of possibilities for any one result. “And I really think it’s important in these contexts to convey the uncertainty, both the statistical uncertainty and also the more fundamental uncertainty of their model.”

Joshua Salomon, a health policy researcher and professor of medicine at Stanford University, told Gizmodo via email that the team’s analysis is “thoughtfully designed” and that he agrees with the general conclusion that the rally likely led to a large number of infections. But he said comparing counties that did or didn’t have people who went to Sturgis as a way to estimate the number of cases caused by the rally, as the authors also did, has its shortcomings too.

“A key limitation is that these sets of counties appear to have been on different trajectories before the rally, which makes it much harder to compare the trends after the rally and attribute the difference to the rally,” he said. “So, the 250,000 estimate is a nice headline-grabber but pretty likely to be an overestimate.”


The authors do acknowledge that their numbers may not be a precise accounting of the covid-19 fallout that might have directly come from the rally. It’s possible, for instance, that some people who caught covid-19 during or after the rally would have caught it anyhow in some other way.

“However, this calculation is nonetheless useful as it provides a ballpark estimate as to how large of an externality a single superspreading event can impose, and a sense of how valuable restrictions on mass gatherings can be in this context,” the authors wrote.

The Sturgis gathering had some key differences from other large gatherings that have had people concerned about superspreading. For one, the Sturgis rally lasted far longer than any single protest or political rally and was attended by far greater numbers, with people coming largely from outside of the state. Anecdotally, few people who went to Sturgis were said to have worn masks or practiced much social distancing while there. And perhaps, unlike the BLM rallies, local residents also started relaxing their distancing and staying at home less during and after the rally, as the authors’ earlier research had suggested.

These factors seem to have turned the Sturgi rally into a “situation where many of the ‘worst case scenarios’ for superspreading occurred simultaneously,” the authors wrote. Alternatively, they provide hope that regulations like mandating mask-wearing, limiting the size of gatherings, and restricting indoor dining and drinking in bars can prevent these superspreading events from happening in the first place.

Stuart, for her part, doesn’t disagree there.

“Basically, I don’t have full confidence in how precise their estimate is. But I think it’s highly plausible that there was this spread. And certainly the recommendations around mask wearing, being outdoors, and still letting people gather but doing it in ways where it is safer—I think it’s the right kind of message,” she said.
Mexican journalist who wrote about crime found beheaded

A motorcycle is seen at the site where the body of journalist Julio Valdivia was found in Tezonapa, Veracruz, Mexico, September 9, 2020, in this image obtained via social media. Diario El Mundo via REUTERS

MEXICO CITY (Reuters) - A Mexican journalist who wrote about crime in the violent Gulf Coast state of Veracruz was found beheaded on Wednesday, local media reported, the latest grisly murder of a reporter in one of the world’s most dangerous nations for journalists.

The body of Julio Valdivia, 44, who specialized in the “nota roja” journalism that focuses on gruesome crime and violence, was found in the remote Tezonapa municipality, about 100 kilometers from the state capital, Veracruz.

A staff member at Valdivia’s Diario El Mundo local newspaper in Veracruz said initially it was suspected that Valdivia might have been run over by a train, but that was ruled out by the prosecutor’s office.


“Valdivia was found near the train tracks, beheaded and tortured,” said the newspaper staff member, who did not wish to be identified.

El Universal and several other local news outlets reported that Valdivia was beheaded, the fourth journalist death in Mexico this year.

In 2019, about half of all murders of journalists around the world occurred in Mexico, according to the Committee to Protect Journalists.


“We condemn the homicide of Julio Valdivia,” the Veracruz government said on its Twitter account.

A local media protection group known as the CEAPP said in a statement that Valdivia did not have extra protection measures as he had not reported facing threats to his security. But the group demanded the authorities “shed light” on the murder.


'Autocrats Deliver?' US Joins Brazil and Hungary as Only Countries Where Quality of Life Is Getting Worse, Social Progress Index Finds

The annual report offers a "reality check against the drumbeat of U.S. triumphalism," one observer said. 

Published on Thursday, September 10, 2020 
by

Juana Gomez wears a face mask while using a trash bag to protect against the rain, as she waits in line to receive food at a Food Bank distribution for those in need as the coronavirus pandemic continues on April 9, 2020 in Van Nuys, California. Organizers said they had distributed food for 1,500 families amid the spread of Covid-19. (Photo: Mario Tama/Getty Images)

The United States found itself in the company of Brazil and Hungary—two countries run by leaders who, like President Donald Trump, have alarmed international observers with their autocratic tendencies—on the 2020 Social Progress Index, an annual ranking of quality of life in nations around the world. 

The three countries are the only ones, according to the Social Progress Imperative, which has compiled the index since 2011, where quality of life has declined over the last decade.

"Autocrats deliver?" tweeted Kenneth Roth, executive director of Human Rights Watch.  

At number 28 on the list, the U.S. is also alone among other wealthy countries in the G7 where people's personal safety, access to basic healthcare, personal rights and freedoms, and other measures of quality of life are on the decline. 

"The data paint an alarming picture of the state of our nation, and we hope it will be a call to action," Michael Porter, a Harvard Business School professor and the chair of the advisory panel for the Social Progress Index, told Nicholas Kristof at the New York Times. "It's like we're a developing country."

The index ranks countries according to their performance in three key areas: basic human needs, foundation of wellbeing, and opprtunity—breaking those categories down into sub-categories including:

  • nutrition and basic medical care,
  • personal safety,
  • health and wellness,
  • environmental quality,
  • personal rights, and
  • inclusiveness.

Tier One on the index is populated by countries whose wealth is comparable to that of the United States. Norway was ranked as number one, followed by Denmark and Finland. New Zealand, which this year has won international praise for Prime Minister Jacinda Ardern's handling of the coronavirus pandemic, also ranked high, as well as Japan, Iceland, Canada, and Sweden.

A number of countries with GDPs lower than that of the U.S.—including Greece, Estonia, and Cyprus—rank ahead of the country in the bottom half of Tier Two. 

"GDP is not destiny," emphasizes the report, displaying a chart that shows the U.S. has lagged in "turning its economic growth into social progress."

With a lower GDP per capita than the U.S., the chart shows, New Zealand's government funds a universal healthcare program, spends a greater percentage of its GDP on education than any other country in the world, and was able to mitigate the spread of the coronavirus by allowing residents to stay at home with a major relief package, offering subsidies to businesses to continue paying employees and covering the wages of employees that had to self-isolate.    

The U.S. government has so far offered a one-time, means-tested direct payment of $1,200 to some American households—as the crisis stretches into its sixth month—and allowed its enhanced unemployment benefit to expire in July even as more than 10% of workers were jobless.

Well before the pandemic, the index shows, quality of life was rapidly declining in a number of areas in the U.S. In 2011, when the country was in 19th place on the list, the U.S. earned 93.25 points for meeting basic human needs such as healthcare and personal safety.

The uninsured rate is lower than it was in 2011, but has steadily climbed since 2016 and skyrocketed in a matter of weeks when the coronavirus pandemic hit, forcing an estimated 12 million Americans off their employer-based health coverage. 

Gun violence has also increased in the U.S. over the past six years, according to Giffords Law Center.

The United States' starkest decline since 2011 has been in the area of opportunity; in terms of inclusiveness, access to education, and personal rights, the U.S. was given 81.89 points this year, contrasting with its score of 85.17 in 2011. 

Kristof noted that while the U.S. is fully capable of delivering high-quality healthcare and education to everyone in the country, the federal government keeps many Americans from accessing necessities—operating as a nation with far fewer resources in terms of its approach to the wellbeing of the public, while lavishing the wealthiest Americans and corporations with tax breaks. 

"The United States ranks No. 1 in the world in quality of universities, but No. 91 in access to quality basic education," Kristof wrote. "The U.S. leads the world in medical technology, yet we are No. 97 in access to quality healthcare. The Social Progress Index finds that Americans have health statistics similar to those of people in Chile, Jordan, and Albania, while kids in the United States get an education roughly on par with what children get in Uzbekistan and Mongolia. "

The index, tweeted John Kostyack of the National Whistleblower Center, offered a "reality check against the drumbeat of U.S. triumphalism."

James Tierney, an economics professor at Penn State University, planned to use the index to teach his students about the limits of measuring a country's success by its GDP or economic growth. 

"The hope is to [help] students understand there are other measures outside of the value of production to determine the well-being of a country," Tierney tweeted. 


STONEHENGE’S UNREAL, REAL LIFE ACOUSTICS WOULD HAVE IMPRESSED THE GUYS OF SPINAL TAP


Credit: MGM
Contributed by

Sep 9, 2020,

Maybe the model of Stonehenge that materialized in the haze of a fog machine onstage in This is Spinal Tap was just a piece of spray-painted Styrofoam that almost got crushed, but a similar model has revealed the Neolithic monument probably had much better acoustics than that theater the band was playing.

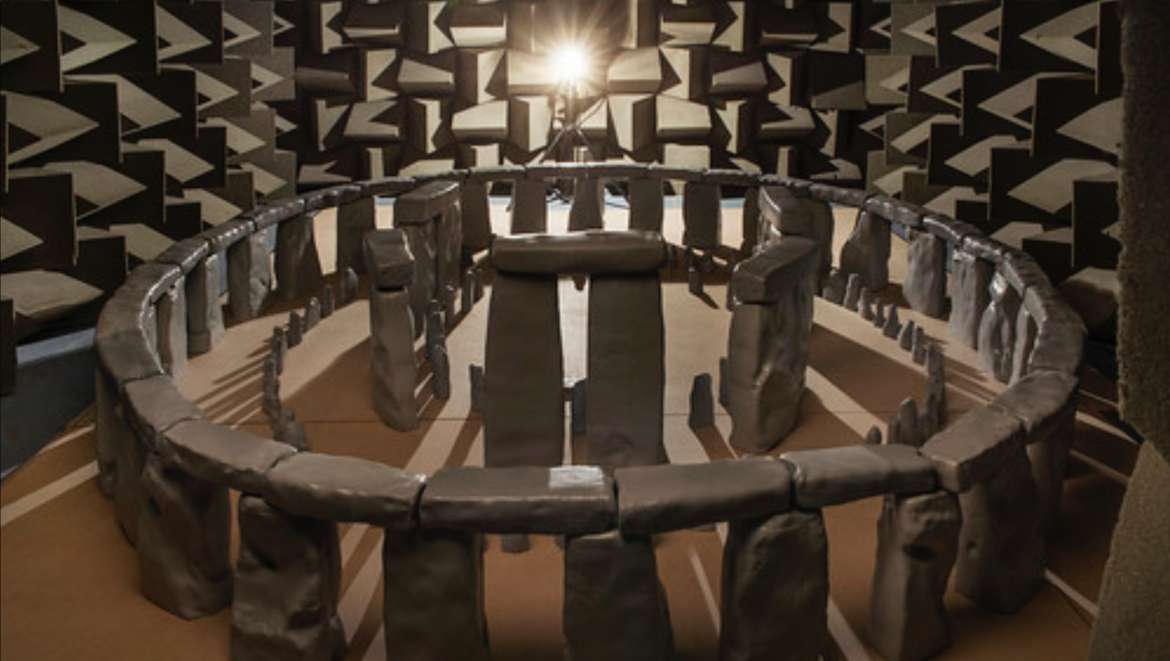
Stonehenge might have not actually been an arena to watch guys in hooded robes and glitter eyeshadow act all otherworldly, but it did have killer acoustics. At least the way it was recently found to have been configured to amplify sound but still keep it inside defies the notion that no one knew how to achieve special effects during the Stone Age. University of Salford professor Trevor Cox and his research team worked backwards — instead of building a scale model of a future concert hall, they used the prehistoric gathering place to create such a model. The Spinal Tap-size Stonehenge they created could literally speak (or sing) of its secrets.

“Getting the size, shape and location of the stones right is the most important aspect,” Cox, who led a study recently published in Journal of Arachaeological Science, told SYFY WIRE. “To do that we used a computer reconstruction from Historic England that follows the best current archaeological evidence. The stones themselves were made hard and impervious so sound readily reflected off them as happens with stones.”


Credit: Trevor Cox

There were no such things as mics and amps 5,000 years ago. People who had something to say to others, or to their gods, needed to be in a place that was made for their voices to be heard. The reverse building of Stonehenge needed sound frequencies to be 12 times what they were estimated to have been in the original monument. While the actual rituals that took place at Stonehenge can only be guessed at, the way it is constructed to let light in at a particular angle during the the winter and summer solstice suggests ancient Pagan ceremonies. This could be why it was constructed to keep intonations or music inside the scared circle.

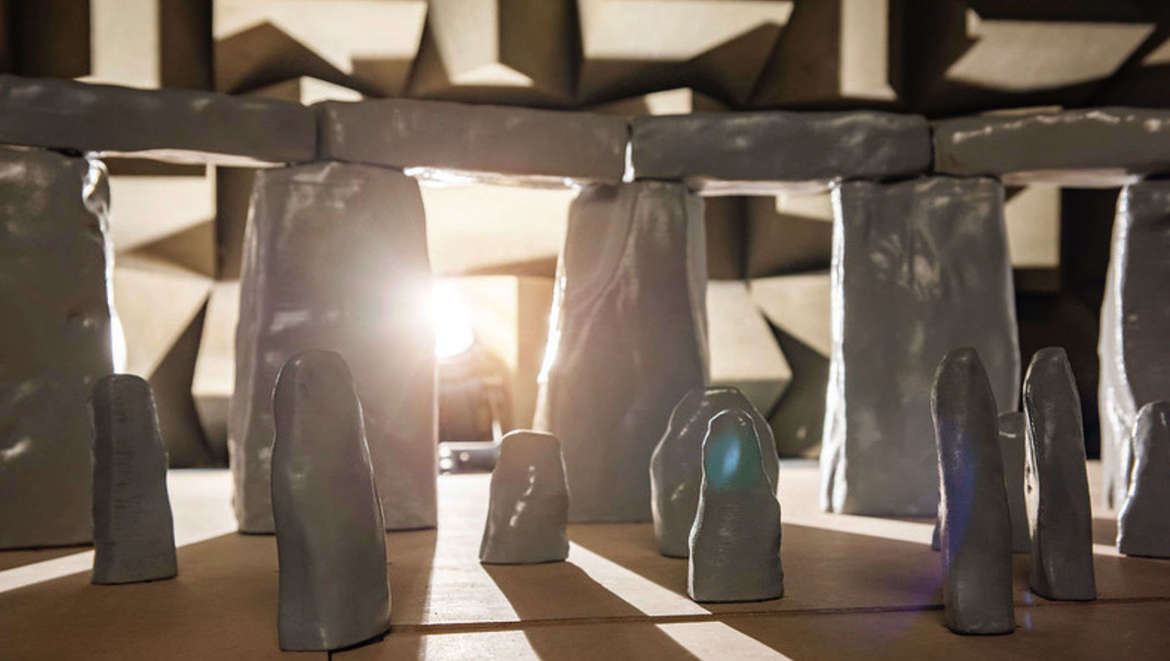
To create what could pass as a much more accurate Spinal Tap prop, Cox and his team 3D-printed versions of the 27 types of megalithic stones found at Stonehenge. They then used these replicas to make molds and cast enough to create a scaled-down version of what was once a 157-stone monument. The replicas were filled various materials meant to come as close as possible to the texture and density of the actual stones. Only 63 complete and 12 fragmented stones exist today, and most have suffered from erosion and other ravages of time. However, Cox was careful to note that despite his findings on the acoustics at Stonehenge, sound was only a secondary consideration in how Stonehenge was built.


Credit: Trevor Cox
“I doubt that they built Stonehenge for the sound,” he said. “other considerations like astronomical alignments are much more likely to have determined the construction. More likely they built it, and then found it helped enhance speech and musical sounds, which then could have influenced how they used the site."

Since its construction, Stonehenge is obviously not as it used to be. Missing stones and the wear of thousands of years has affected how sound is heard within. Stone reflections create the reverberation that amplifies sound. An incomplete monument means that there are not as many stones to give an accurate representation of what that reflection must have once sounded like. Surprisingly, the recreation showed that the original was lacking in echoes that had been hypothesized before. Reflections were obscured and scattered by the inner sanctum of bluestones and trilithons, or structures consisting of two upright sarsen stones with a third lying horizontally across them. The stones were rearranged several times during the Neolithic age, but Cox argues the acoustic changes resulting from this were inaudible.


The scale model revealed that most sounds made within Stonehenge were probably not heard well by outsiders, and the same goes for sounds occurring outside the circle, which must have not been heard well by anyone on the inside. Whether it was the builders’ intention to keep sacred incantations from escaping hallowed ground, or to prevent outside noise from interfering with rituals — or both — remains unknown.

"When we get together for a ceremony we make sounds: speaking, singing or playing music," Cox said. "It is reasonable to assume similar sounds were being made in Stonehenge in prehistory. What our results show is that the amplification of sound via stone reflections happens only within the stone circles, and sound does not readily pass from inside to outside the circle. Consequently, if you're holding a ceremony there, it works best if everyone is inside the circle."

More may be demystified in the future, but some things that emerge from shadows of the past may forever keep their mystery.


Return of Myanmar's smiling turtle is reason to be cheerful

The Burmese roofed turtle was once down to a few individuals in the wild but captive breeding has been a runaway success

Smiling close up of the Burmese roof turtle
Smiling close up of the Burmese roofed turtle. Photograph: Myo Min Win/WCS Myanmar
Poppy Noor

If you want to turn your frown upside down this morning, a story about smiling turtles saved from extinction in Myanmar might just do the trick.

The Burmese roofed hatchling, whose upturned mouth makes it appear to have a constant smile on its face, was once the second-most critically endangered turtle in the world. Only five or six adult females and two adult males are known to exist in the wild. But last week, conservationists from the Wildlife Conservation Society (WCS) and the Turtle Survival Alliance announced they had successfully raised 1,000 of the turtles in captivity, and say the smiling turtle will soon be ready for release into the wild.

As recently as 2017, officials at the WCS were still letting out a sigh of relief whenever the female turtles emerged to lay their eggs, but now it claims the turtle faces “little danger of biological extinction”.

The turtle was once abundant, but was pushed to the brink of extinction due to hunting, overexploitation of eggs, improper egg harvesting, electro-fishing and destruction of its natural habitat because of gold mining.

To recreate its natural habitat, conservationists use sandbanks as nesting sites. The sites are monitored and eggs are collected and incubated under natural conditions at a secure facility in Limpha village, Sagaing region, Myanmar.

Smiling Burmese roof turtle emerging from an egg.
Smiling Burmese roof turtle emerging from an egg. Photograph: Myo Min Win/WCS

The turtle originated in Myanmar, and was previously thought to be extinct – until researchers in a village along the Dokhtawady River in Myanmar found the shell of a recently killed turtle in 2002.

Between then and 2011, conservationists managed to grow its captive population to over 400 turtles housed at Yadanbon Zoological Gardens in Mandalay – which at the time was thought to represent “a remarkable conservation success story”.

To prevent crowding, about 50 of the turtles bred at Yadanbon Zoo were then taken to a new facility to divide the captive gene pool and prevent what the Turtle Survival Alliance called an “eggs all in one basket scenario”, risking a catastrophic loss if something happened to the turtle population at that one facility.

The turtles will eventually be returned to the Chindwin River for reintroduction to the wild.