Friday, April 30, 2021

Fish have been swallowing microplastics since the 1950s

Museum collections reveal the history of microplastics


FIELD MUSEUM

Research News

IMAGE

IMAGE: A THIN, THREAD-LIKE STRAND OF MICROPLASTIC FROM A FISH'S DIGESTIVE TRACT. view more 

CREDIT: LOREN HOU

Forget diamonds--plastic is forever. It takes decades, or even centuries, for plastic to break down, and nearly every piece of plastic ever made still exists in some form today. We've known for a while that big pieces of plastic can harm wildlife--think of seabirds stuck in plastic six-pack rings--but in more recent years, scientists have discovered microscopic bits of plastic in the water, soil, and even the atmosphere. To learn how these microplastics have built up over the past century, researchers examined the guts of freshwater fish preserved in museum collections; they found that fish have been swallowing microplastics since the 1950s and that the concentration of microplastics in their guts has increased over time.

"For the last 10 or 15 years it's kind of been in the public consciousness that there's a problem with plastic in the water. But really, organisms have probably been exposed to plastic litter since plastic was invented, and we don't know what that historical context looks like," says Tim Hoellein, an associate professor of biology at Loyola University Chicago and the corresponding author of a new study in Ecological Applications. "Looking at museum specimens is essentially a way we can go back in time."

Caleb McMahan, an ichthyologist at the Field Museum, cares for some two million fish specimens, most of which are preserved in alcohol and stored in jars in the museum's underground Collections Resource Center. These specimens are more than just dead fish, though--they're a snapshot of life on Earth. "We can never go back to that time period, in that place," says McMahan, a co-author of the paper.

Hoellein and his graduate student Loren Hou were interested in examining the buildup of microplastics in freshwater fish from the Chicagoland region. They reached out to McMahan, who helped identify four common fish species that the museum had chronological records of dating back to 1900: largemouth bass, channel catfish, sand shiners, and round gobies. Specimens from the Illinois Natural History Survey and University of Tennessee also filled in sampling gaps.

"We would take these jars full of fish and find specimens that were sort of average, not the biggest or the smallest, and then we used scalpels and tweezers to dissect out the digestive tracts," says Hou, the paper's lead author. "We tried to get at least five specimens per decade."

To actually find the plastic in the fishes' guts, Hou treated the digestive tracts with hydrogen peroxide. "It bubbles and fizzes and breaks up all the organic matter, but plastic is resistant to the process," she explains.

The plastic left behind is too tiny to see with the naked eye, though: "It just looks like a yellow stain, you don't see it until you put it under the microscope," says Hou. Under the magnification, though, it's easier to identify. "We look at the shape of these little pieces. If the edges are frayed, it's often organic material, but if it's really smooth, then it's most likely microplastic." To confirm the identity of these microplastics and determine where they came from, Hou and Hoellein worked with collaborators at the University of Toronto to examine the samples using Raman spectroscopy, a technique that uses light to analyze the chemical signature of a sample.

The researchers found that the amount of microplastics present in the fishes' guts rose dramatically over time as more plastic was manufactured and built up in the ecosystem. There were no plastic particles before mid-century, but when plastic manufacturing was industrialized in the 1950s, the concentrations skyrocketed.

"We found that the load of microplastics in the guts of these fishes have basically gone up with the levels of plastic production," says McMahan. "It's the same pattern of what they're finding in marine sediments, it follows the general trend that plastic is everywhere."

The analysis of the microplastics revealed an insidious form of pollution: fabrics. "Microplastics can come from larger objects being fragmented, but they're often from clothing," says Hou--whenever you wash a pair of leggings or a polyester shirt, tiny little threads break off and get flushed into the water supply.

"It's plastic on your back, and that's just not the way that we've been thinking about it," says Hoellein. "So even just thinking about it is a step forward in addressing our purchases and our responsibility."

It's not clear how ingesting these microplastics affected the fish in this study, but it's probably not great. "When you look at the effects of microplastic ingestion, especially long term effects, for organisms such as fish, it causes digestive tract changes, and it also causes increased stress in these organisms," says Hou.

While the findings are stark--McMahan described one of the paper's graphs showing the sharp rise in microplastics as "alarming"--the researchers hope it will serve as a wake-up call. "The entire purpose of our work is to contribute to solutions," says Hoellein. "We have some evidence that public education and policies can change our relationship to plastic. It's not just bad news, there's an application that I think should give everyone a collective reason for hope."

The researchers say the study also highlights the importance of natural history collections in museums. "Loren and I both love the Field Museum but don't always think about it in terms of its day-to-day scientific operations," says Hoellein. "It's an incredible resource of the natural world, not just as it exists now but as it existed in the past. It's fun for me to think of the museum collection sort of like the voice of those long dead organisms that are still telling us something about the state of the world today."

"You can't do this kind of work without these collections," says McMahan. "We need older specimens, we need the recent ones, and we're going to need what we collect in the next 100 years."

###
Stalagmites Embody Clock-Like Chronicles of Time Over Thousands of Years


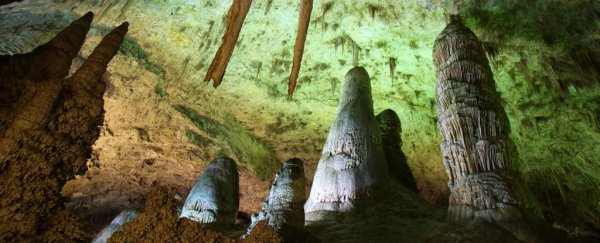
Stalagmites in Carlsbad Caverns, New Mexico. (Cabezonication/Getty Images)

PETER DOCKRILL
26 APRIL 2021

Deep underground, in mysterious caverns that seem almost measureless to humans, caves have devised their own strange ways of keeping time as the eternities pass by.

Over millennia, a ponderous exchange takes place so slowly, it makes the growing of grass look action-packed in comparison. Hanging from cave ceilings, downward-growing stalactites drip water containing chemicals onto the cave floor, which slowly aggregates into an upward-growing stalagmite.

Scientists have understood the basics of this speleothem relationship for a long time, but we're still discovering just how much of the ancient past is inscribed in these underground formations: echoes of ancient wildfires, sagas of societal collapse, and even grim predictions of our own destiny.

In a new study led by geochemist Andy Baker from UNSW in Australia, researchers have now found that stalagmites don't just record these dramatic instances of sudden and extreme climate events – they also act as natural timekeepers, chronicling the steady passage of time into the layers of rocks they become.

"Our new global analysis shows that we can consider stalagmite growth as being like a metronome and very constant over hundreds and thousands of years," Baker explains.

"In general, stalagmite growth is predictable and it is this unique property that makes them so valuable to researchers – you can tell the time in the past by using the very regular growth rings that are widely present across the globe."

In their research, Baker and his team analyzed stalagmites from 23 caves across 6 continents, looking for any common mechanisms that might explain their development.

They found that stalagmite growth rates increased in line with warmer temperatures, and that the formations only seem to grow in regions with seasonal precipitation.

While many kinds of climate disturbances can affect the ways stalagmites develop, once you average out these extreme episodes, the growth rate over time is relatively common and consistent across the globe – not to mention mind-bogglingly slow.

"The 'global average stalagmite' increased in height by about one meter over the last 11,000 years," Baker says.

Over such epic timeframes, stalagmites generally grow in an ordered fashion, much like tree rings, except for when long-lasting, multi-year disturbances – such as prolonged wet or dry years associated with things like El Niño or La Niña events – stand out in the record.

When those disturbances pass, though, the stalagmite growth layers (laminae) return to their regular rhythm, informed by the consistency of moisture descending onto them from above.

"Stalagmite accumulation rate is relatively unchanging over time," the researchers write in their paper.

"This is because their drip water source has enough volume and a stable chemical composition to be a buffer to rapid changes. Year‐to‐year, we see a 'flickering', where accumulation rate returns toward the long‐term average, also due to this buffering effect."

For these reasons, the researchers say stalagmites have much to teach us about the chronology of the ancient past – a vast archive of climate‐related proxy data we've only just begun to explore.

The findings are reported in Reviews of Geophysics.
Breathtaking New Hubble Image Shows a Giant Star on The Brink of Annihilation


DAVID NIELD
27 APRIL 2021


The spectacle of space has our jaws constantly dropping, and the picture that was just released to celebrate 31 years of the Hubble Space Telescope is another incredibly powerful shot that we could gaze at for hours.


It shows the giant, ultra-bright star AG Carinae, 20,000 light-years away from Earth, in a phase that makes it a Luminous Blue Variable (LBV) – where massive stars such as this one go through thousands of years of instability and varying luminosity.

Some 70 times bigger and around 1 million times brighter than our own Sun, AG Carinae is battling itself as it tries to avoid complete annihilation. With gravity pushing inwards and radiation pushing outwards at almost unimaginable levels, the star reaches pressure points where its outer layers blast off in an explosion – as shown in this image.

(NASA, ESA, STScI)

What you can see around AG Carinae is a gigantic nebula, an expanding shell of gas and dust, around five light-years wide – that's the same distance from our planet to Alpha Centauri, our next nearest star, to give you a sense of scale.

This particular eruption happened several thousand years ago. You can see both red material, which is glowing hydrogen gas laced with nitrogen gas, and blue material, which is dust clumps pushed out from the star.


Stellar winds are traveling away from the star at around 1 million kilometers (621,371 miles) per hour, eventually catching up to the circling material and pushing it out into space. To the top left of the photo you can see a more diffuse area of red, where the stellar winds have burst through.

The tadpole-like shapes in blue are clumps of dust that the winds have specifically sculpted. It's thanks to Hubble, and the way it can capture both visible and ultraviolet light from above Earth's atmosphere, that we can see all this in so much detail.

Outbursts like this one will happen a few times during the lifetime of an LBV, and in this case it's estimated that AG Carinae has pushed out a volume of material that's equivalent to 10 times the mass of our Sun.

These spectacular shows happen when a star is about to come apart: by shedding all of these outer layers, the LBV can shrink again and become stable... at least for a while. These stars only live for a few million years (rather than the 10-billion-year lifetime of our Sun).

"I like studying these kinds of stars because I am fascinated by their instability," says astronomer Kerstin Weis, from Ruhr University in Germany. "They are doing something weird."

Happy birthday Hubble, and thanks for all the fantastic images. Since 24 April 1990, the telescope has made over 1.5 million observations of around 48,000 celestial objects.
Earth Is Using 173% of The World's Total 'Biocapacity', Scientists Warn


(Monty Rakusen/Getty Images)

CARLY CASSELLA
27 APRIL 2021

Humans around the world are consuming far more natural resources than our planet can continue to sustain, condemning the majority of people to ecological poverty, according to new research.

When researchers tried to put a number on our natural resource deficit for the year 2017, they found our global population of over 7.5 billion people had spent 173 percent of the world's total biocapacity that year.

This is obviously a major overshoot, and it's part of a trend that has gotten much worse in recent decades. In 1980, humanity was using only 119 percent of the world's biocapacity.

Much of the surge in demand since then has been driven by wealthier nations, requiring higher and higher standards of living, even if they have to buy resources from elsewhere.

Today, nearly three quarters of all people live in nations with lower-than-average incomes and a scarcity of natural resources, which means they simply can't compete.

Clearly, the path we are on today cannot be trod forever. If the world is truly serious about eradicating poverty, then experts say we cannot keep ignoring the limiting factor that is Earth's resources.

Dividing the world's countries into four categories, based on their gross domestic product (GDP) per capita and their local ecological deficit, researchers have illustrated an unsustainable shift in humanity's demand for resources.


If we don't seek to rapidly improve resource security - through conservation and restoration, fossil fuels cuts, sustainable development, and shifting consumption patterns - the authors argue our natural capital will be unable to recover, and our hope for a more equal future will be wholly undermined.

In the year 1980, 57 percent of the global population lived in a country with the "double curse" of a below-average income and a deficit in biological resources, the researchers found. In 2017, that number had jumped to 72 percent.


On the other hand, higher income countries with resource deficits make up only 14 percent of the world population, but this minority demands an astonishing 52 percent of the planet's biocapacity.

Switzerland and Singapore are two notable nations that fall into this latter category, which means they are shielded from resource insecurity because they have the money to buy what they need from other places.

To live in a truly sustainable way, scientists think we should be using no more than half our planet's resource capacity, but if everyone in the world lived like those in higher income, low resource countries, like Switzerland, we would need roughly 3.67 planet Earths to meet global demand.

"If the development patterns of these cities or territories are not replicable, there is only one way for such entities to avoid their own demise: they must be certain that they can financially outcompete everybody else on this planet forever to secure their resource metabolism," the authors conclude.

"Requiring such a strategy to succeed is precarious for regions at any income level."

But it's especially dangerous for lower income regions, who cannot compete for resources at the same level. Without assistance from wealthier nations, there's really not a lot these nations can do.

In fact, researchers argue lower income countries currently face a catch-22. Continuing with the status quo will no doubt make their current resource crisis worse, but making rapid changes to human resource consumption will also cost a lot of money, which many simply cannot afford.

What's more, because wealthier nations consume many more resources than are absolutely necessary to live, they have much more wiggle room in the face of future disaster.

In an economic downturn, for instance, a loss of resources isn't as catastrophic for Spain as it would be for Niger or Kenya, where such a rapid loss could erode food and energy security for many more people, putting their very lives at risk.

"This paper strengthens the case that biological resource security is a far more influential factor contributing to lasting development success than most economic development theories and practices would suggest," the authors conclude, "and shows how unevenly it affects distinct human populations."

Clearly, we are spending more than humanity or our planet can afford.

The study was published in Nature Sustainability.


2 Simple Charts Show When You Don't Need to Wear a Mask Under New CDC Guidelines

HILARY BRUECK, BUSINESS INSIDER
28 APRIL 2021

The Centers for Disease Control and Prevention wants people to know there are clear, personal benefits to getting vaccinated.

On Tuesday, the agency released new guidelines for when fully vaccinated people – that is, those who've allowed their shot(s) two full weeks to take effect – can take off their masks.


"We all miss the things that we used to do before the pandemic," CDC Director Rochelle Walensky said, announcing the new guidance.

"If you are fully vaccinated and want to attend a small outdoor gathering with people who are vaccinated and unvaccinated, or dine at an outdoor restaurant with friends from multiple households, the science shows – if you're vaccinated – you can do so safely, unmasked."

The chart below, from the CDC, shows which activities the agency considers safe to do unmasked outside.

You'll note that fully vaccinated people can do almost anything outdoors without a mask, with the notable exception of attending a crowded event, like a parade, game, or concert.

(Centers for Disease Control and Prevention)

The CDC is loosening the reins a little bit for unvaccinated folks as well – suggesting it's OK to go outside without a mask on, as long as you're just:
Venturing out for some exercise with members of your own household (and not coming into close physical contact with others while you're walking, biking, or running).
Or, going to a small outdoor gathering with fully vaccinated friends or family.


In all other cases, the CDC still stresses that masks should be worn, especially when people are indoors.

During the briefing, Walensky reiterated that the science is clear now that the risks of catching the coronavirus are much lower outdoors, where there's near infinite ventilation, than inside.

"There's almost a 20-fold increased risk of transmission in the indoor setting," she said.

"That, coupled with the fact that we now have 37 percent of people over the age of 18 fully vaccinated, and the fact that our case rates are now starting to come down, motivated our change in guidance."

Indoors, in public spaces, the CDC still says everyone should wear masks.

The chart below, with vaccinated people in green, and unvaccinated in yellow and red, is meant to demonstrate the relative risks of doing activities indoors during the pandemic, even with a mask on.

You'll note that singing, exercising, and eating indoors, all activities where people may potentially be emitting more infectious viral particles into the air, are considered less safe for unvaccinated people than vaccinated. The chart below has unvaccinated people on the left, and vaccinated on the right:

  
(Centers for Disease Control and Prevention)

This article was originally published by Business Insider.
A Massive Study of Nearly Every Glacier on Earth Just Revealed a Devastating Trend


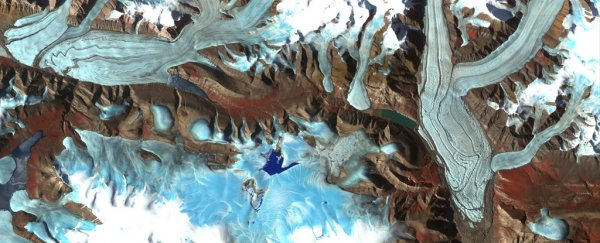
Chapman glacier in Canada. (NASA/METI/AIST/Japan Space Systems, and US/Japan 

NICOLETTA LANESE, LIVE SCIENCE
29 APRIL 2021


Earth's glaciers are shrinking, and in the past 20 years, the rate of shrinkage has steadily sped up, according to a new study of nearly every glacier on the planet.

Glaciers mostly lose mass through ice melt, but they also shrink due to other processes, such as sublimation, where water evaporates directly from the ice, and calving, where large chunks of ice break off the edge of a glacier, according to the National Oceanic and Atmospheric Administration (NOAA).


By tracking how quickly glaciers are shrinking, scientists can better predict how quickly sea levels may rise, particularly as climate change drives up average global temperatures.

But estimating the rate of glacier shrinkage can be notoriously difficult; past estimates relied on field studies of only a few hundred glaciers out of the more than 200,000 on Earth, as well as sparse satellite data with limited resolution, the authors noted in their new study, published Wednesday (April 28) in the journal Nature.

Some of this satellite data captured changes in surface elevation, but only sampled a few places and at sparse time points.

Other satellites detected slight shifts in the Earth's gravitational field, but could not disentangle how much glacier shrinkage contributed to these shifts, as opposed to mass changes in ice sheets or solid earth, for instance.

Related: Time-lapse images of retreating glaciers

To zero in on a more precise estimate, the team used myriad satellite and aerial images to survey 217,175 glaciers, accounting for nearly all of Earth's glaciers.

In particular, a 20-year archive of images from NASA's Advanced Spaceborne Thermal Emission and Reflection Radiometer (ASTER), a high-resolution sensor aboard the Terra satellite, supplied the team with a wealth of data and allowed them to make more certain estimates of glacier mass loss through time.


"We not only have the complete spatial coverage of all glaciers, but also repeat temporal sampling," meaning measurements taken from many points in time, said first author Romain Hugonnet, a doctoral student at the University of Toulouse in France and the Laboratory of Hydraulics, Hydrology and Glaciology (VAW) at ETH Zürich in Switzerland.

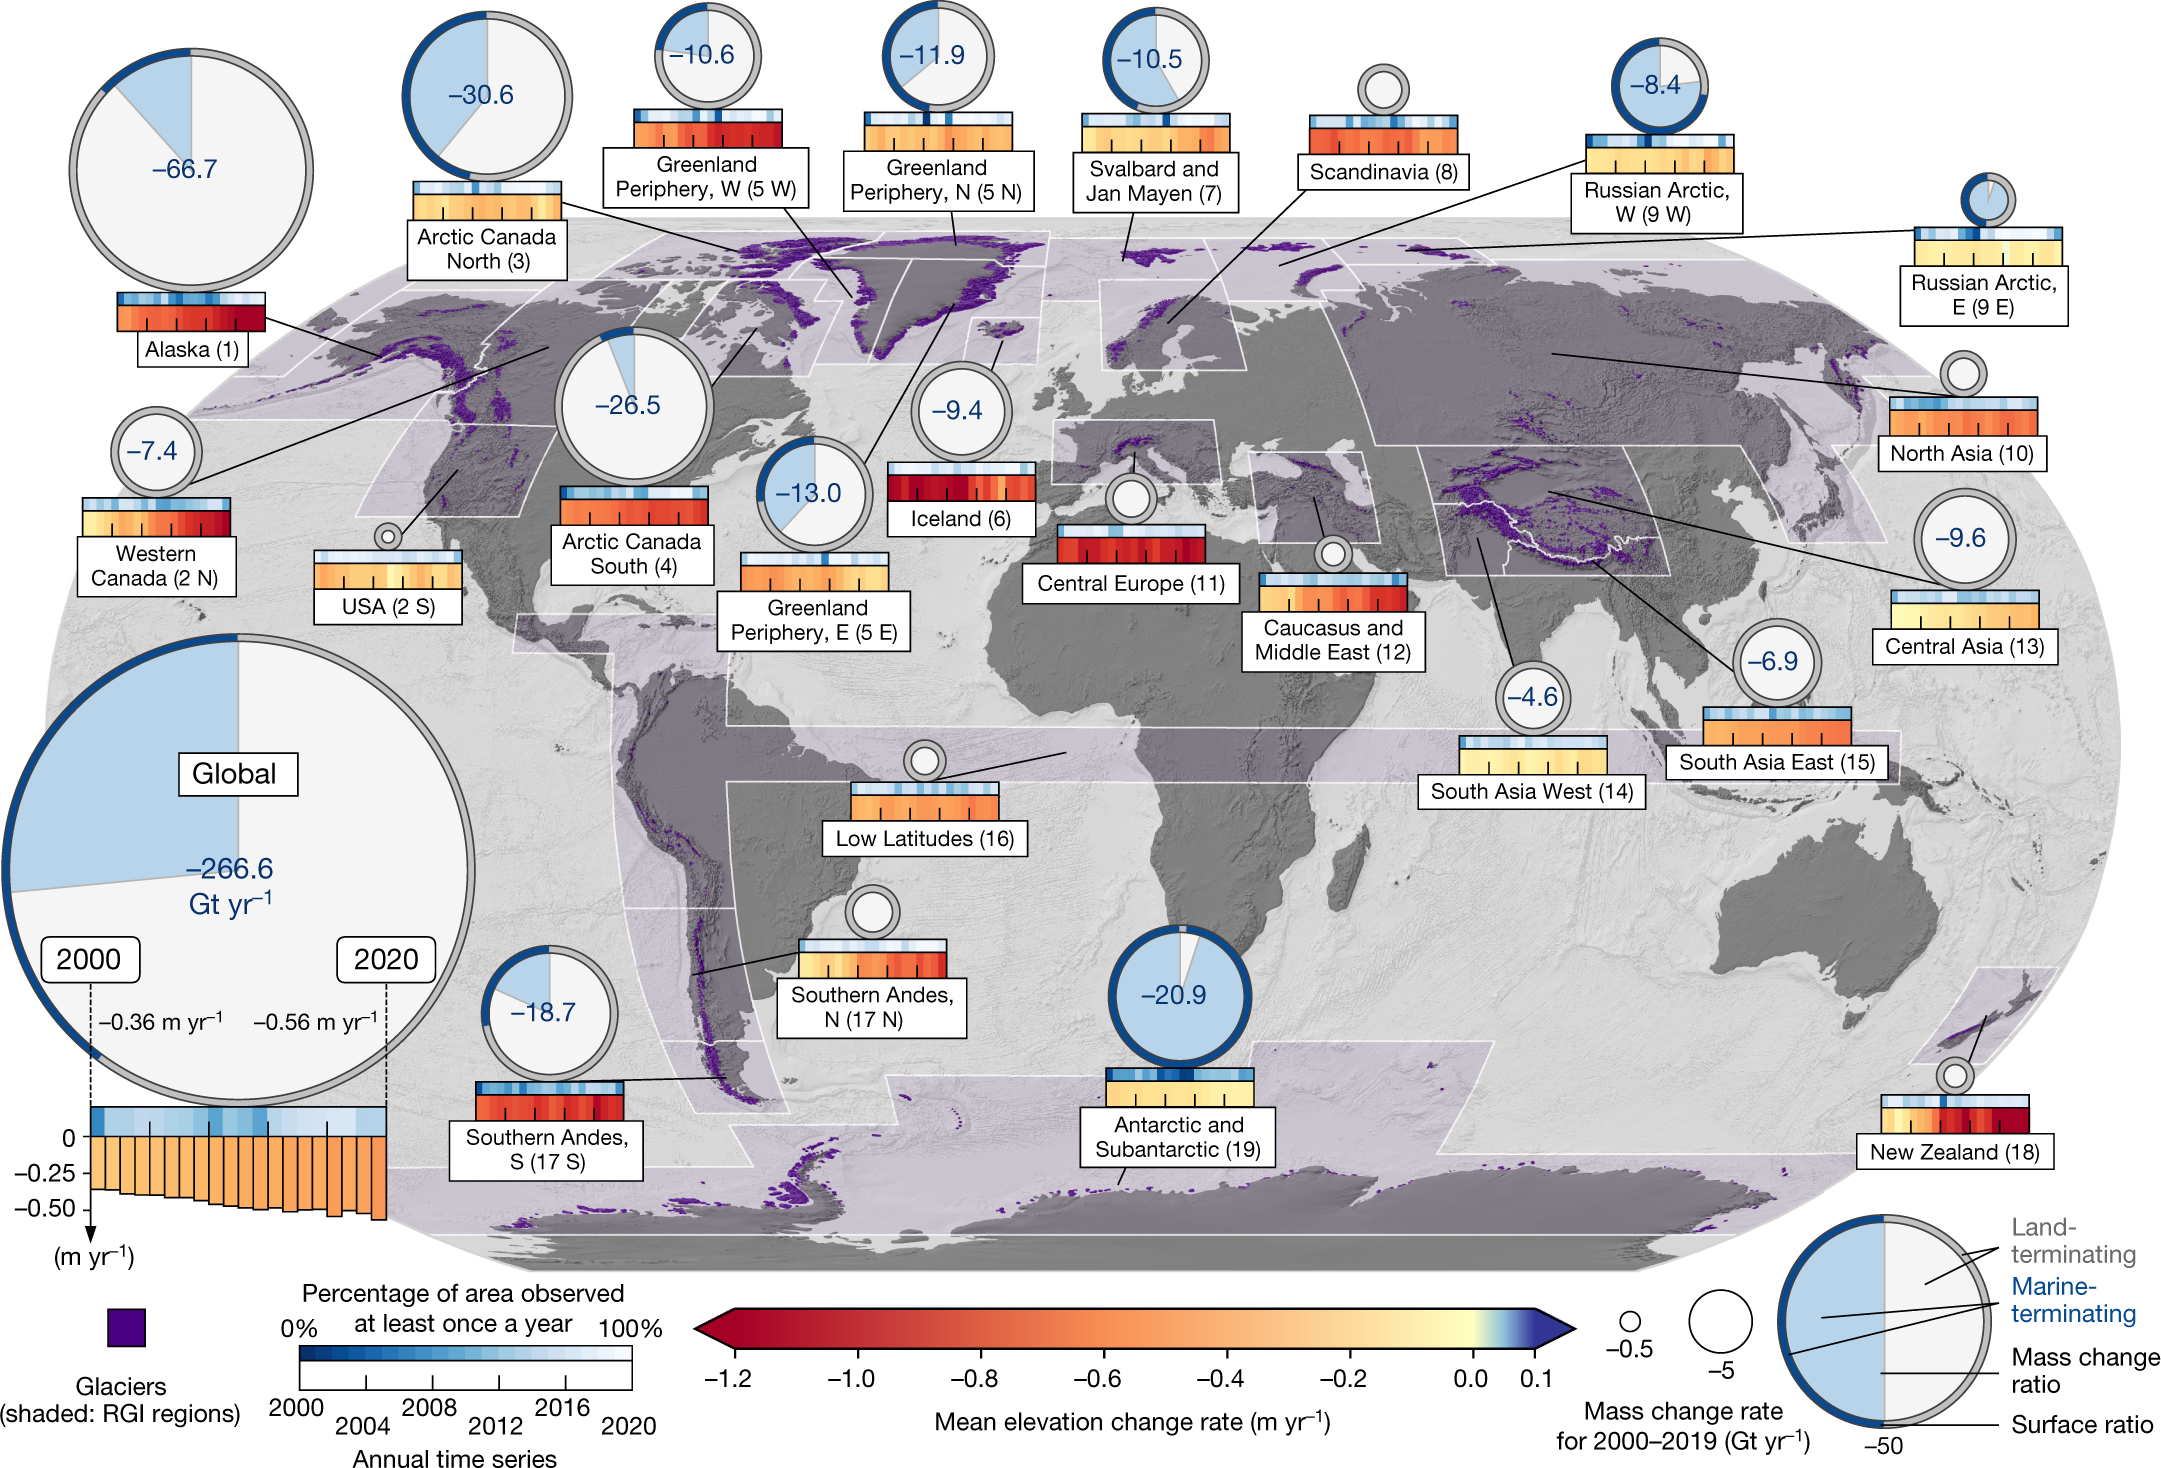
The team found that, between 2000 and 2019, glaciers collectively lost an average of 293.7 billion tons (267 billion metric tonnes) of mass per year, give or take 17.6 billion tons (16 billion metric tonnes); this accounts for about 21 percent of the observed sea-level rise in that time frame, the authors noted.

Regional and global mass change rates with time series of mean surface elevation change rates for glaciers. (Hugonnet et al., Nature, 2021.)

And for each decade since 2000, the overall rate of glacier mass loss has been accelerating, increasing by about 52.8 billion tons (48 billion metric tonnes) per year, which may account for an observed acceleration in sea-level rise.

These estimates significantly narrow the uncertainty around how much mass glaciers lost in recent decades, Hugonnet said.

For instance, the latest report from the Intergovernmental Panel on Climate Change (IPCC) and a recent global study, published in 2019 in the journal Nature, both calculated mass loss estimates in the same ballpark as the new study; but their margins of error spanned several hundred gigatonnes on either side.


Hugonnet and his team were able to greatly reduce this uncertainty by using the ASTER data.

ASTER captures images on the visible and near-infrared spectrum, "so almost what we see with our own eyes," Hugonnet said.

Because the sensor orbits Earth about 438 miles (750 kilometers) above the planet's surface, it can snap images of the same locations from multiple angles: once as it passes directly over a spot and once as if it's "looking back" from where it came.

The two snapshots can then be used to reconstruct the 3D topography of Earth's surface, and in this case, the 3D structure of glaciers across the planet. Hugonnet and his team quantified these changes in volume and then multiplied that by the density of glacier ice, to determine how much mass the glaciers had lost.

The group also double-checked their work against data from NASA's Ice, Cloud, and land Elevation Satellite (ICESat) and Operation IceBridge campaigns, a NASA project in which a fleet of research aircraft surveys Earth's polar ice.

This additional data confirmed that the ASTER images generally matched up with other available data front the same time period, and it also helped the team correct for statistical "noise" in the ASTER data.


Using these methods, the team calculated a fairly confident estimate, but some uncertainty still remains, Hugonnet said.

"The problem with glaciers is that we're not only losing ice, we're also losing firn," a kind of partially compacted snow usually found on top of glaciers, he said. The current study didn't differentiate firn from ice when estimating mass loss, "so it's, right now, our largest source of uncertainty," in terms of nailing down a precise rate, Hugonnet said.

In addition, the team noted that not all Earth's glaciers lost mass at the same rates. "What was even more interesting, and a bit surprising, was to see that some regions decelerated and others accelerated," Hugonnet said.

For instance, mass loss from glaciers in Alaska and western Canada ramped up significantly in the study time frame, while loss from Icelandic, Scandinavian and southeast Greenland glaciers slowed between the early 2000s and late 2010s.

Zooming in on these regions, the authors found that regional climate conditions, specifically long-term fluctuations in precipitation and temperature, helped explain these stark differences.

So while Iceland, Scandinavia and Greenland entered a decade of relatively cool, wet conditions in the second decade of the 21st century, northwestern North America entered a relatively dry period, meaning glaciers ultimately lost more ice than they gained snow.

"We have those fluctuations that exist in some regions and can last for about a decade, sometimes," Hugonnet said.

"This is also why we need such globally complete sets of observations, such as the one we provided," he noted.

Tracking average glacier mass loss, on a global scale, can help scientists predict global sea-level rise; but on a local scale, glacier mass loss can drastically alter nearby bodies of water and the availability of water resources, as well as threaten to trigger disasters, such as avalanches and devastating spring floods, Hugonnet said.

So it's important to capture both the big picture and fine details.

Related content:

Images of melt: Earth's vanishing ice

Photo gallery: Antarctica's Pine Island Glacier cracks

In photos: Huge icebergs break off Antarctica

This article was originally published by Live Science. Read the original article here.

Thursday, April 29, 2021

A Curious Hadrosaur With Super-Weird Teeth Has Been Unearthed in Japan

Artist’s illustration of Y. izanagii (center) with other hadrosaurs. (Masato Hattori)

DAVID NIELD
29 APRIL 2021

Meet Yamatosaurus izanagii, a new genus and species of hadrosaur (or duck-billed dinosaur) discovered on a small island off the southern coast of Japan in 2004, and now identified in a new study.

As well as expanding the dinosaur family tree, the fossil find is going to be useful for experts trying to track the migration patterns of hadrosaurs.

While early members of the hadrosaur family most likely wandered across the Bering Land Bridge from Asia to North America, the migration could have become a two-way street, with some later clades returning.

This has given rise to questions over the origins of some later day hadrosaur genera found in places like Japan. Now, features of the partial skeleton and its estimated date – 71-72 million years ago, just before dinosaurs became extinct – tip the scales in favor of these late-blooming branches of the hadrosaur tree also starting in Asia, instead of in the other direction.

The new species follows the 2019 discovery by the same team of another hadrosaurid called Kamuysaurus, found on the northern Japanese island of Hokkaido.

"These are the first dinosaurs discovered in Japan from the late Cretaceous period," says paleontologist Yoshitsugu Kobayashi, from Hokkaido University Museum in Japan. "Until now, we had no idea what dinosaurs lived in Japan at the end of the dinosaur age."


"The discovery of these Japanese dinosaurs will help us to fill a piece of our bigger vision of how dinosaurs migrated between these two continents."

Part of the reason for the abundance and diversity of hadrosaurs was their chewing ability: the animals had hundreds of tightly packed teeth in their mouths, which were replaced from below as they wore down and fell out.

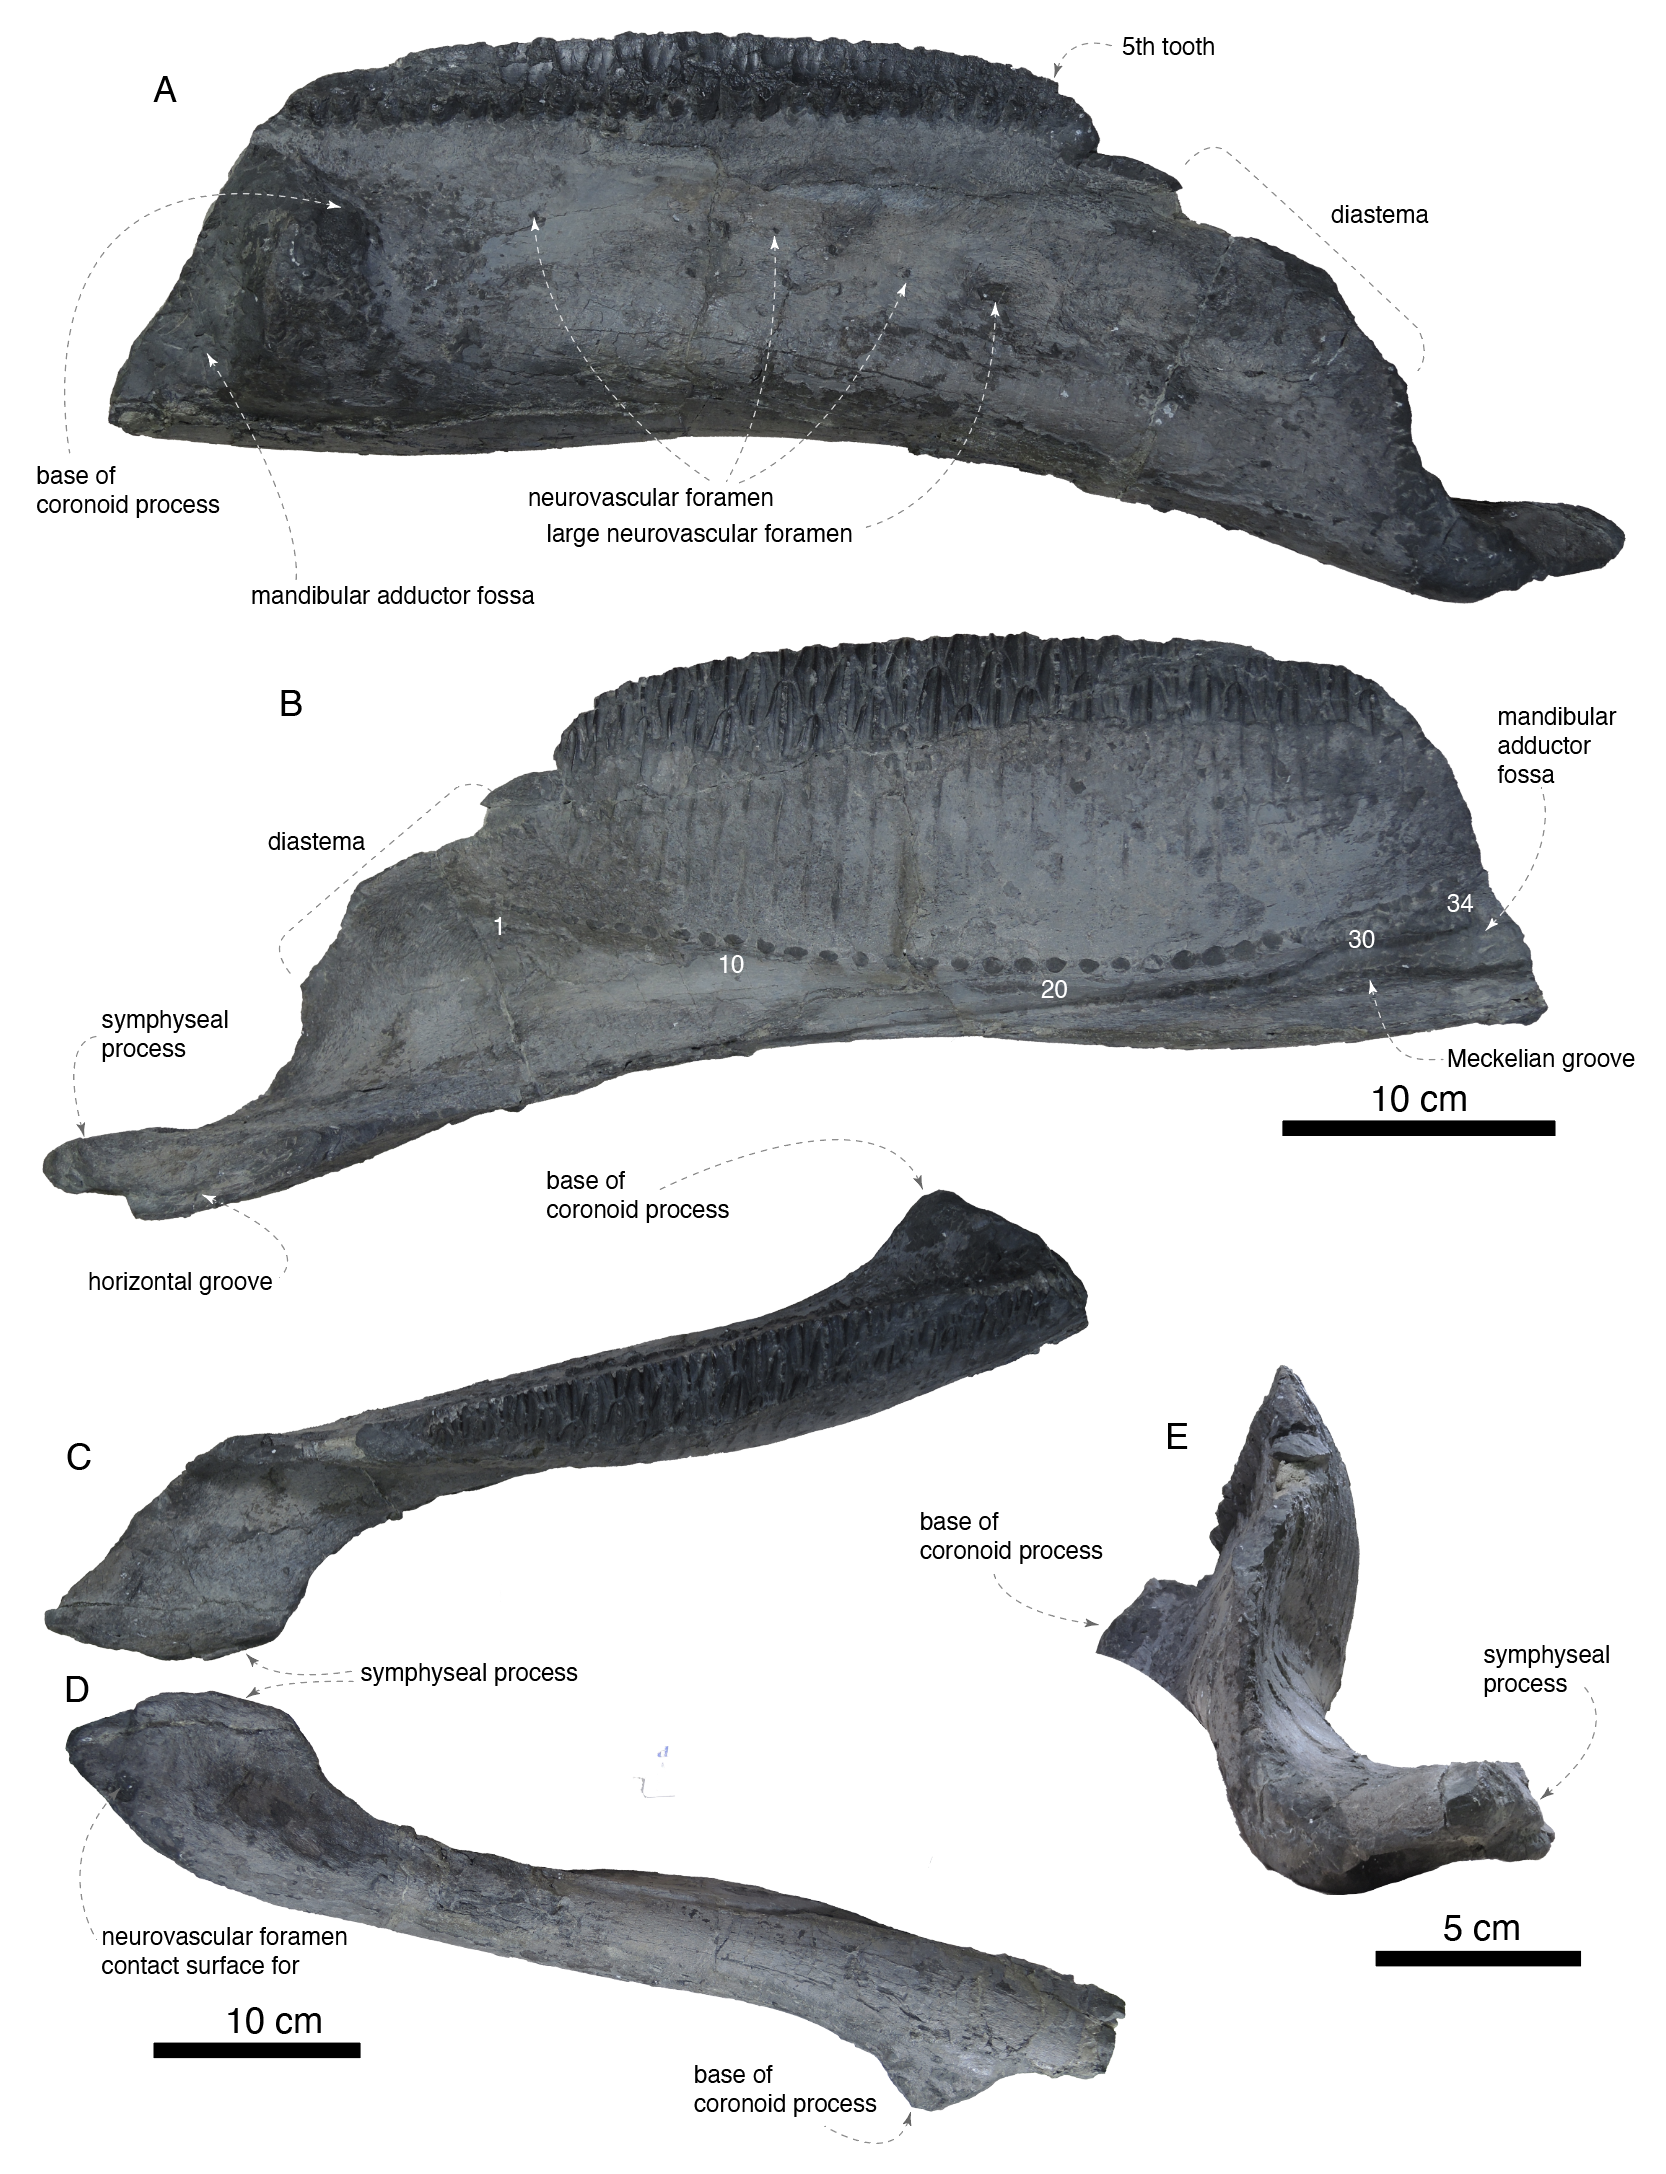
And it's the dental structure that makes Y. izanagii unique: the number and development of the teeth differs noticeably, and it probably evolved to feed on different types of vegetation to other hadrosaurs.

The right dentary of Y. izanagii distinguishes it from other known hadrosaurs. (SMU)

The researchers also noticed an unexpected level of development in the shoulder and forelimbs, marking an evolutionary step in the species from a bipedal to a quadrupedal dinosaur which could change how we interpret their evolution. It's another interesting variation in a dinosaur that dominated the Cretaceous period.

"In the far north, where much of our our work occurs, hadrosaurs are known as the caribou of the Cretaceous," says paleontologist Anthony Fiorillo, from Southern Methodist University in Texas.


The team behind the new study suggests that hadrosaurs could have crossed from Asia to present-day Alaska via the Bering land bridge, and then spread across almost the whole of North America. Japan was attached to Asia until around 15 million years ago.

And if you're wondering about the name, Yamato is the ancient name for Japan, while Izanagi is a god in Japanese mythology believed to have created the Japanese islands – starting with Awaji Island, where the new Yamatosaurus was found.

There's one more important point to take from the discovery and identification of Y. izanagii: the importance of teamwork. The original bones were uncovered by an amateur fossil hunter in a cement quarry.

"Japan is mostly covered with vegetation with few outcrops for fossil-hunting," says Kobayashi. "The help of amateur fossil-hunters has been very important."

The research has been published in Scientific Reports.

THE HADROSAUR IS ALBERTA'S OFFICIAL DINOSAUR
Extreme Poverty Will Be Reduced if We Tackle Climate Change Right, Study Shows


(Gaston Roulstone/Unsplash)

PATRICK GALEY, AFP
28 APRIL 2021

Ambitious climate policies could reduce extreme poverty in developing countries if governments opted for robust taxes on emitters that were then fairly distributed to help the poor, new research showed Tuesday.


Authors of the study said the results showed that policymakers were facing a false choice between climate change mitigation and poverty reduction.

Since fossil fuels and agricultural chemicals such as fertilizers are so heavily subsidized, any attempt to remove taxpayer support to these unsustainable practices frequently prompts fears of higher prices for consumers.

Industry lobbyists also argue that cheap sources of energy such as coal have a role to play in expanding access to electricity in developing countries.

Researchers at the Potsdam Institute for Climate Impact Research (PIK) used computer models to predict how levels of global poverty might be affected by various interventions aimed at limiting global warming.

They found that the world was on course to have around 350 million people living in extreme policy - i.e. on less than US$1.90 a day - by 2030, far short of the UN goal to eradicate extreme poverty by the end of the decade.

The authors noted that this figure did not factor in the economic disruption caused by the pandemic, or the adverse effects of climate change.


They then modeled in ambitious climate policies consistent with the 1.5 °C temperature goal of the Paris Agreement, and found that this could increase the number of people living in extreme poverty by an additional 50 million.

But when they modeled in equitable redistribution of national carbon price revenues - which would see poorer, and therefore lower-polluting sections of society receive money accrued from richer polluters - they found that this could compensate for the other effects of climate mitigation.

They even found it could slightly reduce the number of people living in poverty - about 6 million fewer by 2030.

"Climate policies safeguard people from climate change impacts like extreme weather risks or crop failure," said Bjoern Soergel, a PIK researcher and lead author of the study, published in Nature Communications.

"Yet they can also imply increased energy and food prices. This could result in an additional burden especially from the global poor, who are already more vulnerable to climate impacts."
'Climate dividend'

Soergel said that governments could combine emissions prices with international redistribution of the revenues they generated - a sort of "climate dividend".

"The revenues are returned equally to all citizens, which turns poorer households with typically lower emissions into net beneficiaries," he said.


The authors suggested a scheme of international climate finance transfers from high-income to low-income countries to offset the additional burden poorer nations face in seeking to limit climate change.

Just 5 percent of emission pricing revenues from industrialized nations would be enough to more than compensate for the policy side effects of climate mitigation in Sub-Saharan Africa, according to the study.

"Combining the national redistribution of emission pricing revenues with international financial transfers could thus provide an important entry point towards a fair and just climate policy in developing countries," said co-author Elmar Kriegler.

© Agence France-Presse
Serial Collapses of Ancient Pueblo Societies Carry a Stark Warning For Today's World


Puebloans Cliff Palace, Mesa Verde, Colorado. (Daniela Duncan)


TESSA KOUMOUNDOUROS
28 APRIL 2021

In the area where the Colorado, Utah, Arizona and New Mexican borders now meet, ancestral Pueblo societies thrived and then collapsed several times, over the span of 800 years.

Each time they recovered, their culture transformed. This shifting history can be seen in their pottery and the incredible stone and earth dwellings they created. During 300 of those years, some Pueblo peoples, who also used ink tattoos, were ruled by a matrilineal dynasty.

As in the collapse of other ancient civilizations, ancestral Pueblo social collapses align with periods of changing climate - but Pueblo farmers often persevered through droughts, suggesting that there was more to their collapses than just environmental conditions.

So archaeologists took a closer look at what was happening in these societies, before 1400 CE, leading up to their times of upheaval. Using tree-ring analyses of wood beams for building construction allowed the researchers to construct a time series of the Pueblo societies' productivity.

Peak construction periods were clustered around good maize growing seasons, even though these times, on average, were not climatically better for growing maize than when there was a lull in said construction.

The new research found that while the societies often bounced back fairly quickly after construction lulled, there were distinct slow-downs in recoverythat coincided with increased signs of violent.

This sort of system slowdown can be seen in other regional collapses of ancient societies like the Neolithic Europeans, that had no link to changing climates. It's also a feature of complex systems as diverse as the tropical rainforest and the human brain.

"Those warning signals turn out to be strikingly universal," said Wageningen University complexity scientist Marten Scheffer. "They are based on the fact that slowing down of recovery from small perturbations signals loss of resilience."

Scheffer and colleagues suspect slowly accumulating social tensions - like wealth inequality, racial injustice, and general unrest - wore away at social cohesion until all it took was a bit more pressure from another drought to tip them over the edge. This appears to have happened to the Pueblo peoples around 700, 900, and 1140 CE.

However, during the late 1200s, a combination of drought and external conflict spurred the ancestral Pueblo peoples to permanently leave the region.

"Societies that are cohesive can often find ways to overcome climate challenges," explained Washington State University archaeologist Tim Kohler.

"But societies that are riven by internal social dynamics of any sort – which could be wealth differences, racial disparities or other divisions – are fragile because of those factors. Then climate challenges can easily become very serious."

The ancient Pueblo peoples did find a way to thrive elsewhere, possibly by dramatically transforming their culture once more, and today their descendants live on tribal lands surrounding the empty places that were once the center of the Pueblo world. Their history provides us with a significant warning.

"Today we face multiple social problems including rising wealth inequality along with deep political and racial divisions, just as climate change is no longer theoretical," Kohler said. "If we're not ready to face the challenges of changing climate as a cohesive society, there will be real trouble."

If we want to avoid repeating history, we'd better pay attention.

Their research was published in PNAS (link not yet live at time of writing)
This Weird 'Horned' Crocodile Could Represent a New Branch on The Tree of Life

CLARE WATSON
28 APRIL 2021


An extinct 'horned' crocodile that once called Madagascar home has finally found its place on the tree of life, according to a new study of two skulls stored at the American Museum of Natural History.

Based on ancient DNA extracted from the museum specimens, researchers have posited that the horned crocodile was closely related to modern-day 'true' crocodiles which live throughout the tropics, but it sits on an adjacent branch of the crocodile family tree that split some 25 million years ago.

This rejigs scientific thinking about the horned crocodile's evolutionary relationships, which most recently had them pegged as relatives of dwarf crocodiles.

The study also suggests that the ancestor of modern crocodiles likely originated in Africa, and goes some way towards settling the long-standing controversy that has swirled about the horned crocodile's evolutionary history.

Voay robustus skull from southwestern Madagascar. (M. Ellison/©AMNH)

Heavy-built horned crocodiles, named for unusual bony protrusions atop their heads and known today as Voay robustus, roamed Madagascar alongside another, more slender crocodile, according to accounts from early explorers.

But while the Nile crocodile (Crocodylus niloticus) still inhabits the island to this day, and is the largest and most common crocodilian in all of Africa, horned crocodiles went extinct after humans arrived on Madagascar's shores, as early as 9,000 years ago.


"They blinked out just before we had the modern genomic tools available to make sense of the relationships of living things," said study author Evon Hekkala, a behavioral ecologist turned conservation geneticist at Fordham University in New York.

"And yet, they were the key to understanding the story of all the crocodiles alive today."

Understandably, horned crocodiles have been the focus of some intense study and debate amongst paleontologists. But after 150 years of investigations, researchers haven't been able to agree on where to place Madagascar's horned crocodile on the tree of life.

At first, horned crocodiles were described as a new species of "true crocodile" alongside the Nile crocodile. But then scientists thought they had more in common with shorter, smaller dwarf crocodiles.

An extinct crocodile skull analyzed for its DNA in the study. (M. Ellison/©AMNH)

Part of the problem is crocodiles are unusual beasts that look remarkably similar to their fossilized ancestors who lived some 200 million years ago. These physical similarities make teasing out the relationships between modern crocodiles and their ancient ancestors difficult.

"We've been trying to get to the bottom of the great diversity that exists among them," said Hekkala, who appears to have a knack for solving crocodilian mysteries using ancient DNA.


In 2011, as a graduate student, she discovered by genetic analysis that the Nile crocodile was actually two distinct species, not one – and the species differed by two whole chromosomes.

This time around, Hekkala and her colleagues mapped mitochondrial DNA extracted from the teeth of two V. robustus specimens and compared them against a few crocodilian reference genomes.

The horned crocodile skulls, which date back to around 1,300 to 1,400 years old, were collected on an expedition to southwest Madagascar between 1927 to 1930, and have been stored at the American Museum of Natural History ever since.

Mitochondrial DNA, which is passed from mother to offspring, tends to stay much the same over generations, making it a useful tool for tracing evolution through maternal ancestry. But as ancient DNA fragments with age, it always depends on how well the DNA of a particular specimen has been preserved.

The genetic comparisons here suggested that the horned crocodile represents a "sister lineage" to 'true' crocodiles, placing V. robustus right next to modern-day Crocodylus, such as Australia's saltwater crocodile, on the evolutionary tree.

It was only with modern DNA techniques and the right computational setup that the research team could "actually fish out this DNA from the fossil and finally find a home for this species," explained study author and geneticist George Amato from the American Museum of Natural History's Institute for Comparative Genomics.

So, you could say this is a long-awaited homecoming for V. robustus.

"This finding was surprising and also very informative to how we think about the origin of the true crocodiles found around the tropics today," Amato added.

"The placement of this individual suggests that true crocodiles originated in Africa, and from there, some went to Asia and some went to the Caribbean and the New World. We really needed the DNA to get the correct answer to this question."

The research was published in Communications Biology.