Wednesday, July 28, 2021


Fight for control threatens to destabilize and fragment the internet
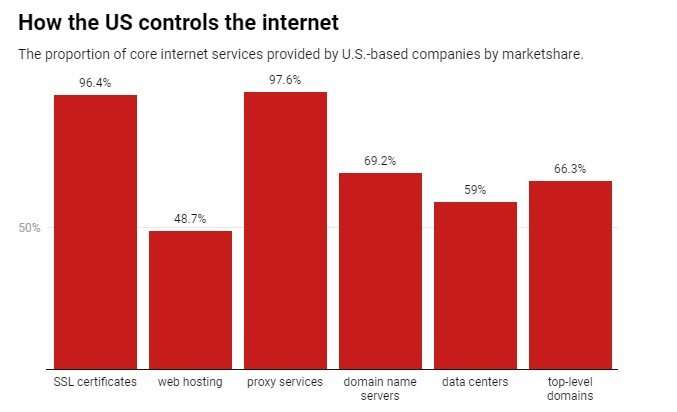
Fight for control threatens to destabilize and fragment the internet
Credit: Chart: The Conversation US, CC-BY-ND Source: Nick Merrill, the Internet Atlas Project

You try to use your credit card, but it doesn't work. In fact, no one's credit card works. You try to go to some news sites to find out why, but you can't access any of those, either. Neither can anyone else. Panic-buying ensues. People empty ATMs of cash.

This kind of catastrophic pan- meltdown is more likely than most people realize.

I direct the Internet Atlas Project at the University of California, Berkeley. Our goal is to shine a light on long-term risks to the internet. We produce indicators of weak points and bottlenecks that threaten the internet's stability.

For example, where are points of fragility in the global connectivity of cables? Physical cables under the sea deliver 95% of the internet's voice and data traffic. But some countries, like Tonga, connect to only one other country, making them vulnerable to cable-clipping attacks.

Another example is content delivery networks, which websites use to make their content readily available to large numbers of internet users. An outage at the content delivery network Fastly on June 8, 2021, briefly severed access to the websites of Amazon, CNN, PayPal, Reddit, Spotify, The New York Times and the U.K. government.

The biggest risks to the global internet

We take measurements at various layers of the internet's technological stack, from cables to content delivery networks. With those measurements, we identify weak points in the global internet. And from those , we build theories that help us understand what parts of the internet are at risk of disruption, whom those disruptions will affect and how severely, and predict what would make the internet more resilient.

Currently, the internet is facing twin dangers. On one side, there's the threat of total consolidation. Power over the internet has been increasingly concentrated primarily in the hands of a few, U.S.-based organizations. On the other side, there's fragmentation. Attempts to challenge the status quo, particularly by Russia and China, threaten to destabilize the internet globally.

While there's no single best path for the internet, our indicators can help policymakers, nongovernmental organizations, businesses, activists and others understand if their interventions are having their intended effect. For whom is the internet becoming more reliable, and for whom is is it becoming more unstable? These are the critical questions. About 3.4 billion people are just now getting online in countries including Fiji, Tonga and Vanuatu. What kind of internet will they inherit?

A US-controlled internet

Since at least 2015, the core services that power the internet have become increasingly centralized in the hands of U.S. corporations. We estimate that U.S. corporations, nonprofits and government agencies could block a cumulative 96% of content on the global internet in some capacity.

The U.S. Department of Justice has long used court orders aimed at tech providers to block global access to content that's illegal in the U.S., such as copyright infringements. But lately, the U.S. federal government has been leveraging its jurisdiction more aggressively. In June, the DOJ used a court order to briefly seize an Iranian news site because the department said it was spreading disinformation.

Due to interlocking dependencies on the web, such as content delivery networks, one misstep in applying this technique could take down a key piece of internet infrastructure, making a widespread outage more likely.

Meanwhile, U.S.-based technology companies also risk wreaking havoc. Consider Australia's recent spat with Facebook over paying news outlets for their content. At one point, Facebook blocked all news on its platform in Australia. One consequence was that many people in Fiji, Nauru, Papua New Guinea, Samoa, Tonga and Vanuatu temporarily lost a key news source because they rely on prepaid cellphone plans that feature discounted access to Facebook. As these skirmishes increase in frequency, countries worldwide are likely to suffer disruptions to their internet access.

A splinternet

Naturally, not everyone is happy with this U.S.-led internet. Russia throttles Twitter trafficChina blocks access to Google.

These domestic maneuvers certainly threaten localized meltdowns. India now regularly shuts down the internet regionally during civil unrest. But, in aggregate, they present a more global threat: internet frgamentation. A fragmented internet threatens speech, trade and global cooperation in science.

It also increases the risk of cyberattacks on core internet infrastructure. In a global internet, attacks on infrastructure hurt everyone, but walled-off national internets would change that calculus. For example, Russia has the capacity to disconnect itself from the rest of the world's internet while maintaining service domestically. With that capacity, it could attack core global internet infrastructure with less risk of upsetting its domestic population. A sophisticated attack against a U.S. company could trigger a large-scale internet outage.

The future of the internet

For much of its history, the internet has been imperfectly, but largely, open. Content could be accessed anywhere, across borders. Perhaps this openness is because, rather than in spite, of the U.S."s dominance over the internet.

Whether or not that theory holds, the U.S."s dominance over the internet is unlikely to persist. The status quo faces challenges from the U.S."s adversaries, its historical allies and its own domestic tech companies. Absent action, the world will be left with some mixture of unchecked U.S. power and ad-hoc, decentralized skirmishes.

In this environment, building a stable and transnational internet for future generations is a challenge. It requires delicacy and precision. That's where work like ours comes into play. To make the internet more stable globally, people need measurements to understand its chokepoints and vulnerabilities. Just as  watch measures of inflation and employment when they decide how to set rates, internet governance, too, should rely on indicators, however imperfect.

Global internet outage points to weakness of the cloud infrastructure, says expert
Provided by The Conversation 
This article is republished from The Conversation under a Creative Commons license. Read the original article.The Conversation

M-C-M

Google parent Alphabet profit soars as ads surge

Google parent Alphabet reported a sharp rise in profits amid growth in digital advertising
Google parent Alphabet reported a sharp rise in profits amid growth in digital
advertising.

Google parent Alphabet on Tuesday reported quarterly profit that had nearly tripled, as money poured in from ads on its search engine and YouTube video platform.

"There was a rising tide of online activity in many parts of the world, and we're proud that our services helped so many consumers and businesses," Alphabet chief executive Sundar Pichai said of the quarter.

The internet titan reported that profit nearly tripled from last year to $18.5 billion on revenue that rose sharply to $61.9 billion.

Google is among the tech companies that saw use soar as the pandemic accelerated a trend toward working, shopping, socializing and more online.

Alphabet shares that ended the formal trading day down slightly rose more than three percent after release of the earnings figures, which beat market expectations.

Pichai credited long-term investments in artificial intelligence and cloud computing as powering the internet giant's performance.

The strong quarter also reflected "elevated consumer online activity and broad-based strength in advertiser spend," as the global economy strives to recover from damage done by the pandemic, according to chief financial officer Ruth Porat.

Pichai opened an earnings call by urging people to get vaccinated against COVID-19.

Google is on track to generate $130 billion in overall ad revenue this year, an increase of some 25 percent from a year earlier, according to eMarketer.

That would give the California-based tech colossus 28.6 percent of the worldwide digital ad market, with Facebook in second place with just shy of 24 percent, the market tracker projected.

"YouTube was the fastest-growing segment during the quarter and points to the continued strength of video advertising for both direct response and brand goals," said eMarketer principal analyst Nicole Perrin.

Revenue at the global video sharing platform topped $7 billion, a leap from the $3.8 billion brought in during the same period a year earlier, according to Alphabet.

Meanwhile, daily views at the YouTube Shorts service that competes with sensation TikTok surged past 15 billion in the quarter, according to Pichai.

Bright cloud

Google's cloud computing business, which competes with powerhouses Amazon and Microsoft, is positioned to attract more business given its strengths in analyzing data for companies and defending against threats such as ransomware, Pichai said.

"Companies have really started thinking deeply about their vulnerabilities," he told financial analysts on an earnings call.

"It is definitely an area where we are seeing a lot of conversations, a lot of interest."

Demand is also growing for tools that enable employees to get jobs done remotely as companies explore "hybrid" approaches that combine working from home and the office.

"Google Workspace continues to show strong growth, particularly in the enterprise space, because we have designed the product to meet the challenges of hybrid work," Pichai said.

Google recently reopened its campuses to workers who want to return voluntarily to California offices abandoned early in the pandemic.

"I was excited to see so many people in person," Pichai said.

"We're giving employees more flexibility in how and where they work, and will continue to invest in our site in the US and elsewhere."

Pandemic lifestyle delivers earnings boon for Amazon, Google

© 2021 AFP


The growing carbon footprint of streaming media

video
Credit: CC0 Public Domain

When was the last time you watched a DVD? If you're like most people, your DVD collection has been gathering dust as you stream movies and TV from a variety of on-demand services. But have you ever considered the impact of streaming video on the environment?

School for the Contemporary Arts professor Laura Marks and engineering professor Stephen Makonin, with engineering student Alejandro Rodriguez-Silva and media scholar Radek Przedpełski, worked together for over a year to investigate the carbon footprint of streaming media supported by a grant from the Social Sciences and Humanities Research Council of Canada.

"Stephen and Alejandro were there to give us a reality check and to increase our engineering literacy, and Radek and I brought the critical reading to it," says Marks. "It was really a beautiful meeting of critical media studies and engineering."

After combing through studies on Information and Communication Technologies (ICT) and making their own calculations, they confirmed that streaming media (including video on demand, YouTube, video embedded in social media and websites, video conferences, video calls and games) is responsible for more than one per cent of greenhouse gas emissions worldwide. And this number is only projected to rise as video conferencing and streaming proliferate.

"One per cent doesn't sound like a lot, but it's significant if you think that the airline industry is estimated to be 1.9 per cent," says Marks. "ICT's carbon footprint is growing fast, and I'm concerned that because we're all turning our energy to other obvious carbon polluters, like fossil fuels, cars, the airline industry, people are not going to pay attention to this silent, invisible carbon polluter."

One thing that Marks found surprising during their research is how politicized this topic is.

Their full report includes a section detailing the International Energy Association's attack on French think tank The Shift Project after they published a report on streaming media's carbon footprint in 2019. They found that some ICT engineers state that the carbon footprint of streaming is not a concern because data centers and networks are very efficient, while others say the fast-rising footprint is a serious problem that needs to be addressed. Their report includes comparisons of the divergent figures in engineering studies in order to get a better understanding of the scope of this problem.

The top thing Marks and Makonin recommend to reduce streaming's carbon footprint is to ensure that our electricity comes from renewable sources. At an individual level, they offer a list of recommendations to reduce energy consumption and demand for new ICT infrastructure including: stream less, watch physical media including DVDs, decrease  resolution, use audio-only mode when possible, and keep your devices longer—since production of devices is very carbon-intensive.    

Promoting small files and low resolution, Marks founded the Small File Media Festival, which will present its second annual program of 5-megabyte films Aug. 10 - 20. As the organizers say, movies don't have to be big to be binge-worthy.

German study highlights carbon footprint of video streaming

More information: Full report: www.sfu.ca/content/dam/sfu/sca … rbon-Footprint/SSHRC%20KSG%20final%20report.pdf

Small Media Film Festival: smallfile.ca/


Possible future for Western wildfires: Decade-long burst, followed by gradual decline

Possible future for Western wildfires: Decade-long burst, followed by gradual decline
The model used in the study simulates past and future wildfires in California’s
 drought-prone Sierra Nevada region, using the actual landscape of the Big Creek
 watershed outside Fresno, California. The model simulates soil moisture, plant growth 
and wildfires for past conditions and in 60-year projections of future climate, with the dial 
at the upper left showing rising temperatures. Results show a decade-long burst of 
severe wildfires, followed by recurring wildfires that gradually get smaller. Credit: Ethan Turpin & David Gordon/UC Santa Barbara

In recent years, wildfires on the West Coast have become larger and more damaging. A combination of almost a century of fire suppression and hotter and drier conditions has created a tinderbox ready to ignite, destroying homes and polluting the air over large areas.

New research led by the University of Washington and the University of California, Santa Barbara, looks at the longer-term future of wildfires under scenarios of increased temperature and drought, using a model that focuses on the eastern California forests of the Sierra Nevada. The study, published July 26 in the journal Ecosphere, finds that there will be an initial roughly decade-long burst of  activity, followed by recurring fires of decreasing area.

"That first burst of wildfire is consistent with what we're seeing right now in the West. The buildup of fuels, in conjunction with the increasingly hot and dry conditions, leads to these very large, catastrophic fire events," said lead author Maureen Kennedy, assistant professor at the University of Washington Tacoma. "But our simulations show that if you allow fire to continue in an area, then the fire could become self-limiting, where each subsequent fire is smaller than the previous one."

How climate change,  and wildfires will interact over coming decades is only beginning to be explored, Kennedy said, through experiments and simulations. Existing models of vegetation often assume wildfires will strike at set intervals, like every 10 years, or based on past patterns of wildfire risk for that ecosystem. But those previous patterns may not be the best guide to the future.

"The big question is: What's going to happen with climate change? The relationships that we've seen between climate and wildfire over the past 30 years, is that going to continue? Or is there going to be a feedback? Because if we keep burning up these fuels, and with extreme drought that limits new growth, there will eventually be less fuel for wildfires," Kennedy said.

The new study used a model that includes those feedbacks among climate, vegetation growth, water flows and wildfire risk to simulate the Big Creek watershed outside Fresno, California, near the site of the September 2020 Creek Fire. Climate models suggest that here, as in other parts of the West, conditions will likely continue to get hotter and drier.

Results of the 60-year simulations show that under increased drought and rising temperatures, the large wildfires will continue for about a decade, followed by recurring wildfires that occur in warm and dry conditions, but are smaller over time. Even without wildfire the trees in the forest declined in number and size over time because they were less productive and more stressed in the hot and dry conditions. These findings would likely apply to other forests that experience drought, said Kennedy, who's now using the model on other regions.

What happens with wildfires over the longer term matters now for planning. Current understanding is that communities will have to coexist with wildfire rather than exclude it entirely, Kennedy said. A combination of prescribed burns and forest thinning will likely be the future of managing forests as they contend with both wildfires and climate change.

"With such high density in the forest, the trees are pulling a lot of water out of the soil," Kennedy said. "There is growing evidence that you can relieve drought stress and make more drought-resilient forests if you thin the forests, which should also help with, for example, reducing the impact of that initial pulse of wildfire."

After thinning out smaller trees, managers could then do controlled burns to remove kindling and smaller material on the forest floor. But knowing how to manage forests in this way requires understanding how local weather conditions, plant growth and wildfire risk will play out in future decades.

"It's important to include climate change so we have an idea of the range of variability of potential outcomes in the future," Kennedy said. "For example, how often do you need to repeat the fuels treatment? Is that going to be different under climate change?"

Kennedy was also a co-author of another recent study that uses the same model to tease apart how much  and fire suppression increase wildfire risk in different parts of Idaho.

"Our 'new normal' is not static," said Christina (Naomi) Tague, a professor at UC Santa Barbara who is a co-author on both studies and developed the RHESSys-FIRE model that was used in the research. "Not only is our  continuing to change, but vegetation—the fuel of fire—is responding to changing conditions. Our work helps understand what these trajectories of fire,  productivity and growth may look like

Climate change is fueling record-high heat, drought, wildfires in Western U.S.

More information: Maureen C. Kennedy et al, Does hot and dry equal more wildfire? Contrasting short‐ and long‐term climate effects on fire in the Sierra Nevada, CA, Ecosphere (2021). DOI: 10.1002/ecs2.3657
Journal information: Ecosphere 
Provided by University of Washington 


Wildfire smoke in New England is 'pretty severe from public health perspective'

Wildfire smoke in New England is 'pretty severe from public health perspective'
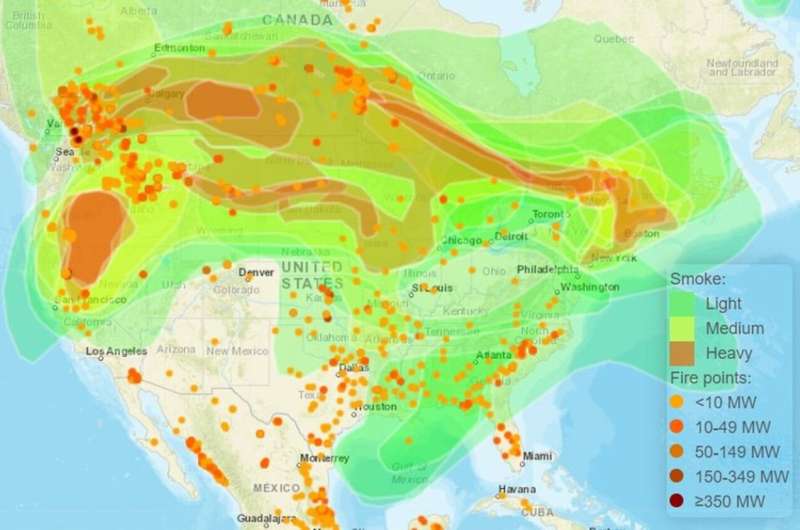
An interactive map from the National Oceanic and Atmospheric Administration (NOAA) 
shows the smoke from the wildfires in the Western US and Canada being carried across 
the country. Credit: NOAA

On Monday, the air quality in Boston and the greater New England area was so bad that it was only rivaled by the areas in Northern California and Oregon currently on fire. An interactive map from the National Oceanic and Atmospheric Administration showed how smoke from the wildfires out west were being carried across the continental US by winds and the jet stream. In response to the blanket of smoke engulfing the commonwealth's skies, the Massachusetts Department of Environmental Protection issued an air quality alert.

Around Boston, people reported not only seeing a film of smoke in the skies, but also smelling the scent of wood burning. Firefighters across the state fielded calls from concerned residents who worried that a fire was burning nearby. This is the second time in the last two weeks that smoke from the western forest fires has been carried to New England—but the smoke was markedly thicker and more pungent this time around.

With scientists predicting that our climate will continue to get hotter and drier, exacerbating normal patterns of forest fires, The Brink reached out to Boston University environmental earth scientist Mark Friedl for help understanding what these changes mean for our planet and for human health. Friedl, an expert in using NASA satellite imaging to interpret large-scale environmental trends, recently published new research findings indicating that forest fires in Earth's northernmost forests could accelerate climate change—potentially locking the planet in a feedback loop where drier climate causes more fires and those fires, in turn, speed up global warming. "Fires are intensifying, and when forests burn,  is released into the atmosphere," Friedl says about those findings.

Friedl, a BU College of Arts & Sciences professor of earth and environment and interim director of BU's Center for Remote Sensing, answers four questions posed by The Brink about the effects of western wildfire smoke over New England and the US.

The Brink: Based on your research and expertise in remote global sensing and monitoring, what do these current wildfires tell us about where Earth's climate is going?

Friedl: These fires are further evidence of how climate change is impacting ecosystems and forests. Fire is normal in forested ecosystems, especially in western forests that tend to be drier, and hence more -prone, relative to forests in the eastern US. That said, the increased frequency, intensity, and scale of fires we've seen in recent years is a clear by-product of climate change. They are the proverbial canary in the coal mine, telling us that the climate is changing, and it's going to increasingly impact our lives on a day-to-day basis.

Does this much smoke, spreading across the country, impact vegetation elsewhere besides the forests that are burning?

Smoke like we experienced today tends to be pretty short-lived and doesn't have much impact on vegetation across the country. Indeed, it's not entirely unheard of for smoke to travel long distances in the atmosphere, and it's not unprecedented for smoke from fires in the western US to make it all the way to the eastern US.

What about the effects on human health?

Most of the time, the smoke is diffuse and concentrated in the upper atmosphere, and so we just experience it as haze. What we experienced [Monday], with very poor , is qualitatively different, and is pretty severe from a public health perspective. Hopefully, this is not a harbinger of things to come. It's also worth noting that at least some of the smoke we see right now is coming from fires in western and central Canada, and not just from the western US.

With wildfires becoming more common as the climate gets hotter and drier, what will happen if fires burn faster than forests can replenish themselves? Can you predict what the future dynamics look like in the West and Pacific Northwest forests?

If the climate continues to warm and becomes drier in the west, at some point some forests will not be able to recover. If there's a silver lining in these fires, it's that hopefully they provide a wake-up call for society to change and start to meaningfully address the  crisis.


Explore further

Fire tornadoes explained

Provided by Boston University 


New study reveals key factors for estimating costs to plug abandoned oil and gas wells

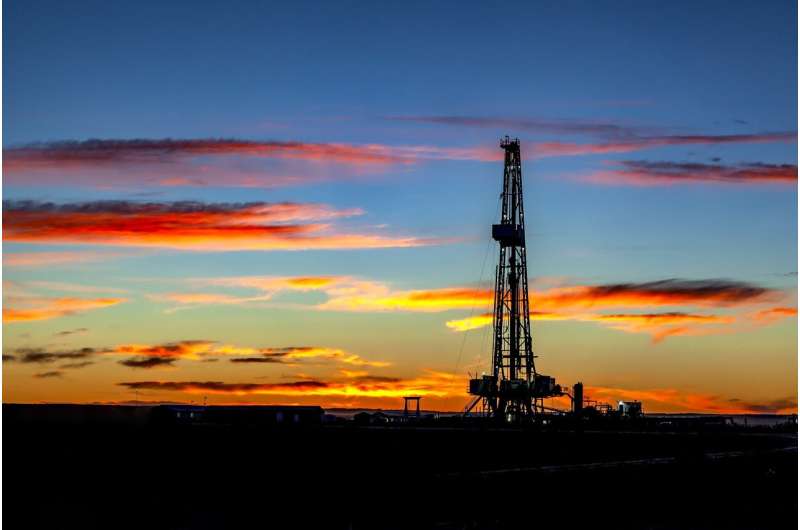
gas well
Credit: Pixabay/CC0 Public Domain

In an analysis of over 19,500 orphaned oil and gas wells across the United States, scholars at Resources for the Future (RFF) find that the median cost of plugging and reclaiming a well is $76,000, although that figure can vary widely depending on the age, location, well depth, and other key factors.

The paper was published earlier this month in the peer-reviewed journal Environmental Science & Technology. To the research team's knowledge, the orphaned oil and  analyzed represent the largest data set assembled on decommissioning .

Oil and gas wells can become "orphaned" when an operator goes bankrupt and does not set aside funds to cover decommissioning costs. Although regulators require companies to purchase bonds to ensure that a well can be plugged even if the company faces bankruptcy, these bonds are often too low to cover the full costs. As a result, hundreds of thousands—and perhaps more than one million—orphaned wells across the country lie idle and unplugged, often contaminating water, reducing , and emitting  like methane. The challenge of addressing orphaned and abandoned oil and gas wells is likely to grow in the years to come: The Environmental Protection Agency estimates that there are more than two million wells in the United States that are not in use but have not been plugged. These wells run the risk of becoming orphaned in the future, particularly if policies dramatically reduce demand for oil and gas.

"The findings in this paper can help regulators adjust bonding requirements or other regulatory tools to match the characteristics of different wells, rather than using a one-size-fits-all approach," lead author and RFF Fellow Daniel Raimi said. "Considerable cost variation can be a major problem for decisionmakers—our analysis of a variety of factors that affect decommissioning costs will hopefully lend nuance to this important topic."

In their analysis of the 19,500 wells, the researchers found that:

  • The median cost of plugging a well without restoring the surface is about $20,000.
  • Plugging and reclaiming the surface around the well—which may be done for aesthetic, environmental, or job creation reasons—increases the median cost to $76,000.
  • Each additional 1,000 feet of well depth increases costs by 20 percent.
  • Costs of plugging wells goes up with the age of the well itself—compared with wells that were more than 60 years old when decommissioned, wells aged 40 to 60 years old were 9 percent less expensive, and wells aged from 0 to 40 were roughly 20 percent less expensive to plug.
  • Natural gas wells are 9 percent more expensive than oil wells to plug.
  • Upon further analysis of almost 4,000 contracts, it appears that contracting plugging efforts in bulk pays off—each additional well per contract reduces decommissioning costs by 3 percent per well.

The paper focuses on orphaned oil and gas wells in Kansas, Montana, New Mexico, Pennsylvania, and Texas. These states were chosen because they differ in terms of geology, history, and regulatory structure, which helps ensure that the data is representative of more than just one region. Notably, there are significant differences in decommissioning costs across states.

"We need good data on orphaned oil and gas wells to accurately assess costs and enact effective policies," Raimi said. "As the United States embarks on an energy transition, taking care of these issues will only become more important. And to do that, we need a solid foundation of research."

Plugging orphaned and abandoned oil and gas wells can create jobs, reduce pollution

More information: Daniel Raimi et al, Decommissioning Orphaned and Abandoned Oil and Gas Wells: New Estimates and Cost Drivers, Environmental Science & Technology (2021). DOI: 10.1021/acs.est.1c02234
Journal information: Environmental Science & Technology 
Provided by Resources for the Future


Chile's ancient mummies added to UN heritage list

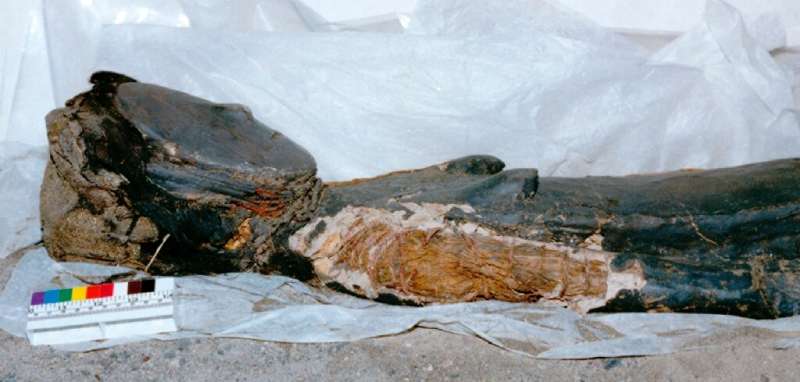
Chinchorro mummies were either painted red, black or wrapped in bandages
Chinchorro mummies were either painted red, black or wrapped in bandages.

Chile's Chinchorro mummies, the oldest in the world to have been purposefully preserved by humans, were added to UNESCO's World Heritage List on Tuesday.

The mummies, which were found in the north of Chile at the start of the 20th century, are more than 7,000 years old, meaning they pre-date the Egyptian mummies by two millennia.

The United Nations' cultural organization announced on Twitter that it had added the "settlement and artificial mummification of the Chinchorro culture" to its prestigious list during a virtual meeting chaired by China.

"UNESCO is validating on an international level, through different experts, that the settlements and artificial mummification of the Chinchorro culture has exceptional value, that it has a global importance," Chilean anthropologist Bernardo Arriaza told AFP.

The Chinchorro were fishers and  more than 7,000 years ago in an area where the desert and Pacific Ocean meet in what is today the south of Peru and north of Chile.

So far, more than 300 mummies have been found, including red, black and bandaged ones.

The mummification process consisted of removing the organs, intestines and tissue.

The skin was then ripped off the corpse and the body rebuilt using sticks and animal hair, while a thick head of black hair was sewn onto the scalp.

Finally the mummies were painted red or black using earth, pigments, manganese and .

"These bodies are very finely made by specialists. There's a subtlety, a creativity by these first populations," added Arriaza, who is the director of the Chinchorro Center at the Tarapaca University in the city of Arica.

Why the Chichorro culture mummified their dead remains a mystery.

In 2005, Arriaza developed a theory that it could have been linked to high levels of arsenic poisoning in the water that could have produced premature births, miscarriages, underweight children and high infant mortality.

He suggested the  was "an  from parents faced with these painful losses, so they painted them, dressed them up and every day this technique became more elaborate."

Scans unveil secrets of world's oldest mummies

© 2021 AFP


Improving soil health starts with farmer-researcher collaboration

farmer
Credit: CC0 Public Domain

Ask a farmer, a scientist, and a conservation professional to define soil health, and you might come up with three rather different answers. That mismatch may be at the root of lower-than-ideal adoption of soil conservation practices, according to a new study from the University of Illinois and The Ohio State University.

"We all use the term ' health,' but upon further discussion, it's often clear different groups don't really have the same working definition or interpretation of the term. When we keep talking past one another, assuming we know what the other person means, that's a potential barrier to greater adoption of good soil management practices," says Jordon Wade, postdoctoral researcher in the Department of Crop Sciences at U of I, and lead author on the study. Wade conducted the research as a doctoral student at OSU.

Importantly, the study also finds farmers care far more about soil health than scientists and conservation professionals think.

"Many academics think farmers don't value soil health, but our results clearly show it's a major priority for them. We end up spending so much time trying to convince farmers that soil health is important, but they're already there," Wade says. "We need to move on and start recognizing farmers as our colleagues and our equals in what we're trying to achieve."

Wade and his colleagues sent paper and digital surveys to hundreds of Midwestern farmers, Natural Resource Conservation Service (NRCS) employees, and agricultural researchers, evaluating their conceptualizations and prioritization of soil health and common soil tests. The researchers employed a mental models approach, a type of survey method that tests assumptions about causal relationships among various concepts or factors.

In addition to finding farmers prioritized soil health at a higher level (8.5 out of 10) than academics and NRCS professionals expected (4.9 and 5.7, respectively), the survey revealed surprising agreement about how the groups conceptualized soil health.

"Famers, NRCS personnel, and agricultural researchers all agreed that soil health positively affected crop productivity and farm profitability," says Margaret Beetstra, co-author on the study and John A. Knauss Marine Policy Fellow at the National Oceanic and Atmospheric Administration. "And all groups reported bidirectional linkages, or feedback loops, between soil health and soil fertility, biological functioning, and soil physical functioning. This was an unexpectedly high degree of agreement across groups, which broadly refuted our hypothesis that farmers and academics conceptualize soil health differently."

The researchers noted slight differences in soil health conceptualization within groups, however, meaning there isn't necessarily one right way for groups to communicate about the topic.

"If I, as a researcher, am talking about improving soil health, I might be thinking about how this could reduce inputs, but an NRCS conservationist might not be," Wade says. "This means that our takeaways from a conversation about soil health could be quite different."

When asked about how they used and valued various soil tests, farmers and academics tended to be more similar than NRCS professionals, who, according to the survey, rely more heavily on in-field measurements (e.g., "by feel" or how the ground works up with a tractor) than standard agronomic soil tests (e.g., pH, organic matter, extractable nutrients). All groups said they value soil health tests that incorporate measurements of soil microbial activity, but the survey revealed farmers just aren't using them.

"Our finding that farmers find soil health tests valuable, but often don't use them suggests some kind of barrier exists, such as availability or cost of these tests," Wade says.

The study suggests communication and research strategies around soil health could focus less on whether or not soil health is important and more on the perceived benefits and how to measure them. "With more stakeholders pushing in a similar direction, the hope is that we keep improving soil health across the Midwest," Wade says.

Andrew Margenot, study co-author and Wade's current faculty advisor at U of I, works closely with Illinois farmers on soil health and fertility issues. He says, "Many farmers in Illinois with whom we worked have noted potential links between soil health and water quality for a given practice, and also, importantly, how some practices may yield benefits on soil health but not necessarily water quality. Given the Illinois Nutrient Loss Reduction Strategy goals of decreased nutrient export to surface waters, this study reinforces that we researchers should be more explicit in articulating—and working with farmers to quantify –how practices that improve  may also bolster ."

The article, "Soil health conceptualization differs across key stakeholder groups in the Midwest," is published in the Journal of Soil and Water Conservation.

Soil health is as environmentally important as air and water quality, say microbiologists

More information: J. Wade et al, Soil health conceptualization differs across key stakeholder groups in the Midwest, Journal of Soil and Water Conservation (2021). DOI: 10.2489/jswc.2021.02158

 AMERICA

Research illuminates how energy costs vary nationwide

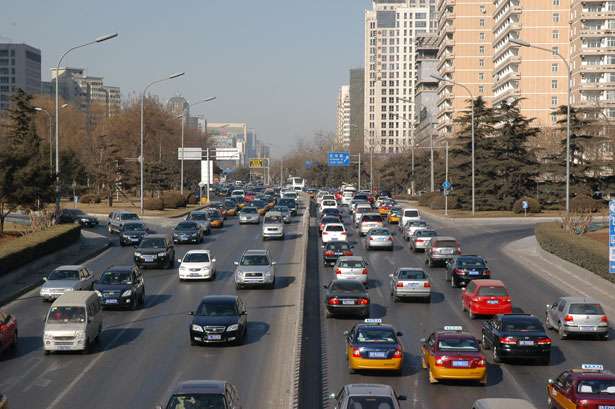
traffic
Credit: Scott Meltzer/public domain

Costs for energy are borne unequally across the U.S. population. Argonne research is providing key data that can help inform decisions about which technologies can reduce disparities.

Every U.S. household has at least one or two regular bills for energy, such as the monthly electric bill or spending for gasoline. But energy  hit some Americans harder than others. One measure of the difference is energy burden, which is the share of total income spent on energy.

A recent study from the U.S. Department of Energy's (DOE) Argonne National Laboratory illuminates another type of energy burden: Transportation costs, a complex but important factor in most Americans' household budgets. On average each year, U.S. households spend as much—and in some regions, more—at the gas pump as they do for household electricity and gas bills combined.

The impact of those  expenses on a household has less to do with the total bill and more to do with the share of total income.

"A rich household spending the average value of $2,000 per year on  fuel is much less burdened by this cost than a lower-income household spending the same amount," said Yan (Joann) Zhou, an Argonne researcher who co-authored the report with colleagues Spencer Aeschliman and David Gohlke. Their work has been supported by DOE's Office of Energy Efficiency and Renewable Energy.

In households with a high energy burden, fuel costs might amount to much less than that, but the total might represent a bigger share of income. Data from the U.S. Bureau of Labor Statistics compiled by Oak Ridge National Laboratory shows that on average, fuel costs amount to 3.3% of total income. Argonne's study found this share can reach as high as 23.3% for some communities.

Why so much variation in fuel costs? Fuel prices, along with how much people are driving, play a role. But the biggest contributing factor to a household's , according to the Argonne analysis, is vehicle fuel economy. Any driver's gasoline bills depend significantly on how far they can get with that fuel—and wealthier households were found to enjoy better fuel economy in their cars. Improving fuel efficiency nationwide by just 3% from 2016 to 2018 would save drivers $8.2 billion in transportation energy costs, the researchers concluded.

Mapping costs for U.S. drivers

The Argonne study offers an exceptionally detailed and rigorous view of Americans' fuel spending as it relates to income, quantifying the energy burden for over 74,000 Census tracts, which are areas geographically defined by the Census Bureau.

The key research question of such an analysis, Zhou said, is estimating annual miles traveled. The researchers used machine-learning techniques, training a computer model to estimate annual vehicle miles traveled across Census tracts. The model combined existing self-reported data from the 2017 National Household Travel Survey with average household income, number of workers, and number of vehicles in each tract to predict average annual vehicle miles traveled for households in different locations.

The researchers combined these miles-traveled estimates with high-fidelity regional data on fuel prices, average on-road  economy based on vehicle registrations and household income to identify the areas with the highest energy burden for transportation fuel.

"Our findings for affordability apply to households nationwide," said Gohlke. "We find high transportation energy burden in rural communities with long commutes using less efficient vehicles. We also see it in urban communities with high fuel prices and low incomes." The three states with the highest burden were South Dakota, Mississippi and California, he added. On the other end of the spectrum, Washington, D.C., and the state of New York have the lowest average burden, with higher shares of efficient vehicles and lower-than-average driving distances.

The study provides an important baseline to evaluate transportation energy burden going forward. Future research, Zhou added, could use the analysis framework to evaluate the impact of different strategies for promoting clean vehicle adoption on household  burden. It could also look at  beyond fuel, such as vehicle purchase price and maintenance costs.

"In order to evaluate a transportation technology's impact on household costs tomorrow, we need to understand what's happening today," Zhou said. "This study provides a jumping-off point to explore the impact of changes in vehicle technology and identify who is most affected."

Re-think on energy charging could reduce bills for 70% of households

More information: Yan Zhou et al, Affordability of Household Transportation Fuel Costs by Region and Socioeconomic Factors, (2021). DOI: 10.2172/1760477