Census data: US is diversifying, white population shrinking
WHAT ROSS, SESSIONS & TRUMP FEARED
By MIKE SCHNEIDER

1 of 22
FILE - Rows of homes, are shown in suburban Salt Lake City, on April 13, 2019. The U.S. Census Bureau's release Thursday, Aug. 12, 2021, of detailed population and demographic changes in each state will kick off the once-a-decade redistricting process that plays a large role in determining which party controls state legislatures and the U.S. House. (AP Photo/Rick Bowmer, File)
No racial or ethnic group dominates for those under age 18, and white people declined in numbers for the first time on record in the overall U.S. population as the Hispanic and Asian populations boomed this past decade, according to the 2020 census data.
The figures released Thursday by the U.S. Census Bureau offered the most detailed portrait yet of how the country has changed since 2010 and will also be instrumental in redrawing the nation’s political maps.
The numbers are sure to set off an intense partisan battle over representation at a time of deep national division and fights over voting rights. The numbers could help determine control of the House in the 2022 elections and provide an electoral edge for years to come.
The data also will shape how $1.5 trillion in annual federal spending is distributed.
The data offered a mirror not only into the demographic changes of the past decade, but also a glimpse of the future. To that end, they showed there is now no majority racial or ethnic group for people younger than 18, as the share of non-Hispanic whites in the age group dropped from 53.5% to 47.3% over the decade.
The share of children in the U.S. declined because of falling birth rates, while the share of adults grew, driven by aging baby boomers. Adults over 18 made up more than three-quarters of the population in 2020, or 258.3 million people, an increase of more than 10% from 2010. However, the population of children under age 18 dropped from 74.2 million in 2010 to 73.1 million in 2020.
“If not for Hispanics, Asians, people of two or more races, those are the only groups underage that are growing,” said William Frey, a senior fellow at Brookings’ Metropolitan Policy Program. “A lot of these young minorities are important for our future growth, not only for the child population but for our future labor force.”
The Asian and Hispanic populations burgeoned from 2010 to 2020, respectively increasing by around a third and almost a quarter over the decade. The Asian population reached 24 million people in 2020, and the Hispanic population hit 62.1 million people.
The Hispanic boom accounted for almost half of the overall U.S. population growth, which was the slowest since the Great Depression. By comparison, the non-Hispanic growth rate over the decade was 4.3%. The Hispanic share of the U.S. population grew to 18.7% of the U.S. population, up from 16.3% in 2010.
“The 2020 Census confirmed what we have known for years — the future of the country is Latino,” said Arturo Vargas, CEO of the National Association of Latino Elected and Appointed Officials Educational Fund.
The share of the white population fell from 63.7% in 2010 to 57.8% in 2020, the lowest on record, driven by falling birthrates among white women compared with Hispanic and Asian women. The number of non-Hispanic white people shrank from 196 million in 2010 to 191 million.
White people continue to be the most prevalent racial or ethnic group, though that changed in California, where Hispanics became the largest racial or ethnic group, growing from 37.6% to 39.4% over the decade, while the share of white people dropped from 40.1% to 34.7%. California, the nation’s most populous state, joined Hawaii, New Mexico and the District of Columbia as a place where non-Hispanic white people are no longer the dominant group.
“The U.S. population is much more multiracial and much more racially and ethnically diverse than what we have measured in the past,” said Nicholas Jones, a Census Bureau official.
Some demographers cautioned that the white population was not shrinking as much as shifting to multiracial identities. The number of people who identified as belonging to two or more races more than tripled from 9 million people in 2010 to 33.8 million in 2020. They now account for 10% of the U.S. population.
People who identify as a race other than white, Black, Asian, American Indian, Native Hawaiian or Pacific Islander — either alone or in combination with one of those races — jumped to 49.9 million people, surpassing the Black population of 46.9 million people as the nation’s second-largest racial group, according to the Census Bureau.
But demographers said that may have to do with Hispanic uncertainty about how to answer the race question on the census form, as well as changes the Census Bureau made in processing responses and how it asked about race and ethnicity in order to better reflect the nation’s diversity.
The data release offers states the first chance to redraw their political districts in a process that is expected to be particularly brutish since control over Congress and statehouses is at stake.
It also provides the first opportunity to see, on a limited basis, how well the Census Bureau fulfilled its goal of counting every U.S. resident during what many consider the most difficult once-a-decade census in recent memory. Communities of color have been undercounted in past censuses. The agency likely will not know how good a job it did until next year, when it releases a survey showing undercounts and overcounts.
“The data we are releasing today meet our high quality data standards,” acting Census Bureau Director Ron Jarmin said.
EXPLAINER: 5 takeaways from the release of 2020 census data
By MIKE SCHNEIDER
The Census Bureau on Thursday issued its long-awaited portrait of how the U.S. has changed over the past decade, releasing a trove of demographic data that will be used to redraw political maps across an increasingly diverse country. The data will also shape how $1.5 trillion in federal spending is distributed each year.
Here are five takeaways from the latest census figures:
___
WHITE POPULATION DECLINED FOR FIRST TIME ON RECORD
A U.S. headcount has been carried out every decade since 1790, and this was the first one in which the non-Hispanic white population nationwide got smaller, shrinking from 196 million in 2010 to 191 million in 2020.
The data also showed that the share of the white population fell from 63.7% in 2010 to 57.8% in 2020, the lowest on record, though white people continue to be the most prevalent racial or ethnic group. In California, Hispanics became the largest racial or ethnic group, growing from 37.6% to 39.4%, while the share of white people dropped from 40.1% to 34.7%.
Some demographers cautioned that the white population was not shrinking as much as shifting to multiracial identities. The number of people who identified as belonging to two or more races more than tripled from 9 million people in 2010 to 33.8 million in 2020. They now account for 10% of the U.S. population.
People who identify as a race other than white, Black, Asian, American Indian, Native Hawaiian or Pacific Islander — either alone or in combination with one of those races — jumped to 49.9 million people, surpassing the Black population of 46.9 million people as the nation’s second-largest racial group, according to the Census Bureau.
But demographers said that may have to do with Hispanic uncertainty about how to answer the race question on the census form.
___
THE U.S. BECAME MORE URBAN
Almost all of the growth of the past 10 years happened in metropolitan areas. More people in smaller counties moved to larger counties. Around 80% of metropolitan areas saw population gains, while less than half of the smaller so-called micropolitan areas did.
Phoenix was the fastest-growing of the nation’s top 10 cities. It moved from sixth to fifth, trading places with Philadelphia, which is now the nation’s sixth-largest city.
___
DECLINE IN CHILDREN; ADULTS TAKE LARGER SHARE
The share of children in the U.S. declined because of falling birth rates, while it grew for adults, driven by aging baby boomers. Adults over age 18 made up more than three-quarters of the population in 2020, or 258.3 million people, an increase of more than 10% from 2010. However, the population of children under age 18 dropped from 74.2 million in 2010 to 73.1 million in 2020, a 1.4% decrease. Nationwide, children under age 18 now make up around 22% of the population, but it varies by region. The Northeast had the smallest proportion of people under age 18, around 20%, while the South had the largest at 22.5%.
___
SKYROCKETING HISPANIC AND ASIAN GROWTH
The nation’s 7.4% percent growth rate over the decade, the smallest since the Great Depression, largely was propelled by a Hispanic boom. The Hispanic population grew by almost a quarter over the decade. By comparison, the non-Hispanic growth rate was 4.3%. Hispanics stood at 62.1 million residents in 2020, or 18.7% of the U.S. population, up from 16.3% in 2010. The most Hispanic growth was in Florida, Texas, New York, Illinois and California.
Meanwhile, Asian growth jumped more than a third over the decade, rising to 24 million people in 2020.
___
RAPID GROWTH IN UNEXPECTED PLACES, LOSSES IN PUERTO RICO AND WEST VIRGINIA
Among all U.S. metro areas, the fastest-growing one was in The Villages, the Florida retirement community built on former cow pastures. Other fast-growing areas in the U.S. were fueled by the energy boom, particularly in North Dakota, where McKenzie County was the country’s fastest-growing county. Its population increased by 131% from 2010 to 2020. Nearby Williams County, North Dakota, grew by 83%.
___
Associated Press Writer Astrid Galvan in Phoenix contributed to this report.
___
Follow Mike Schneider on Twitter at https://twitter.com/MikeSchneiderAP
By DAVID A. LIEB and ACACIA CORONADO

1 of 6
Workers erect the frame of a home being built in a new subdivision in Allen, Texas, Thursday, Aug. 12, 2021. The once-a-decade battle over redistricting is set to be a showdown over the suburbs, as new census data released Thursday showed rapid growth around the some of the nation's largest cities and shrinking population in many rural counties. (AP Photo/Tony Gutierrez)
The once-a-decade battle over redistricting is set to be a showdown over the suburbs, as new census data released Thursday showed rapid growth around the some of the nation’s largest cities and shrinking population in many rural counties.
From Texas to Florida, some of the biggest gains came in states where Republicans will control the redistricting process, but often in and around cities where Democrats have been faring well in recent elections.
The new detailed population data from the 2020 Census will serve as the building block to redraw 429 U.S. House districts in 44 states and 7,383 state legislative districts across the U.S. The official goal is to ensure each district has roughly the same number of people.
But many Republicans and Democrats also will be trying to ensure the new lines divide and combine voters in ways that make it more likely for their party’s candidates to win future elections, a process called gerrymandering. The parties’ successes in that effort could determine whether taxes and spending grow, climate-change polices are approved or access to abortion is expanded or curtailed.
Republicans need to gain just five seats to take control of the U.S. House in the 2022 elections — a margin that could potentially be covered through artful redistricting. As they did after the 2010 census, Republicans will hold greater sway in more states over the redistricting process.
“The question is going to be how creative this new data will force Republicans to get in maintaining or expanding their advantages, given an increasingly diverse, increasingly urban population,” said Joshua Blank, research director of the Texas Politics Project at the University of Texas.
Texas will be a major focal point in redistricting.
The Census Bureau said five of the 14 U.S. cities that grew by at least 100,000 people are located in Texas — Austin, Dallas, Fort Worth, Houston and San Antonio. Four of the nation’s 10 fastest growing cities also were Texas suburbs — Frisco and McKinney near Dallas; Conroe near Houston, and New Braunfels near San Antonio. All are prime battle grounds for redistricting.
By contrast, many Texas counties outside of its metropolitan areas saw populations decline, the Census Bureau said.
Republicans, who currently hold 23 of the 36 U.S. House seats in Texas, will have full control over the redistricting process, allowing them to decide where to draw the two new seats the state is gaining. But that could be complicated because Democrats generally have fared better in Texas suburbs in recent elections.
Though Republican Donald Trump carried Texas by more than 6 percentage points in the 2020 presidential election, he and Democrat Joe Biden essentially split voters who identified as suburbanites, according to The Associated Press’ VoteCast. Trump won decisively among men and Biden had a wide advantage among women in the Texas suburbs.
Hispanic residents accounted for half the population growth in Texas. In the last election, about 6 in 10 Texas Hispanic voters chose Biden over Trump, according to VoteCast.
“As the process of redistricting begins, the Legislature should be guided by the principle of fair representation for every Texan,” said state Rep. Rafael Anchia, a Democratic member of the House redistricting committee and chair of the Mexican American Legislative Caucus.
Texas had been among several states that needed advance approval from the U.S. Justice Department for its redistricting plans because of a history of racial discrimination. But the U.S. Supreme Court overturned that requirement in 2013 and, in a separate ruling in 2019, said it would not get involved in disputes over alleged political gerrymandering, leaving that to state courts to decide. Lawsuits are expected to challenge redistricting maps in many states.
The GOP will control redistricting in 20 states accounting for 187 U.S. House seats, including the growing states of Texas, Florida, Georgia and North Carolina, where the governor is a Democrat, but the legislature has complete control of drawing new electoral lines.
Courts ordered multiple changes to the pro-Republican maps drawn in North Carolina after the 2010 census. Lawmakers on Thursday voted not to use election or racial data in redistricting. State Rep. Destin Hall, a Republican leading the House Redistricting Committee, said he is committed to making “significant and reasonable efforts to attempt to limit the partisan consideration.”
Democrats will control redistricting in just eight states accounting for 75 seats, including New York and Illinois, where the loss of a seat in each gives them a chance to squeeze out Republican incumbents.
In 16 other states accounting for 167 U.S. House seats, districts will be drawn either by independent commissions or by politically split politicians with legislative chambers led by one party and governors of another. Six states have just one U.S. House seat, so there are no district lines to be drawn.
Outside of Texas, some of the largest growth occurred in Arizona’s chief city of Phoenix, including a nearly 80% population increase in its suburb of Buckeye. But Arizona’s voting districts are drawn by an independent commission, making it more difficult for Republican or Democratic officials to gain an edge in redistricting.
Census data also showed large growth in Seattle and Los Angeles and some of their suburbs. Other cities gaining at least 100,000 people included Charlotte, North Carolina; Columbus, Ohio; Denver; Jacksonville, Florida; New York; and Oklahoma City. The suburbs of Salt Lake City and Boise, Idaho, also ranked high in growth rates.
Simply because Democrats may be gaining strength in suburbs doesn’t mean maps drawn by Republicans will reflect that. The party in control can divide areas of strength for the opposition, said Republican pollster David Winston.
“When you’re talking about redistricting, it’s different than looking at a state as a whole,” said Winston, a longtime adviser to U.S. House Republican leadership.
The fastest-growing U.S. metropolitan area was The Villages in central Florida, which grew 39% from about 93,000 people to about 130,000. The largest retirement community in the nation is dominated by Republican voters and is a must-stop for GOP candidates. Though the Florida Constitution prohibits drawing districts to favor a political party, Republicans leaders may nonetheless try to take advantage of the new population figures. Because of its growth, Florida is gaining a U.S. House seat, giving lawmakers more leeway in line-drawing.
After the 2010 census, Republicans who controlled redistricting in far more states than Democrats drew maps that gave them a greater political advantage in more states than either party had in the past 50 years, according to a new AP analysis.
But Republicans won’t hold as much power as they did last time in some key states. Republican-led legislatures will be paired with Democratic governors in Pennsylvania and Wisconsin, which both had full GOP control after the 2010 census. In Michigan, a voter-approved citizens commission will handle redistricting instead of lawmakers and the governor. And in Ohio, voter-approved redistricting reforms will require majority Republicans to gain the support of minority Democrats for the new districts to last a full decade.
___
David A. Lieb reported from Jefferson City, Missouri, and Acacia Coronado reported from Austin, Texas. Associated Press writers Bryan Anderson in Raleigh, North Carolina, and Thomas Beaumont in Des Moines, Iowa, contributed to this report.
California’s Asian population soars, new census data shows
By ADAM BEAM

1 of 2
FILE - In this Jan. 21, 2006, file photo, Chinese lion dancers perform in Oakland's Chinatown in Oakland, Calif. According to new data from the U.S. Census Bureau released Thursday, Aug. 12, 2021, California's Asian population grew by 25% in the past decade, making them the fastest growing ethnic group in the nation's most populous state. (AP Photo/Paul Sakuma, File)
SACRAMENTO, Calif. (AP) — California’s Asian population grew by 25% in the past decade, making it the fastest growing ethnic group in the nation’s most populous state, according to new data from the U.S. Census Bureau released Thursday.
California’s white population plummeted by 24% between 2010 and 2020, confirming California is one of three states — along with New Mexico and Hawaii — where whites are not the largest ethnic group.
Hispanics surpassed whites as California’s largest ethnic group in 2014. The Census data show California’s Hispanic population grew by 11% to 15.5 million people, making up just shy of 40% of the state’s nearly 40 million residents.
But it was the Asian population that had the biggest percentage gain over the past decade. California now has more than 6 million people of Asian descent — more than the total population of most other states.
Ten years ago, none of California’s 58 counties counted Asians as their largest ethnic group. Now, two do: Alameda County, which includes the cities of Oakland and Berkeley, and Santa Clara County, home to San Jose — the nation’s 10th most-populous city — and the technology capitol of Silicon Valley.
“I think the story nationwide focuses primarily on the Hispanic population, but in California ... I think the Asian population, in particular related to the growth in the younger age groups, is sort of a major driver of factors as to why we see this large increase over the past 10 years,” said Noli Brazil, a demographer at the University of California-Davis.
The data released Thursday by the U.S. Census Bureau will be the foundation for redrawing 429 U.S. House districts in 44 states. Republicans need five seats to win a majority in the U.S. House of Representatives.
Data released earlier this year shows Democratic-heavy California will lose a Congressional seat for the first time in its history because its population grew at a slower rate compared to other states. But California’s redistricting process will likely have less partisan drama because, unlike most states, it is led by an independent Citizens Redistricting Commission instead of the state Legislature.
There were few surprises for California in Thursday’s data release. Los Angeles County remains the nation’s most populous, with more than 10 million people. Eleven counties lost population, with most of them in the sparsely populated region near the Oregon border that has been devastated by wildfires in recent years.
Nine counties had double-digit percentage population growth, led by Trinity County in Northern California with 16.9% growth. Riverside County in Southern California had the largest gain in total population, adding more than 228,000 residents.
California’s Asian population growth has led to growing political power for the community, including earlier this year when Gov. Gavin Newsom appointed Rob Bonta as the state’s first Filipino-American attorney general.
The state Legislature now has 14 Asian Pacific Islanders, a number that will grow to 15 once a special election is held to fill an Alameda County vacancy in the state Assembly, according to Alex Vassar, an unofficial legislative historian at the California State Library.
The rise in influence has coincided with a rise in hate crimes against Asians. A report by the California Attorney General’s Office in June revealed 89 hate crimes against Asians in 2020, more than double the amount in 2019. The most events were recorded in March and April of 2020, when the coronavirus pandemic was taking hold in the state.
California’s new operating budget includes $156.5 million in response to the attacks on the Asian community, with most of the money going to community organizations that provide victim services.
About $10 million will go toward better data collection to better understand the needs and challenges of the diverse community. Robyn Rodriguez, a professor of Asian American Studies at the University of California-Davis, noted California’s Asian population is “linguistically diverse” and “culturally and religiously diverse” that require better data to understand the nuances of the community.
“Asian Americans come to the United States under very different circumstances,” she said. “Some are the products of war and displacement. Others are the product of immigration, of people making the choice to come here. All of these are complexities that really require some better attention.”
Census shows less white Texas ahead of redistricting fight
By ACACIA CORONADO

1 of 2
Light afternoon traffic flows in downtown Dallas, Thursday, Aug. 12, 2021. According to census data released, on average, smaller counties tended to lose population and more populous counties tended to grow with population growth this decade almost entirely in metro areas. (AP Photo/LM Otero)
AUSTIN, Texas (AP) — Four of the nation’s 10 fastest-growing municipalities are suburbs of Texas’ big cities, census data released Thursday shows, meaning the second largest state in the U.S. could play a big part in the redistricting battle for control of Congress.
Texas also grew less white and more urban over the past 10 years, following the same overall trend seen across the country.
The new data culled from the 2020 census is coming more than four months later than expected due to delays caused by the coronavirus pandemic. The redistricting numbers states use for redrawing congressional and legislative districts show where white, Asian, Black and Hispanic communities grew over the past decade. It also shows which areas have gotten older or younger and the number of people living in dorms, prisons and nursing homes. The data covers geographies as small as neighborhoods and as large as states.
An earlier set of data released in April provided state population counts and showed the U.S. had 331 million residents last year, a 7.4% increase from 2010. That dataset determined that Texas will pick up two additional U.S. House seats — bringing its total to 38, and two more electoral votes, for a total of 40, making it’s already large footprint on national politics even bigger.
Ballooning populations in metropolitan areas comes as many of Texas’ rural areas have shrunk, similar to other parts of the U.S.
That — plus the state’s increasingly younger and more diverse demographics — will be important elements to consider in the GOP-controlled process of redrawing the boundaries from which state and federal lawmakers are elected, according to Joshua Blank, research director of the Texas Politics Project at the University of Texas at Austin.
“The nature of the population growth in the state and the fact that it is not evenly distributed throughout means we will have to see a lot of changes to the political maps in order to accommodate the change of the population growth,” Blank said.
Republicans hold a majority of the state’s Congressional and Statehouse seats in both chambers, and they will have full control over the redistricting process.
For now, Republicans and Democrats find themselves at loggerheads. House Democrats walked off the job more than a month ago to block voting restrictions, and that has stopped the Legislature’s work on all bills.
Rep. Jim Murphy, who leads the Texas House Republican Caucus, said the pressure is on his Democratic colleagues to come back to work, and then the state’s redistricting committee could meet.
“I really want the people of Texas to be able to participate in this process — it’s critical — but without a few more Democrats the people of Texas are going to be left out of that process,” Murphy said.
If that committee is unable to meet, Murphy said, redistricting lines would be up to the courts and taken up in the next regular legislative session, set for 2023 — after midterm congressional elections.
Texas Gov. Greg Abbott has said he will continue to call special sessions on voting bills until the Legislature gets the job done. He has also pointed to scheduling a special session for redistricting.
Laws also exist “to protect the equality of the vote between individuals and also to protect groups that have historically been discriminated against,” Blank said.
Drawing politically advantageous district lines is known as gerrymandering.
State Rep. Rafael Anchía, a Democrat, is chair of the Mexican American Legislative Caucus and a member of the House redistricting committee. He said in a statement that he called on his colleagues to “embrace diversity” in redrawing the maps.
“Gerrymandering blocks fair maps that reflect today’s Texas. Today, while Latinos make up 40 percent of the Texas population, we only represent 25 percent of the Texas House,” Anchía said.
Since 2010, Texas has grown by nearly 4 million people — roughly the entire population of neighboring Oklahoma and more than any other state in sheer numbers. Texas is now home to 29 million residents, second in size only to California.
That growth saw five Texas cities — Austin, Dallas, Fort Worth, Houston and San Antonio — gain 100,000 people over the past decade. Frisco and McKinney near Dallas; Conroe near Houston, and New Braunfels near San Antonio are among the 10 fastest growing cities in the U.S.
Democrats generally have fared better in growing Texas suburbs in recent elections. A recent analysis by The Associated Press showed that a decade ago, Republican politicians used census data to draw voting districts that gave them a greater political advantage in more states than either party had in the past 50 years.
___
Acacia Coronado is a corps member for the Associated Press/Report for America Statehouse News Initiative. Report for America is a nonprofit national service program that places journalists in local newsrooms to report on undercovered issues.
WVa leads nation in population drop as redistricting looms
By JOHN RABY

FILE - In this March 12, 2019, file photo, Sebastian Zavala, 2 of Martinsburg, W.Va., plays on the tennis court with his dad Adam Zavala at War Memorial Park in Martinsburg, W.Va. Martinsburg is part of Berkeley County, which saw by far the largest increase in population in the state in the past decade.(Colleen McGrath/The Herald-Mail via AP, File)
CHARLESTON, W.Va. (AP) — West Virginia’s population declined 3.2% over the past decade, the most of any state, according to U.S. Census figures released Thursday, as lawmakers grapple with reshaping the state’s legislative and congressional districts.
The numbers show that West Virginia lost a higher percentage of its residents than any other U.S. state and was one of seven states to lose a congressional seat after the 2020 census. The population fell by 59,278 from 2010 to 2020, to 1.8 million.
The figures show 47 of the state’s 55 counties lost population. Exceptions were in the Eastern Panhandle and two northern counties associated with West Virginia University.
According to the latest data, the biggest jump in population occurred in Berkeley County, which gained 17,907 residents — a 17.2% increase. It is now the state’s second-largest county, with 122,706 people. Nearby Jefferson County’s population jumped 7.9%. The Eastern Panhandle has seen steady population growth this century due to an influx of commuters to Washington, D.C.
The state’s largest county, Kanawha, which includes the capital of Charleston, remains the most populous, despite a 6.4% drop to 180,745 residents.
Monongalia County, which includes WVU’s Morgantown campus, saw a 10% increase and overtook Cabell as the state’s third-most populous county, with 105,822 residents. Preston County, east of Monongalia, saw a 2.1% increase, to 34,216 residents.
Putnam County, between Huntington and Charleston, saw the only other significant increase of 3.5%. The county now has 57,440 residents.
Besides people leaving the state, West Virginia’s population has seen changing demographics, with deaths outpacing births for the past two decades, according to the National Center for Health Statistics.
Population losses were especially hard in counties where coal mines closed, including in the southern coalfields. McDowell County lost 13.6% of its residents in the past decade, dropping to a population of below 20,000 for the first time since 1900. After U.S. Steel sold the last of its mining operations in McDowell County in 2003, 23% of the population left because there was no other industry to rely on for jobs.
Pendleton County lost the highest percentage of its residents, 20.2%, followed by Ritchie County at 19.2% and Calhoun County at 18.3%. They now have populations of 6,143, 8,444 and 6,229, respectively.
Lawmakers must pare three U.S. House districts down to two — all three have sitting Republicans — as well as map out districts for 34 state Senate and 100 House of Delegates seats. Next year, the entire House will be elected from single-member districts for the first time under a law passed in 2018. Currently, more than half of the House is elected from multiple-member districts.
Public hearings are being held around the state through mid-September, including one in Morgantown on Thursday. A special session is expected to convene later in the year.
Morgan County Republican Charles Trump is leading the Senate committee and Mineral County Republican Gary Howell chairs the House committee. The GOP holds a supermajority in both chambers. Republicans have a wide advantage in both committees.
By JOHN RABY
FILE - In this March 12, 2019, file photo, Sebastian Zavala, 2 of Martinsburg, W.Va., plays on the tennis court with his dad Adam Zavala at War Memorial Park in Martinsburg, W.Va. Martinsburg is part of Berkeley County, which saw by far the largest increase in population in the state in the past decade.(Colleen McGrath/The Herald-Mail via AP, File)
CHARLESTON, W.Va. (AP) — West Virginia’s population declined 3.2% over the past decade, the most of any state, according to U.S. Census figures released Thursday, as lawmakers grapple with reshaping the state’s legislative and congressional districts.
The numbers show that West Virginia lost a higher percentage of its residents than any other U.S. state and was one of seven states to lose a congressional seat after the 2020 census. The population fell by 59,278 from 2010 to 2020, to 1.8 million.
The figures show 47 of the state’s 55 counties lost population. Exceptions were in the Eastern Panhandle and two northern counties associated with West Virginia University.
According to the latest data, the biggest jump in population occurred in Berkeley County, which gained 17,907 residents — a 17.2% increase. It is now the state’s second-largest county, with 122,706 people. Nearby Jefferson County’s population jumped 7.9%. The Eastern Panhandle has seen steady population growth this century due to an influx of commuters to Washington, D.C.
The state’s largest county, Kanawha, which includes the capital of Charleston, remains the most populous, despite a 6.4% drop to 180,745 residents.
Monongalia County, which includes WVU’s Morgantown campus, saw a 10% increase and overtook Cabell as the state’s third-most populous county, with 105,822 residents. Preston County, east of Monongalia, saw a 2.1% increase, to 34,216 residents.
Putnam County, between Huntington and Charleston, saw the only other significant increase of 3.5%. The county now has 57,440 residents.
Besides people leaving the state, West Virginia’s population has seen changing demographics, with deaths outpacing births for the past two decades, according to the National Center for Health Statistics.
Population losses were especially hard in counties where coal mines closed, including in the southern coalfields. McDowell County lost 13.6% of its residents in the past decade, dropping to a population of below 20,000 for the first time since 1900. After U.S. Steel sold the last of its mining operations in McDowell County in 2003, 23% of the population left because there was no other industry to rely on for jobs.
Pendleton County lost the highest percentage of its residents, 20.2%, followed by Ritchie County at 19.2% and Calhoun County at 18.3%. They now have populations of 6,143, 8,444 and 6,229, respectively.
Lawmakers must pare three U.S. House districts down to two — all three have sitting Republicans — as well as map out districts for 34 state Senate and 100 House of Delegates seats. Next year, the entire House will be elected from single-member districts for the first time under a law passed in 2018. Currently, more than half of the House is elected from multiple-member districts.
Public hearings are being held around the state through mid-September, including one in Morgantown on Thursday. A special session is expected to convene later in the year.
Morgan County Republican Charles Trump is leading the Senate committee and Mineral County Republican Gary Howell chairs the House committee. The GOP holds a supermajority in both chambers. Republicans have a wide advantage in both committees.
Census shows South Dakota cities fueled growth
By STEPHEN GROVES

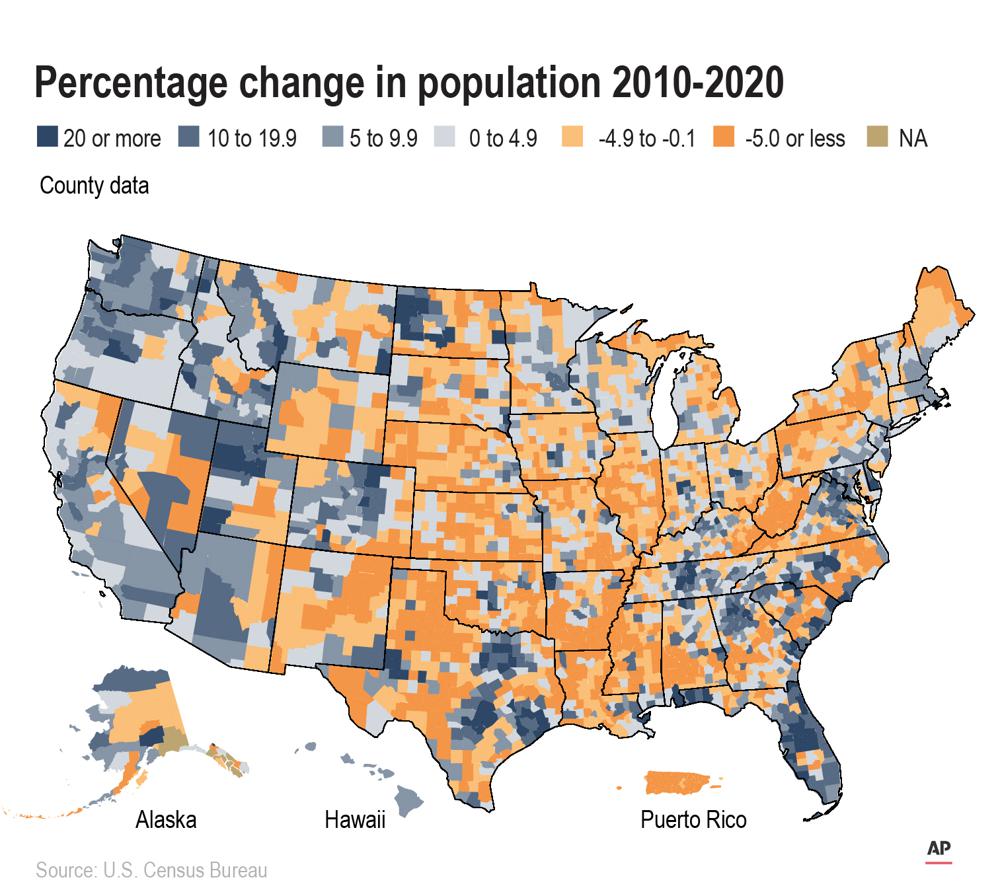
A county map of the United States and Puerto Rico shows percentage change in population 2010 to 2020.
SIOUX FALLS, S.D. (AP) — South Dakota’s cities fueled the state’s population growth over the last decade, according to detailed population data released Thursday by the U.S. Census Bureau that will form the basis for the state’s new legislative boundaries.
The state’s three most populous counties — Minnehaha, Lincoln and Pennington — accounted for most of the population growth. Lincoln County, which contains parts of Sioux Falls and its surrounding communities, saw the fastest growth, increasing by 45% to 65,161 people. The trend means that legislative power will shift towards cities because each legislative district must contain roughly the same number of people.
Lawmakers tasked with drawing new boundaries for legislative districts said they will begin to pour over the data in earnest later this month. Redistricting committees, dominated by Republicans, will meet on Aug. 30.
“This data really is the foundation we will work from,” said Republican Sen. Mary Duvall, the chair of the Senate Redistricting Committee.
Legislative redistricting happens every 10 years after a federal census. Lawmakers are aiming to come up with legislative districts that represent 25,333 people, with some wiggle room allowed. They are also supposed to follow current county and municipal boundaries as much as possible.
Lawmakers are working on a tighter timeline than in previous years because the pandemic delayed the Census Bureau’s report. Lawmakers are planning to have draft boundaries drawn up by October, when they will hold a series of public hearings across the state. State law gives them a Dec. 1 deadline to approve the new districts.
“Normally this data is evaluated and compiled through multiple months,” said Republican House Speaker Spencer Gosch, who is also the chair for the House Redistricting Committee. “It’s going to be fast.”
Republicans hold large majorities on both House and Senate Redistricting Committees, with Democrats grasping on to a single seat on either committee. Democrats hold about 10% of legislative seats, so proportionately, the redistricting committee is in line with the Legislature’s makeup.
Democrat Rep. Ryan Cwach, the lone Democrat on the House committee, said he was hoping the boundary lines end up “fair” without any gerrymandering, a process by which voters are either divided or combined to make it more likely for one party to win future elections.
Lawmakers have indicated the most challenging areas will be cities and Native American reservations. Federal law requires the state to ensure racial minority groups receive adequate representation in state government. More than half of the population growth in Sioux Falls, the state’s largest city, came from minority groups. The city’s Black, Asian and Hispanic populations have nearly doubled in the last decade.
Several counties in the Black Hills on the western side of the state saw jumps in population as well. Meade and Pennington Counties reported a combined increase of 13,642 people.
“Ultimately, there will have to be more districts in those areas,” said Republican Sen. Jim Bolin, vice-chair of the redistricting committee. “The rural areas will have less representation.”
___
Follow Mike Schneider on Twitter at https://twitter.com/MikeSchneiderAP
By STEPHEN GROVES
A county map of the United States and Puerto Rico shows percentage change in population 2010 to 2020.
SIOUX FALLS, S.D. (AP) — South Dakota’s cities fueled the state’s population growth over the last decade, according to detailed population data released Thursday by the U.S. Census Bureau that will form the basis for the state’s new legislative boundaries.
The state’s three most populous counties — Minnehaha, Lincoln and Pennington — accounted for most of the population growth. Lincoln County, which contains parts of Sioux Falls and its surrounding communities, saw the fastest growth, increasing by 45% to 65,161 people. The trend means that legislative power will shift towards cities because each legislative district must contain roughly the same number of people.
Lawmakers tasked with drawing new boundaries for legislative districts said they will begin to pour over the data in earnest later this month. Redistricting committees, dominated by Republicans, will meet on Aug. 30.
“This data really is the foundation we will work from,” said Republican Sen. Mary Duvall, the chair of the Senate Redistricting Committee.
Legislative redistricting happens every 10 years after a federal census. Lawmakers are aiming to come up with legislative districts that represent 25,333 people, with some wiggle room allowed. They are also supposed to follow current county and municipal boundaries as much as possible.
Lawmakers are working on a tighter timeline than in previous years because the pandemic delayed the Census Bureau’s report. Lawmakers are planning to have draft boundaries drawn up by October, when they will hold a series of public hearings across the state. State law gives them a Dec. 1 deadline to approve the new districts.
“Normally this data is evaluated and compiled through multiple months,” said Republican House Speaker Spencer Gosch, who is also the chair for the House Redistricting Committee. “It’s going to be fast.”
Republicans hold large majorities on both House and Senate Redistricting Committees, with Democrats grasping on to a single seat on either committee. Democrats hold about 10% of legislative seats, so proportionately, the redistricting committee is in line with the Legislature’s makeup.
Democrat Rep. Ryan Cwach, the lone Democrat on the House committee, said he was hoping the boundary lines end up “fair” without any gerrymandering, a process by which voters are either divided or combined to make it more likely for one party to win future elections.
Lawmakers have indicated the most challenging areas will be cities and Native American reservations. Federal law requires the state to ensure racial minority groups receive adequate representation in state government. More than half of the population growth in Sioux Falls, the state’s largest city, came from minority groups. The city’s Black, Asian and Hispanic populations have nearly doubled in the last decade.
Several counties in the Black Hills on the western side of the state saw jumps in population as well. Meade and Pennington Counties reported a combined increase of 13,642 people.
“Ultimately, there will have to be more districts in those areas,” said Republican Sen. Jim Bolin, vice-chair of the redistricting committee. “The rural areas will have less representation.”
___
Follow Mike Schneider on Twitter at https://twitter.com/MikeSchneiderAP