Tuesday, August 31, 2021


How star-making pollutes the cosmos
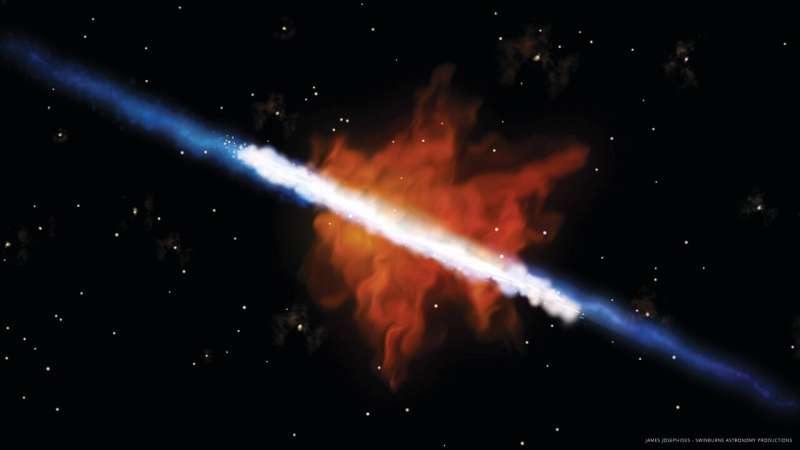
Galaxies pump out contaminated exhausts
Galaxies pump out contaminated exhausts. Credit: James Josephides, Swinburne 
Astronomical Productions

Galaxies pollute the environment they exist in, researchers have found.

A team of astronomers led by Alex Cameron and Deanne Fisher from the ARC Centre of Excellence for All Sky Astrophysics in 3 Dimensions (ASTRO 3D) used a new imaging system on at the WM Keck Observatory in Hawaii to confirm that what flows into a galaxy is a lot cleaner than what flows out.

The research is published today in The Astrophysical Journal.

"Enormous clouds of gas are pulled into galaxies and used in the process of making ," said co-lead author Deanne Fisher, associate professor at the Centre for Astrophysics and Supercomputing at Swinburne University in Australia.

"On its way in it is made of hydrogen and helium. By using a new piece of equipment called the Keck Cosmic Web Imager, we were able to confirm that stars made from this fresh gas eventually drive a huge amount of material back out of the system, mainly through supernovas.

"But this stuff is no longer nice and clean—it contains lots of other elements, including oxygen, carbon, and iron."

The process of atoms flooding into galaxies—known as 'accretion' – and their eventual expulsion—known as 'outflows' – is an important mechanism governing the growth, mass and size of galaxies.

Until now, however, the composition of the inward and outward flows could only be guessed at. This research is the first time the full cycle has been confirmed in a galaxy other than the Milky Way.


Galaxies pump out contaminated exhausts. Credit: James Josephides, Swinburne Astronomical Productions

To make their findings, the researchers focused on a galaxy called Mrk 1486, which lies about 500 million light years from the Sun and is going through a period of very rapid star formation.

"We found there is a very clear structure to how the gases enter and exit," explained Dr. Alex Cameron, who has recently moved from University of Melbourne in Australia to the UK's University of Oxford.

"Imagine the galaxy is a spinning frisbee. The gas enters relatively unpolluted from the cosmos outside, around the perimeter, and then condenses to form new stars. When those stars later explode, they push out other gas—now containing these other elements—through the top and bottom."

The elements—comprising more than half the Periodic Table—are forged deep inside the cores of the stars through nuclear fusion. When the stars collapse or go nova the results are catapulted into the Universe—where they form part of the matrix from which newer stars, planets, asteroids and, in at least one instance, life emerges.

Mrk 1486 was the perfect candidate for observation because it lies "edge-on" to Earth, meaning that the outflowing gas could be easily viewed, and its composition measured. Most galaxies sit at awkward angles for this type of research.

"This work is important for astronomers because for the first time we've been able to put limits on the forces that strongly influence how galaxies make stars," added Professor Fisher.

"It takes us one step closer to understanding how and why  look the way they do—and how long they will last."

Other scientists contributing to the work are based at the University of Texas at Austin, the University of Maryland at College Park, and the University of California at San Diego—all in the US—plus the Universidad de Concepcion in Chile.

Cosmic galaxy assembly and the evolution of metals

More information: The DUVET Survey: Direct Te-based metallicity mapping of metal-enriched outflows and metal-poor inflows in Mrk 1486, Astrophysical Journal (2021). iopscience.iop.org/article/10. … 847/2041-8213/ac18ca

Further information about the Survey: www.deannefisher.com/duvet

Journal information: Astrophysical Journal 

Provided by ARC Centre of Excellence for All Sky Astrophysics in 3D (ASTRO 3D)
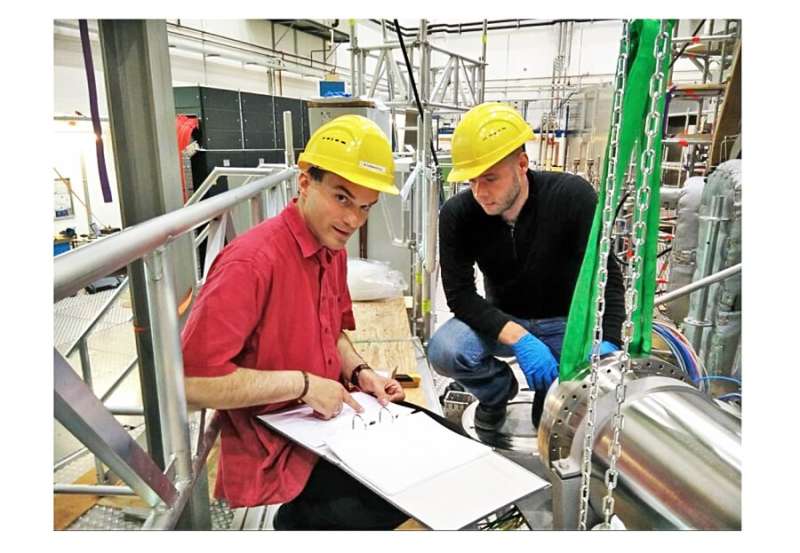
 

Physicist helps confirm a major advance in stellarator performance for fusion energy

PPPL physicist helps confirm a major advance in stellarator performance for fusion energy
IPP physicist Andreas Langenberg, left, and PPPL physicist Novimir Pablant before 
installation of the XICS diagnostic on the W7-X. Credit: Scott Massida

Stellarators, twisty magnetic devices that aim to harness on Earth the fusion energy that powers the sun and stars, have long played second fiddle to more widely used doughnut-shaped facilities known as tokamaks. The complex twisted stellarator magnets have been difficult to design and have previously allowed greater leakage of the superhigh heat from fusion reactions.

Now scientists at the Max Planck Institute for Plasma Physics (IPP), working in collaboration with researchers that include the U.S. Department of Energy's (DOE) Princeton Plasma Physics Laboratory (PPPL), have shown that the Wendelstein 7-X (W7-X) device in Greifswald, Germany, the largest and most advanced stellarator in the world, is capable of confining  that reaches temperatures twice as great as the core of the sun.

Key indicator

A diagnostic instrument called the XICS, chiefly designed, built and operated by PPPL physicist Novimir Pablant in collaboration with IPP physicist Andreas Langenberg, is a key indicator of a sharp reduction of a type of heat loss called "neoclassical " that has historically been greater in classical stellarators than in tokamaks. Causing the troublesome transport are frequent collisions that knock heated particles out of their orbits as they swirl around the magnetic field lines that confine them. Contributing to the transport are drifts in the particle orbits.

A recent report on W7-X findings in Nature magazine confirms the success of the efforts of designers to shape the intricately twisted stellarator magnets to reduce neoclassical transport. First author of the paper was physicist Craig Beidler of the IPP Theory Division. "It's really exciting news for fusion that this design has been successful," said Pablant, a coauthor along with Langenberg of the paper. "It clearly shows that this kind of optimization can be done."

David Gates, head of the Advanced Projects Department at PPPL that oversees the laboratory's stellarator work, was also highly enthused. "It's been very exciting for us, at PPPL and all the other U.S. collaborating institutions, to be part of this really exciting experiment," Gates said. "Novi's work has been right at the center of this amazing experimental team's effort. I am very grateful to our German colleagues for so graciously enabling our participation."

Carbon-free power

The fusion that scientists seek to produce combines light elements in the form of plasma—the hot, charged state of matter composed of free electrons and atomic nuclei, or ions, that makes up 99 percent of the visible universe—to generate massive amounts of energy. Producing controlled fusion on Earth would create a virtually inexhaustible supply of safe, clean, and carbon-free source of power to generate electricity for humanity and serve as a major contributor to the transition away from fossil fuels.

Stellarators, first constructed in the 1950s under PPPL founder Lyman Spitzer, can operate in a steady state with little risk of the plasma disruptions that tokamaks face. However, their complexity and history of relatively poor heat confinement has held them back. A major goal of the optimized design of W7-X, which produced its first plasma in 2015, has been to demonstrate the appropriateness of an optimized stellarator as an eventual fusion power plant.

Results obtained by the XICS demonstrate hot ion temperatures that could not have been achieved without a sharp reduction in neoclassical transport. These measurements were also made by the CXRS diagnostic built and operated by IPP, which were thought to be a little more accurate but could not be made in all conditions. The final temperature profiles in the Nature report were taken from CXRS and supported by measurements with XICS in similar plasmas.

'Extremely valuable'

"Without the XICS we probably would not have discovered this [good confinement] regime," said Robert Wolf, head of the W7-X heating and operation division and a co-author of the paper. "We needed a readily available ion temperature measurement and this was extremely valuable."

Researchers conducted a thought experiment to check the role that optimization played in the confinement results. The experiment found that in a non-optimized stellarator large neoclassical transport would have made the high temperatures recorded on W7-X for the given heating power impossible. "This showed that the optimized shape of W7-X reduced the neoclassical transport and was necessary for the performance seen in W7-X experiments," Pablant said. "It was a way of showing how important the optimization was."

The results mark a step toward enabling stellarators based on the W7-X design to lead to a practical fusion reactor, he added. "But reducing neoclassical transport isn't the only thing you have to do. There are a whole bunch of other goals that have to be shown, including running steady and reducing the turbulent transport." Producing turbulent transport are ripples and eddies that run through the plasma as the second main source of heat loss.

The W7-X will reopen in 2022 following a three-year upgrade to install a water-cooling system that will lengthen fusion experiments and an improved divertor that will exhaust high-performance heat. The upgrades will enable the next step in the investigation by W7-X researchers of the worthiness of optimized stellarators to become blueprints for power plants.

The Wendelstein 7-X concept proves its efficiency
More information: C. D. Beidler et al, Demonstration of reduced neoclassical energy transport in Wendelstein 7-X, Nature (2021). DOI: 10.1038/s41586-021-03687-w
Journal information: Nature
 Provided by Princeton Plasma Physics Laboratory 

AUSTRALIAN SCIENTISTS HELP CATCH THE FIRST MOMENTS OF A SUPERNOVA

Astronomers from the Australian National University, have led an international team of researchers to observe, for the first time, the early light curve from a supernova event and modelled the type of progenitor star that caused it.

Illustration of a star that is ripping apart in several regions and gaseous materials are coming out of these regions.
The initial shock breakout of light just as the supernova occurs on a star. Credit: NASA.

Astronomers from the Australian National University (ANU) have led an international team of researchers to make the first observations of the light emitted just as a supernova explosion detonates in space. The data has also provided an opportunity to test different models in which the progenitor star can be inferred through measuring the supernova’s light curve.

Until now, most of the light received from supernovae events was the result of astronomers making detections after the initial blast and produced by the decay of radioactive elements in the expanding debris shell from the blast, which usually occurs sometime after the original event.

But this new research, published in the journal Monthly Notices of the Royal Astronomical Society, outlines the detection of a light curve peak (known as a ‘shock cooling light-curve’)  which presents the burst of emissions immediately after the explosion occurs – a rare observation, as these events fade quickly. The new discovery has been named SN2017jgh.

"This is the first time anyone has had such a detailed look at a complete shock cooling curve in any supernova," said PhD scholar and lead author, Mr Patrick Armstrong.

"Because the initial stage of a supernova happens so quickly, it is very hard for most telescopes to record this phenomenon.”

"Until now, the data we had was incomplete and only included the dimming of the shock cooling curve and the subsequent explosion, but never the bright burst of light at the very start of the supernova.

"This major discovery will give us the data we need to identify other stars that became supernovae, even after they have exploded," he said.

Supernovae events can be triggered by a number of different factors, including merging compact stars like white dwarfs or the collapse of more massive stars. So violent and powerful are these events, that they forge a large number of elements that we see around us including many of the heavier elements in the periodic table.

By studying the lights from these events, effectively astronomers are given a tool to delve into the formation of elements across the Universe. Additionally, by studying the shock cooling light-curves that is produced during supernovae, astronomers can now also start to answer some of the ongoing questions around the dynamics of collapsing stellar objects once they reach the end of their main sequence lives.

THE STAR THAT WAS…

Large yellow star with flares and prominences
Artist illustration of a yellow supergiant star. Credit: M. Jadraef.

Based on the observations made of the shock cooling light-curves, and modelling completed, the research team were able to determine that the progenitor star to SN2017jgh was a yellow supergiant star. These types of stars are usually evolved F or G class stars that are no longer burning hydrogen in their cores, so have since expanded to enormous sizes – which in turn increases their luminosity.

Yellow supergiants usually have a temperature range of around 4,000 – 7,000 Kelvin, with their luminosities shining from about 1,000 times that of our Sun, but in the most extreme cases, this can also get up to 100,000 times the solar luminosity.

SN2017jgh progenitor star was also identified in imagery, prior to the explosion, and determined to have had an effective temperature somewhere between 4000 – 5000 Kelvin and contain an original mass of 17 times that of our Sun.

However, yellow supergiants are less common than the regular red supergiants that are dominant in the night sky, like Antares and Betelgeuse, and are usually smaller in size. The northern pole star, Polaris, is catalogued as a yellow supergiant.

SN2017jgh also features a surrounding envelope of hydrogen gas whose mass is expected to be ranged between 0.5 - 1.7 times that of the Sun. These envelopes form as the star ages and throw off enormous volumes of hydrogen into their local surrounding regions through expected mechanisms like strong stellar winds, stellar rotation, binary interactions and nuclear instabilities.

The size of the hydrogen envelope from SN2017jgh is reported in the paper to have a radius of approximately 130 solar radii, which equates to about 180 million kilometres – so if you placed it where our Sun was, its surface would lie beyond the Earth’s orbit. 

The supernovae event was located 0.157 arcseconds away from its host galaxy centre, which resides at a distance of just over one billion light-years from Earth.

SUPERNOVAE IN A RANGE OF FLAVOURS

Infographic that shows the two types of supernovae events and the features they exhibit, such as elementary lines per supernovae type.
Classifying supernovae events into categories, based on how they exhibit hydrogen, silicon and helium features. Credit: H. Stevance.

Supernovae can be triggered by a number of different progenitor objects and events. The taxonomy of these events is divided into two main classes – those that feature hydrogen in the light curve’s spectrum, and those that don’t. From these two classes, further sub-classes are also established.

The first type, Type I supernovae, is considered thermal runaway events, and usually associated with massive compact objects like white dwarfs. These supernovae are usually triggered when accretion of material builds up on one star from a companion; an accretion of materials create enough pressure to trigger a core ignition, or when two compact objects merge (though in the case of Neutron Star mergers, these are known as a Kilonova).

But the other category, called Type II supernovae, is a much more powerful and destructive event. These are triggered when a massive star (usually 8 – 25 solar masses) can no longer produce core energy to sustain the outwards pushing radiation pressure and thus succumbs to the inward gravitational force.

This causes the star to collapse inwards, crushing the core before rebounding in the supernova explosion – this is also how exotic objects like neutron stars, pulsars and black holes are born.

Type II Supernovae can be further sub-categorised depending again on a number of different factors presented in the light curve observed (esp. if it does or doesn’t feature silicon, helium, narrow lines, or an evolving spectrum).

One indicator that the progenitor star had a large hydrogen envelope surrounding it is the fading of hydrogen lines weeks after the initial explosion, giving way to the rise of dominant helium lines, suggesting that a lot of the hydrogen layer of the star had become stripped during the envelope shedding.

READING THE LIGHT CURVE OF AN EXPLODING STAR

When it comes to the Type II supernovae (core-collapse models), there are generally two prominent peaks that appear in the light curve signature. The first is created when photons that have been trapped inside the star rush outwards in the early onset of the violent explosion, and only last a few days. These emissions can provide astronomers with lots of information about the progenitor star, and the shockwave generated from the explosion.

The second, are caused by the nuclear-powered emissions from the radioactive decay of 56Ni into cobalt, then iron over the course of some time, usually coming in a few days and weeks after the event. This is the source of the second peak in the light curve, but also eventually reduces in luminosity over the period. It is during these times in which new elements are forged through nucleosynthesis associated with the stellar explosion.

Historically, a number of shock cooling light-curves have been observed as reported for other supernovae events, but these new findings have allowed astronomers to capture the complete evolution of the initial peak associated with a supernova for the first time.

Whilst many supernovae occur and can be studied, catching them in their early onset is the only time where these shock cooling light-curves can be observed, and so having telescopes pointed at the right place and the right time is a rare chance.

Infographic that shows the different elements in colour coding, shading regions of the spectrum for several different supernovae types.
Infographic on what the different light curves of supernovae look like - note the difference in the shape of the curves, as well as the elementary composition. The two main categories of supernovae events can be classed under thermonuclear and core-collapse models. Credit: H. Stevance.

ANALYSIS AND MODELLING OF THE LIGHT FROM 2017JGH

Artist rendition of the Kepler spacecraft in orbit with a bright Sun in the background and a small blue Earth off in the distance.
The Kepler Space Telescope, which assisted in obtaining data from this discovery. Credit: NASA.

A number of different observations were made to come to establish the results outlined in this latest paper, relating to SN2017jgh. Originally, the supernova was discovered by Pan-STARRS1 – a 1.8-metre telescope located in Maui, Hawaii. Using the 1.4 Gigapixel camera, it identified the supernova which presented at roughly magnitude 20.

Photometry (measuring light in different bands in similar wavelengths that the humane eye observes in) was also produced using Pan-STARRS1 filtering system (grizy), and the Swope Supernova Survey (SSS) – which uses a 1-metre aperture telescope, located in Las Campanas in Chile also complemented with its own observations. The SSS telescope’s filtering system (gri) observed the supernova between December 2017 and February 2018.

As well as ground-based observations, the Kepler/K2 spacecraft took observations of the event from orbit, avoiding any disturbances produced by our atmosphere. It observed the event at 30 minutes cadence over an 80-day campaign, which really highlighted the rise in the light curve’s first peak in lots of detail.

For the optical spectroscopy component, the Gemini Multi-Object Spectrograph on the Gemini South Telescope (also located in Chile) was used and took in observations of the spectrum in early January 2018, two days prior to the radioactive maximum peak which occurs roughly 14 days after discovery.

Overall, the light curves that were analysed across all observations point to a similar supernova to another observed in the early 1990s, known as SN1993J, which also featured a yellow supergiant star.

A number of shock cooling light-curve models were then used to test the results, with the SW 17 model fitting the most accurate to the data observed.

"We've proven one model works better than the rest at identifying different supernovae stars and there is no longer a need to test multiple other models, which has traditionally been the case," said Astrophysicist and ANU researcher Dr Brad Tucker, also a co-author of the paper.

"Astronomers across the world will be able to use SW 17 and be confident it is the best model to identify stars that turn into supernovas."

As well as providing global researchers with a well-fitted model for these early peaks in supernovae events, these new findings now showcase a little bit more of the detail around those first, early moments during one of the most violent and destructive incidents in our Universe, which in turn gives birth to new materials.

"This will provide us with further opportunities to improve our models and build our understanding of supernovae and where the elements that make up the world around us come from," said Mr Armstrong.

New mathematical solutions to an old problem in astronomy

astronomy
Credit: CC0 Public Domain

For millennia, humanity has observed the changing phases of the Moon. The rise and fall of sunlight reflected off the Moon, as it presents its different faces to us, is known as a "phase curve". Measuring phase curves of the Moon and Solar System planets is an ancient branch of astronomy that goes back at least a century. The shapes of these phase curves encode information on the surfaces and atmospheres of these celestial bodies. In modern times, astronomers have measured the phase curves of exoplanets using space telescopes such as Hubble, Spitzer, TESS and CHEOPS. These observations are compared with theoretical predictions. In order to do so, one needs a way of calculating these phase curves. It involves seeking a solution to a difficult mathematical problem concerning the physics of radiation.

Approaches for the calculation of phase curves have existed since the 18th century. The oldest of these solutions goes back to the Swiss mathematician, physicist and astronomer, Johann Heinrich Lambert, who lived in the 18th century. "Lambert's law of reflection" is attributed to him. The problem of calculating reflected light from Solar System planets was posed by the American astronomer Henry Norris Russell in an influential 1916 paper. Another well-known 1981 solution is attributed to the American lunar scientist Bruce Hapke, who built on the classic work of the Indian-American Nobel laureate Subrahmanyan Chandrasekhar in 1960. Hapke pioneered the study of the Moon using mathematical solutions of phase curves. The Soviet physicist Viktor Sobolev also made important contributions to the study of reflected light from celestial bodies in his influential 1975 textbook. Inspired by the work of these scientists, theoretical astrophysicist Kevin Heng of the Center for Space and Habitability CSH at the University of Bern has discovered an entire family of new mathematical solutions for calculating phase curves. The paper, authored by Kevin Heng in collaboration with Brett Morris from the National Center of Competence in Research NCCR PlanetS—which the University of Bern manages together with the University of Geneva—and Daniel Kitzmann from the CSH, has just been published in Nature Astronomy.

Generally applicable solutions

"I was fortunate that this rich body of work had already been done by these great scientists. Hapke had discovered a simpler way to write down the classic solution of Chandrasekhar, who famously solved the radiative transfer equation for isotropic scattering. Sobolev had realised that one can study the problem in at least two mathematical coordinate systems." Sara Seager brought the problem to Heng's attention by her summary of it in her 2010 textbook.

By combining these insights, Heng was able to write down mathematical solutions for the strength of reflection (the albedo) and the shape of the phase curve, both completely on paper and without resorting to a computer. "The ground-breaking aspect of these solutions is that they are valid for any law of reflection, which means they can be used in very general ways. The defining moment came for me when I compared these pen-and-paper calculations to what other researchers had done using computer calculations. I was blown away by how well they matched," said Heng.

Successful analysis of the phase curve of Jupiter

"What excites me is not just the discovery of new theory, but also its major implications for interpreting data", says Heng. For example, the Cassini spacecraft measured phase curves of Jupiter in the early 2000s, but an in-depth analysis of the data had not previously been done, probably because the calculations were too computationally expensive. With this new family of solutions, Heng was able to analyze the Cassini phase curves and infer that the atmosphere of Jupiter is filled with clouds made up of large, irregular particles of different sizes. This parallel study has just been published by the Astrophysical Journal Letters, in collaboration with Cassini data expert and planetary scientist Liming Li of Houston University in Texas, U.S.A.

Credit: University of Bern

New possibilities for the analysis of data from space telescopes

"The ability to write down mathematical solutions for phase curves of reflected light on paper means that one can use them to analyze data in seconds," said Heng. It opens up new ways of interpreting data that were previously infeasible. Heng is collaborating with Pierre Auclair-Desrotour (formerly CSH, currently at Paris Observatory) to further generalize these mathematical solutions. "Pierre Auclair-Desrotour is a more talented applied mathematician than I am, and we promise exciting results in the near future," said Heng.

In the Nature Astronomy paper, Heng and his co-authors demonstrated a novel way of analyzing the phase curve of the exoplanet Kepler-7b from the Kepler space telescope. Brett Morris led the data analysis part of the paper. "Brett Morris leads the data analysis for the CHEOPS mission in my research group, and his modern data science approach was critical for successfully applying the mathematical solutions to real data," explained Heng. They are currently collaborating with scientists from the American-led TESS space telescope to analyze TESS phase curve data. Heng envisions that these new solutions will lead to novel ways of analyzing phase curve data from the upcoming, 10-billion-dollar James Webb Space Telescope, which is due to launch later in 2021. "What excites me most of all is that these mathematical solutions will remain valid long after I am gone, and will probably make their way into standard textbooks," said Heng.

Atmospheric chemistry on paper
More information: Heng, K. et al, Closed-formed solutions of geometric albedos and phase curves of exoplanets for any reflection law, Nature Astronomy (2021). DOI: doi.org/10.1038/s41550-021-01444-7
Kevin Heng et al, Jupiter as an Exoplanet: Insights from Cassini Phase Curves, The Astrophysical Journal Letters (2021). DOI: 10.3847/2041-8213/abe872
Journal information: Nature Astronomy  , Astrophysical Journal Letters 
Provided by University of Bern 


Woodside: Gulf Of Mexico Has Solid Growth Potential

The Gulf of Mexico offers some good growth opportunities thanks to the quality assets BHP operates there, Australia’s Woodside Petroleum’s chief executive Meg O’Neill told MarketWatch.

"One of the things that I think is really exciting about the merger is it does give us a substantially increased growth optionality when we look at the quality assets in the Gulf of Mexico, the quality assets we have here in Australia and then other opportunities in places like Trinidad, Tobago, Mexico and Senegal," she said in an interview.

BHP sold its oil business to the Australian major earlier this month in an all-stock merger deal.

“Merging Woodside with BHP’s oil and gas business delivers a stronger balance sheet, increased cash flow and enduring financial strength to fund planned developments in the near term and new energy sources into the future,” Woodside said in its statement at the time.

BHP’s assets in the Gulf of Mexico, according to O’Neill, were particularly valuable. The assets include operating stakes in two fields—Shenzi and Neptune—and non-operating interests in two other fields, Atlantis and Mad Dog. BHP recently approved a $544-million cash injection for the development of Shenzi North.

"We believe there is significant running room in those assets," O’Neill told MarketWatch.

The Shenzi field holds estimated recoverable reserves of 350 to 400 million barrels of oil equivalent and more in potential reserves that are also being targeted for exploitation, according to Offshore Technology. It has a production capacity of 100,000 bpd but exceeded that in the first year of production.

The Neptune field has reserves estimated at between 100 and 150 million barrels and the capacity to produce 50,000 bpd of crude oil.

Atlantis, operated by BP, is the third-largest oil field in the Gulf of Mexico. It has a production capacity of 200,000 bpd of crude oil. Mad Dog, another field operated by BP, holds between 200 and 450 million barrels of oil equivalent and can produce some 80,000 bpd.

By Irina Slav for Oilprice.com


Canadian Liberals Vow Stricter Emission Regulation On Oil Industry

The oil industry of Canada is facing more stringent regulation if the Liberals win the next election, according to a new platform published this weekend.

In it, the ruling party of PM Justin Trudeau wrote that it will work towards making the country’s oil and gas sector net-zero by 2050 by “Making sure the oil and gas sector reduces emissions from current levels at a pace and scale needed to achieve net-zero by 2050, with 5-year targets starting in 2025,” and by “Requiring oil and gas companies to reduce methane emissions by at least 75% below 2012 levels by 2030.”

The platform also states that the Liberals will work towards phasing out thermal coal exports and imports by 2030 as part of efforts to achieve a net—zero electricity grid by 2035. This goal will also involve setting a clean energy standard, adding more tax credits for low-carbon energy projects and setting up a Pan-Canadian Grid Council, whose purpose would be to “make Canada the most reliable, cost-effective and carbon-free electricity producer in the world.”

“A serious plan for the environment is a plan for the economy,” Justin Trudeau, leader of the Liberal Party, told Bloomberg. “We have done more to fight climate change and protect our environment than any other government in Canadian history.”

The plan paid out in the pre-election platform also includes more incentives for Canadians to buy electric vehicles with a view to having half of new car sales be EVs by 2030 and all new cars sold in the country are net-zero by 2035. To this end, the next Liberal government promises to extend an EV consumer rebate of $3,960 (C$5,000) to half a million Canadians, and building 50,000 new charging stations across the country.

The platform also envisages supporting measures for the Canadian oil and gas industry, featuring a $1.58-billion (C$2-billion) Futures Fund for Alberta, Saskachewan, and Newfoundland and Labrador, which the platform says will seek to ensure the energy transition is just and provide oil and gas workers with training “to succeed in the net-zero future.”

By Irina Slav for Oilprice.com