Wednesday, September 01, 2021

A carbon-neutral response to rising electricity demand
A carbon-neutral response to rising electricity demand
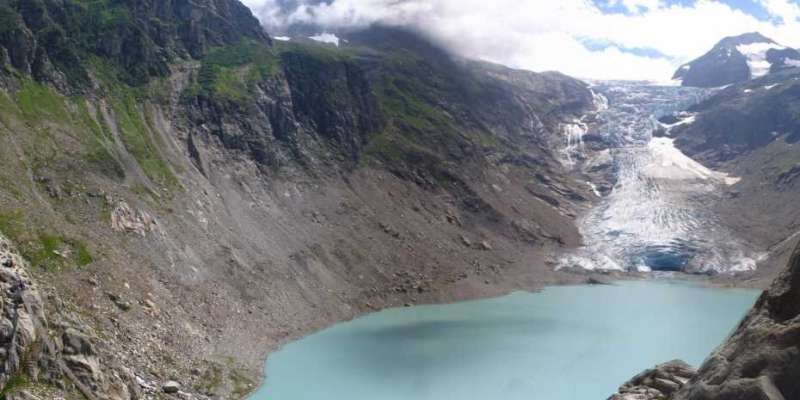
An expansion of hydropower could contribute significantly to the energy
 transition. But plans for new reservoirs, such as the one at the Trift glacier in 
the canton of Bern (taken in 2007), face political opposition.
 Credit: Wikimedia Commons/Thisisbossi

Many everyday activities rely on electricity. As we look to 2050, this dependence is set to increase, with demand for electricity in Switzerland likely to rise to 50 percent. The increased demand can only be met by transforming the energy system.

Switzerland has set itself the goal of ending its  by 2050. With this net zero target, the country hopes to play its part in limiting global warming to less than 1.5°C. The implications of this target for future  requirements—and the potential contributions of geothermal energy and hydropower in particular—have been the subject of ETH-led research at 25 Swiss scientific institutions, industrial companies and federal authorities as part of the Swiss Competence Center for Energy Research—Supply of Electricity (SCCER-SoE). Although this project initially focused on renewables as a substitute for , it ultimately took on a much broader scope. After all, the  of the future will not only need to deliver more power, but do so with negative emissions wherever possible. This requires much more comprehensive and, above all, more integrated solutions.

The electricity mix of the future

Led by the SCCER-SoE, a total of eight competence centers used scenarios to model the future composition of electricity supply and demand. The increased demand for electricity by 2050 will be largely driven by electrification in two areas: transport and heating.

To meet this rising demand and, above all, to compensate for the elimination of nuclear power plants, the supply of renewable energies will need to almost double by 2050. The greatest potential lies in photovoltaics. "However, this potential can only be utilized in full if we also take measures to offset the deficienciescompensate the fluctuations of this form of energy," says Peter Burgherr from the Paul Scherrer Institute. Photovoltaics are poorly suited to delivering sufficient power in the winter months, and they produce a surplus of energy in the middle of the day in the summer months, which can tax the power grid.
A carbon-neutral response to rising electricity demand
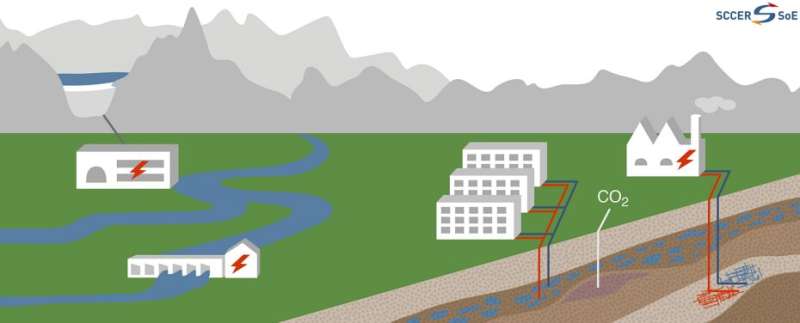
Photovoltaics, hydropower and geothermal energy, combined with pumped 
storage, CO2 capture and long-term underground storage, form the backbone 
of a climate-neutral electricity supply in 2050. Credit: SCCER-SoE

To better cope with the irregular supply of electricity, it is imperative that we also make better use of the potential offered by other renewables such as wind, hydropower, biomass and geothermal energy. Surplus energy from photovoltaic systems could be stored in batteries temporarily, used for pumped storage plants, or converted into heat or hydrogen.

This is where hydropower comes into play. As the most important domestic energy source in Switzerland, both now and in the future, it not only contributes directly to the electricity supply but is also taking on an important role as a form of energy storage. But Robert Boes, head of the Laboratory of Hydraulics, Hydrology and Glaciology and a professor at ETH Zurich, qualifies this potential: "A significant expansion of hydropower in the next few decades is unrealistic given the stringent environmental protection requirements, profitability which is low or non-existent, and poor public acceptance of such projects." Even under optimistic assumptions, that means additional electricity imports and domestic gas-fired power stations will still be required to meet demand.

In Switzerland, geothermal energy has the potential to contribute to future power generation and to provide a large proportion of the heat needed for heating purposes, hot water and certain industrial processes. And it is not only that water can be heated underground and then extracted—the subsurface can also be used to store water heated on the surface using surplus energy from photovoltaics or waste incineration plants, for example.

Not without negative emissions

As well as expanding its use of renewable energies, increasing the efficiency of existing technologies and implementing measures to minimize  consumption, Switzerland will need to achieve negative emissions if it is to meet the net zero target. For example, these negative emissions could be achieved by capturing carbon dioxide directly from ambient air (direct air capture) or by burning biomass, capturing the resulting CO2, and placing it in long-term storage underground. Current findings suggest that the options for underground storage in Switzerland are not as extensive as originally hoped, and so there is a need for further exploration—along with research into storage options abroad.

The results from the SCCER-SoE's seven years of research indicate that the net zero target is technically achievable by 2050. "However, this will require extensive and coordinated adjustments in many different areas that affect the whole of society. We can't afford to waste any more time if we want to meet the stipulated climate goals by 2050," says Domenico Giardini, professor at ETH Zurich and Head of the SCCER-SoE.
Switzerland's energy transition
Provided by ETH Zurich 

How much wildfire smoke is infiltrating our homes?

How much wildfire smoke is infiltrating our homes?
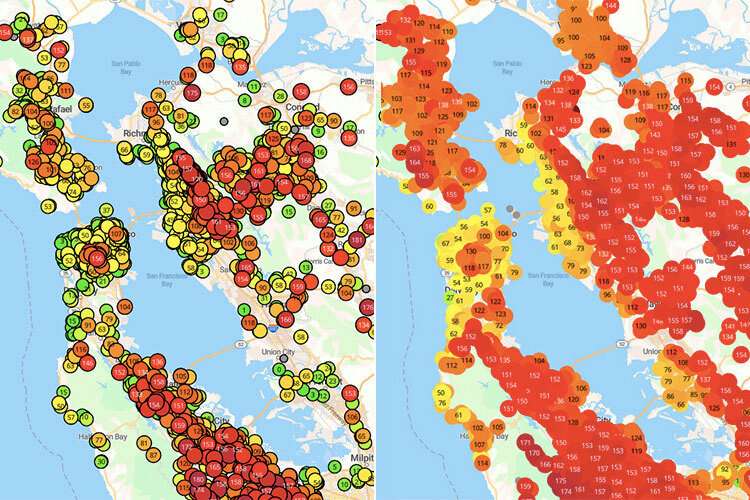
The Air Quality Index across the San Francisco Bay Area measured by crowdsourced
 PurpleAir sensors on Aug. 28, 2021, when wildfire smoke made air quality unhealthy in
 much of the region. On the whole, the AQI measured by outdoor sensors (right) was 
higher than indoor sensors (left), indicating that many residents are taking action to
 reduce smoke exposure indoors. Credit: UC Berkeley

Though overall air quality in the U.S. has improved dramatically in recent decades, smoke from catastrophic wildfires is now creating spells of extremely hazardous air pollution in the Western U.S. And, while many people have learned to reduce their exposure by staying inside, keeping windows closed and running air filtration systems on smoky days, data remains limited on how well these efforts are paying off.

In a new study, scientists from the University of California, Berkeley, used data from 1,400 indoor air sensors and even more outdoor air sensors included on the crowdsourced PurpleAir network to find out how well residents of the San Francisco and Los Angeles metropolitan areas were able to protect the air inside their homes on days when the air outside was hazardous.

They found that, by taking steps like closing up their houses and using filtration indoors, people were able to cut the infiltration of PM2.5  to their homes by half on wildfire days compared to non-wildfire days.

"While the particulate matter indoors was still three times higher on wildfire days than on non-wildfire days, it was much lower than it would be if people hadn't closed up their buildings and added filtration," said study senior author Allen Goldstein, a professor of environmental engineering and of environmental science, policy and management at UC Berkeley. "This shows that when people have information about the smoke coming their way, they are acting to protect themselves, and they are doing it effectively."

While individuals can take steps to reduce smoke infiltration to their homes, the ability for air pollution to get inside can also depend heavily on the nature of the building itself. To study these effects, the researchers also used the real estate website Zillow to estimate the characteristics of buildings in the sensor network, including the structure's relative age, the type of building and the socio-economic status of the neighborhood.

Not surprisingly, they found that newly constructed homes and those that were built with central air conditioning were significantly better at keeping wildfire smoke out.

"One of the things that makes this study exciting is it shows what you can learn with crowdsourced data that the government was never collecting before," said study co-author Joshua Apte, an assistant professor of civil and environmental engineering and of public health at UC Berkeley. "The Environmental Protection Agency (EPA) has a mandate to measure outdoor air quality and not —that's just how our air quality regulations are set up. So, these kinds of crowdsourced data sets allow us to learn about how populations are affected indoors, where they spend most of their time."

Protecting the air of the great indoors

Like many residents of the Western U.S., both Goldstein and Apte regularly use websites like AirNow and PurpleAir to check how wildfire smoke is affecting the air quality where they live. Both have even installed their own PurpleAir sensors to track the concentrations of PM2.5 particulate matter inside their homes.

So, when UC Berkeley graduate student Yutong Liang wrote a term paper using data from the PurpleAir network to study the impact of wildfire smoke on indoor air quality, Goldstein and Apte thought the work was worth expanding to a full research study.

"Our friends and neighbors and colleagues were all looking at this real-time data from PurpleAir to find out when smoke was affecting their area, and using that information to decide how to behave," Goldstein said. "We wanted to use actual data from this network to find out how effective that behavior was at protecting them."

The analysis compared indoor and outdoor sensor data collected during August and September of 2020, when both San Francisco and Los Angeles experienced a number of "fire days," which the researchers defined as days when the average PM2.5 measured by the EPA exceeded 35ug/m3. This value corresponds to an Air Quality Index (AQI) of approximately 100, which represents the boundary between PM2.5 levels that the EPA considers "moderate" and those that are considered "unhealthy for sensitive groups."

While scientists are still working to puzzle out just what types of chemical compounds are found in this particulate matter from wildfire smoke, a growing body of research now suggests that it may be even worse for human health than other types of PM2.5 air pollution.

"Wildfires create thousands of different organic chemicals as particulate matter and gases that can cause respiratory and cardiovascular problems in people," said Liang, who is lead author of the study. "The Goldstein research group is trying to identify these unique compounds, as well as the ways that they react to transform the composition of wildfire smoke over time."

To protect indoor air during fire season, the research team suggests closing up your home before smoke arrives in your area and investing in an air filtration system. If you can't afford a commercial air filter—or they are all sold out—you can also build your own for less than $50 using a box fan, a MERV-rated furnace filter and some tape.

"There are lots of very informative Twitter threads about how to build a good DIY system, and if you are willing to go a little crazy—spend $90 instead of $50—you can build an even better design," Apte said. "Every air quality researcher I know has played around with these because they are so satisfying and simple and fun, and they work."

Where you put the filters also matters. If you only have one, Apte suggests putting it in your bedroom and leaving the door closed while you sleep, to keep the air in your bedroom as clean as possible.

Finally, the researchers suggest cooking as little as possible during smoky days. Cooking can generate surprising amounts of both particulate matter and gases, neither of which can be easily ventilated out of the house without inviting wildfire smoke in.

"Air filters can help remove particulate matter from cooking, but running a kitchen or bathroom exhaust fan during smoke events can actually pull PM2.5-laden air from outdoors to indoors," Goldstein said.

In the future, the researchers hope to find ways to sample the indoor air quality of a more diverse array of households. Because PurpleAir sensors cost at least $200 apiece, households that contribute data to the network tend to be affluent, and the Zillow estimates show that the average price of homes in the network is about 20% higher than median property values in their areas.

"One thing that we're deeply interested in is understanding what happens to people in indoor environments, because that's where people spend most of their time, and there's still an awful lot we don't know about indoor pollution exposure," Apte said. "I think that these new methods of sensing the indoor environment are going to allow us to grapple a lot more with questions of environmental justice and find out more about who gets to breathe cleaner air indoors."

Why wildfire smoke is especially bad for your health
More information: Yutong Liang et al, Wildfire smoke impacts on indoor air quality assessed using crowdsourced data in California, Proceedings of the National Academy of Sciences (2021). DOI: 10.1073/pnas.2106478118
Journal information: Proceedings of the National Academy of Sciences 
Provided by University of California - Berkeley 

Parks are about promoting everyone's public health, not just boosting homeowners' property value

Public park
Credit: CC0 Public Domain

The COVID-19 pandemic put a lot of attention on the role of parks and green spaces —particularly in large cities. But, not all of this attention has been positive.

Although the pandemic has clarified the beneficial role of parks in promoting health and well-being in urban communities, it has also highlighted inequities in accessing parks and green spaces, problems with a culture of enforcement and led to a series of policy responses that were heavily criticized.

Recently, police in Halifax clashed with protesters and violently evicted people staying at Peace and Friendship Park and Spring Garden Road Library. Earlier this summer, Toronto police forcibly evicted residents living in encampments at Lamport StadiumTrinity Bellwoods Park and Alexandra Park. Under the guise of " remediation" these violent evictions were described as reasonable, firm and compassionate by Mayor John Tory despite the clashes with protesters, use of pepper spray and numerous injuries and arrests.

These actions have been repeatedly justified as a means of protecting , but activists,  and even  councilors have spoken out against the use of violence in these responses.

Although  have created a buzz, they reflect a trend in public policy that has been developing for some time and changing the way we see, use and value parks in our cities. They also highlight some of the limitations in our thinking about how parks can serve as a  resource for our communities.

Multiple visions of urban parks

The idea of parks as a public health resource was central in the early vision of parks. In the Progressive Era (1896–1916), an interest in health and hygiene motivated the development of parks so there could be clean and sanitary spaces for outdoor play in the overcrowded conditions of growing industrial towns.

However, other visions and motivations have long driven urban park development. City boosters and beautification societies invested in parks as a way to create civic landmarks and spaces of esthetic and natural beauty for residents to enjoy as leisure. Middle-class social reformers saw parks as spaces for the social improvement of the working class through organized sport and physical education. Public parks have long been valued as spaces for urban amusement and entertainment.

Our vision of urban parks —particularly in  like Toronto —is also affected by broader economic conditions, local development agendas and gentrification.

Parks advocacy groups actively promoted the health benefits of parks as a strategy to promote park investment in cities during periods of chronic underfunding. For some advocates of urban development, parks tend to be positioned as a leisure resource for homeowners and a source of property value. This is reflective of broader social trends where private wealth is valued over public goods.

The logics of park policy

Park-related policy is generally established at the municipal level. Examining policy implementation and enforcement helps us understand the motivations that guide policy development.

The events that unfolded in Trinity Bellwoods Park during the pandemic illuminate some of the gaps between the rhetoric of parks as a health-promoting resource and the realities of park use.

We see these gaps in how the City of Toronto responded to concerns related to the spread of COVID-19 in parks. It did so by revising park by-laws to mandate physical distancing. These rules were broken when thousands of people congregated in Trinity Bellwoods in May 2020.

The city then expanded its efforts with additional enforcement and signage, including painting white circles on park grass. This response was designed to enable leisurely park use, despite widely acknowledged rule-breaking (like alcohol consumption and not physical distancing).

The pandemic also created a health crisis in the city's shelter system where it became impossible to follow physical distancing rules. As a result, between 300 and 400 residents moved to city parks, with the aim of reducing their risk of becoming infected with the virus. The city responded to this health-promoting action with forced evictions.

These different responses illustrate the limited way in which we think about parks in relation to health. The responses show that we think of parks as health resources only when we define health promotion in terms of individual engagement in leisure-based health-promoting activities.

Private interest over public health

The World Health Organization suggests health is created by caring for oneself and others, by being able to make decisions and have control over one's life circumstances by ensuring that the society one lives in creates conditions that allows the attainment of health by all its members.

When we think about health in this way, we can see how parks might serve as a health resource.

Historically, Toronto engaged parks differently in times of crisis. Forest and open air schools were created in parks for children diagnosed with tuberculosis in the early 1900s. These schools saw increased use again during the Spanish Flu. At the time, people saw parks as more than just a place to exercise or socialize.

In order for parks to become health-promoting resources, cities must use a broader vision of health to guide park policy-making. This vision might consider parks not just as a place for healthy leisure-based activity, but also as a resource that can be put to use to address other significant health concerns, particularly for those most vulnerable. Future parks health policy must reimagine parks as more than a contributor to property value.

U.S. National Park Service issues mask mandate
Provided by The Conversation 
This article is republished from The Conversation under a Creative Commons license. Read the original article.The Conversation


Hurricane Ida turned into a monster thanks to a giant warm patch in the Gulf of Mexico

Hurricane Ida turned into a monster thanks to a giant warm patch in the Gulf of Mexico – here's what happened
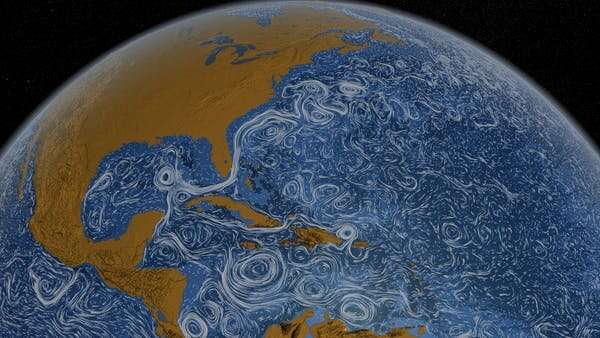
A computer animation reflects the temperature change as eddies spin off from the Loop 
Current and Gulf Stream along the U.S. Coast. Credit: NASA/Goddard Space Flight Center Scientific Visualization Studio

As Hurricane Ida headed into the Gulf of Mexico, a team of scientists was closely watching a giant, slowly swirling pool of warm water directly ahead in its path.

That warm pool, an eddy, was a warning sign. It was around 125 miles (200 kilometers) across. And it was about to give Ida the power boost that in the span of less than 24 hours would turn it from a weak  into the dangerous Category 4 storm that slammed into Louisiana just outside New Orleans on Aug. 29, 2021.

Nick Shay, an oceanographer at the University of Miami's Rosenstiel School of Marine and Atmospheric Sciences, was one of those scientists. He explains how these eddies, part of what's known as the Loop Current, help storms rapidly intensify into monster hurricanes.

How do these eddies form?

The Loop Current is a key component of a large gyre, a circular current, rotating clockwise in the North Atlantic Ocean. Its strength is related to the flow of warm  from the tropics and Caribbean Sea into the Gulf of Mexico and out again through the Florida Straits, between Florida and Cuba. From there, it forms the core of the Gulf Stream, which flows northward along the Eastern Seaboard.

In the Gulf, this current can start to shed large warm eddies when it gets north of about the latitude of Fort Myers, Florida. At any given time, there can be as many as three warm eddies in the Gulf. The problem comes when these eddies form during hurricane season. That can spell disaster for coastal communities around the Gulf.

Subtropical water has a different temperature and salinity than Gulf common water, so its eddies are easy to identify. They have warm water at the surface and temperatures of 78 degrees Fahrenheit (26 C) or more in water layers extending about 400 or 500 feet deep (about 120 to 150 meters). Since the strong salinity difference inhibits mixing and cooling of these layers, the warm eddies retain a considerable amount of .

When heat at the  is over about 78 F (26 C), hurricanes can form and intensify. The eddy that Ida passed over had surface temperatures over 86 F (30 C).

Hurricane Ida turned into a monster thanks to a giant warm patch in the Gulf of Mexico – here's what happened
The Loop Current runs from the tropics through the Caribbean and into the Gulf of Mexico, 
then joins the Gulf Stream moving up the East Coast. Credit: NASA/Goddard Space Flight Center Scientific Visualization Studio

How did you know this eddy was going to be a problem?

We monitor ocean heat content from space each day and keep an eye on the ocean dynamics, especially during the summer months. Keep in mind that warm eddies in the wintertime can also energize atmospheric frontal systems, such as the "storm of the century" that caused snowstorms across the Deep South in 1993.

To gauge the risk this heat pool posed for Hurricane Ida, we flew aircraft over the eddy and dropped measuring devices, including what are known as expendables. An expendable parachutes down to the surface and releases a probe that descends about 1,300 to 5,000 feet (400 to 1,500 meters) below the surface. It then send back data about the temperature and salinity.

This eddy had heat down to about 480 feet (around 150 meters) below the surface. Even if the storm's wind caused some mixing with cooler water at the surface, that deeper water wasn't going to mix all the way down. The eddy was going to stay warm and continue to provide heat and moisture.

That meant Ida was about to get an enormous supply of fuel.

When warm water extends deep like that, we start to see the atmospheric pressure drop. The moisture transfers, also referred to as latent heat, from the ocean to atmosphere are sustained over the warm eddies since the eddies are not significantly cooling. As this release of latent heat continues, the central pressures continue to decrease. Eventually the surface winds will feel the larger horizontal pressure changes across the storm and begin to speed up.

That's what we saw the day before Hurricane Ida made landfall. The storm was beginning to sense that really warm water in the eddy. As the pressure keeps going down, storms get stronger and more well defined.

When I went to bed at midnight that night, the wind speeds were about 105 miles per hour. When I woke up a few hours later and checked the National Hurricane Center's update, it was 145 miles per hour, and Ida had become a major hurricane.

Hurricane Ida turned into a monster thanks to a giant warm patch in the Gulf of Mexico – here's what happened
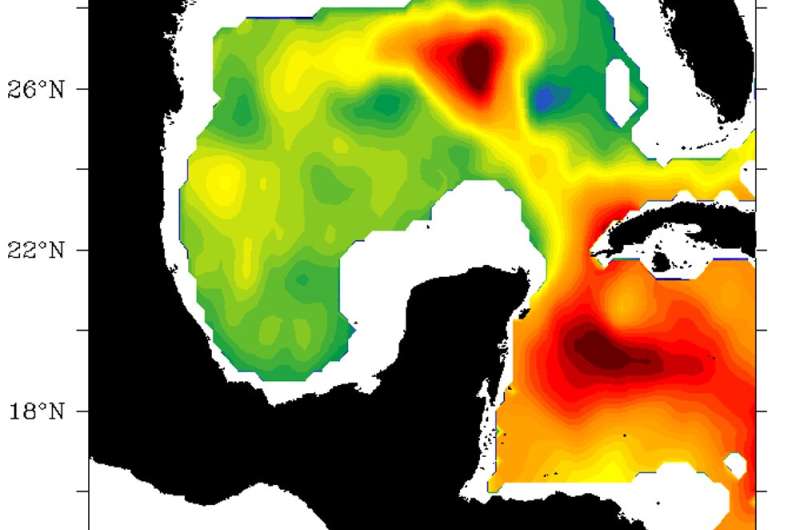
Ida’s route to Louisiana passed through very warm water. The scale, in meters, shows
 the maximum depth at which temperatures were 78 degrees Fahrenheit (26 C) or 
greater. Credit: University of Miami, CC BY-ND

Is rapid intensification a new development?

We've known about this effect on hurricanes for years, but it's taken quite a while for meteorologists to pay more attention to the upper ocean heat content and its impact on rapid intensification.

In 1995, Hurricane Opal was a minimal tropical storm meandering in the Gulf. Unknown to forecasters at the time, a big warm eddy was in the center of the Gulf, moving about as fast as Miami traffic in rush hour, with warm water down to about 150 meters. All the meteorologists saw in the satellite data was the surface temperature, so when Opal rapidly intensified on its way to eventually hitting the Florida Panhandle, it caught a lot of people by surprise.

Today, meteorologists keep a closer eye on where the pools of heat are. Not every storm has all the right conditions. Too much wind shear can tear apart a storm, but when the atmospheric conditions and ocean temperatures are extremely favorable, you can get this big change.

Hurricanes Katrina and Rita, both in 2005, had pretty much the same signature as Ida. They went over a warm eddy that was just getting ready to be shed form the Loop Current.

Hurricane Michael in 2018 didn't go over an eddy, but it went over the eddy's filament—like a tail—as it was separating from the Loop Current. Each of these storms intensified quickly before hitting land.

Of course, these warm eddies are most common right during hurricane season. You'll occasionally see this happen along the Atlantic Coast, too, but the Gulf of Mexico and the Northwest Caribbean are more contained, so when a  intensifies there, someone is going to get hit. When it intensifies close to the coast, like Ida did, it can be disastrous for coastal inhabitants.

How hurricanes draw fuel from water water. Credit: NOAA

What does climate change have to do with it?

We know global warming is occurring, and we know that surface temperatures are warming in the Gulf of Mexico and elsewhere. When it comes to rapid intensification, however, my view is that a lot of these thermodynamics are local. How great a role  plays remains unclear.

This is an area of fertile research. We have been monitoring the Gulf's ocean heat content for more than two decades. By comparing the temperature measurements we took during Ida and other hurricanes with satellite and other atmospheric data, scientists can better understand the role the oceans play in the rapid intensification of storms.

Once we have these profiles, scientists can fine-tune the computer model simulations used in forecasts to provide more detailed and accurate warnings in the futures.

Study targets warm water rings that fuel hurricane intensification in the Caribbean Sea
Provided by The Conversation 
This article is republished from The Conversation under a Creative Commons license. Read the original article.The Conversation

 ANOTHER SOURCE FOR CONSPIRACY THEORIES

Odds of asteroid Bennu hitting Earth put into perspective

Statisticians put odds of asteroid Bennu hitting Earth into perspective
A mosaic image of the asteroid Bennu made by a NASA spacecraft, which was in 
close proximity of the asteroid for more than two years. 
Credit: NASA/Goddard/University of Arizona

Even Harry Stamper would probably like these odds.

Recently NASA updated its forecast of the chances that the asteroid Bennu, one of the two most hazardous known objects in our solar system, will hit Earth in the next 300 years. New calculations put the odds at 1 in 1,750, a figure slightly higher than previously thought.

The , which has been tracking the building-sized rock since it was discovered in 1999, revised its prediction based on new tracking data.

Even with the small shift in odds, it seems likely we won't face the kind of scenario featured that in the 1998 science-fiction disaster film "Armageddon" when Stamper, played by Bruce Willis, and his team had to try to blow up a huge asteroid that was on an extinction-making collision course with the Earth.

(In an unrelated development, NASA plans to launch a mission in November to see whether a spacecraft could hit a sizeable space rock and change its trajectory just in case it ever needs to.)

This raises the question of just how good should we feel about our odds. We put that question to Lucas B. Janson and Morgane Austern, both assistant professors of statistics.

They compared Bennu's chances of hitting Earth to the approximate likelihood of:

  • Flipping a coin and having the first 11 attempts all land heads.
  • Any four random people sharing a birthday in the same month (the odds of this are 1 in 1,750 exactly).
  • Throwing a dart at a dartboard with your eyes closed and hitting a bullseye.
  • Winning the state's VaxMillions lottery on two separate days if every eligible adult resident is entered and a new drawing is held every second.

Bottom line? Janson, an affiliate in , says that if he were a betting man, he would put his money on our being just fine. Then again, he points out, if he is wrong, "Paying up would be the least of my worries."

Only slight chance of asteroid Bennu hitting Earth: NASA
Provided by Harvard University 
This story is published courtesy of the Harvard Gazette, Harvard University's official newspaper. For additional university news, visit Harvard.edu.

Student-designed experiment to measure Earth's magnetic field arrives at Space Station

ESA - Oscar the Qube
Credit: Oscar-Qube–J. Gorissen

Oscar-Qube, short for Optical Sensors based on CARbon materials: QUantum Belgium, is an experiment developed by a group of students from the University of Hasselt, Belgium. Part of ESA Education Office's Orbit Your Thesis! program, the experiment arrived at the International Space Station on Space X Dragon CR23 resupply mission yesterday.

This week, ESA astronaut Thomas Pesquet will install the experiment in the Ice Cubes Facility that offers commercial and educational access to the microgravity environment of the Space Station.

Oscar-Qube's mission is to create a detailed map of Earth's . It makes use of a new type of magnetometer that exploits diamond-based quantum sensing, meaning that it is highly sensitive, offers measurements to the nano scale, and has a better than 100-nanosecond response time.

These features combine to create a powerful experiment that, once in position, will allow it to map the Earth's magnetic field to an unrivaled level of precision.

Oscar-Qube is designed and built exclusively by the first student team to test a diamond-based  sensing device in space. They will go on to manage operations during its 10-month stay onboard the International Space Station.

ICE Cubes space research service open for business
Provided by European Space Agency 

Satellites measure drought stress in plants with aim of increasing crop yields

Increasing crop yields: Satellites measure drought stress in plants
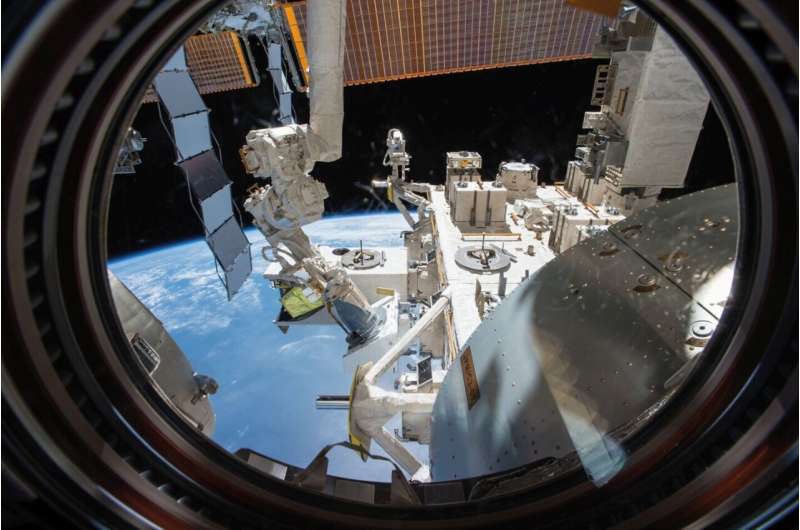
The sensor system to observe areas of the Earth will be installed aboard the International 
Space Station (ISS). Credit: NASA

With a satellite system that measures drought stress in plants, two researchers from the Fraunhofer Institute for High-Speed Dynamics, Ernst-Mach-Institut, EMI, have now founded the spin-off ConstellR. Their technology enables the agricultural sector to optimize the irrigation of areas under cultivation to increase crop yields. The first sensor system will be launched into space in early 2022 and be installed on board the International Space Station (ISS).

The global population is growing—and demand for food is growing along with it. Since arable land is limited, farmers will need to harvest more from the same area in the future, meaning that cultivation will have to be improved, too. One important lever is an ideal supply of water—because when plants respond to drought stress, they invest less energy into their fruits, thereby reducing the harvest. One major problem is the difficulty of measuring the condition of plants on the vast arable land that spans the world. Although  has been used since the 1970s to provide a general overview, it remains relatively inaccurate. To date, scientists have primarily used visual and near-infrared sensors that detect the plant pigment chlorophyll which breaks down when plants are not watered enough. "But by then, it's already too late," says Max Gulde, a physicist at the Fraunhofer Institute for High-Speed Dynamics, Ernst-Mach-Institut, EMI, in Freiburg. "What we need is a technology that tells us within the space of a few hours whether plants have sufficient access to water."

Algorithms determine the temperature on the leaf's surface

Max Gulde and his colleague Marius Bierdel at Fraunhofer EMI have taken on the task of developing precisely this type of technology. Satellite technology is applied here too, with the research team using an advanced thermal imaging camera in the satellite. Special algorithms evaluate the data to determine the temperature on the surface of the plants' leaves, which enables researchers to draw conclusions on the water supply. When there is a water shortage, less water is evaporated through the leaves. This increases the temperature on the leaf's surface. "Within the space of two hours, the temperature can change by two to three degrees Celsius," explains Max Gulde. "Our method can measure temperature differences very precisely, to within a tenth of a degree." In technical terms, the sensor measures the amount of energy emitted by the plants in the form of photons.

One challenge that arose during the development stage was how to factor out interfering heat emitted by the atmosphere, the Earth's surface or from the satellite itself. This heat distorts the temperature data obtained from the leaf's surface. Thanks to their algorithms, the EMI researchers also succeeded in overcoming this challenge. And it was the European Space Agency (ESA), no less, that confirmed how well the system works: "We weren't sure about our approach until the ESA informed us that this was a real breakthrough. Before us, no one had been able to solve the problem of temperature measurement in such a compact system," emphasizes Max Gulde. The data is downloaded from the satellites to ground stations, processed in data centers, prepared for the user and finally transferred to the agricultural users' app.

Increasing crop yields: Satellites measure drought stress in plants
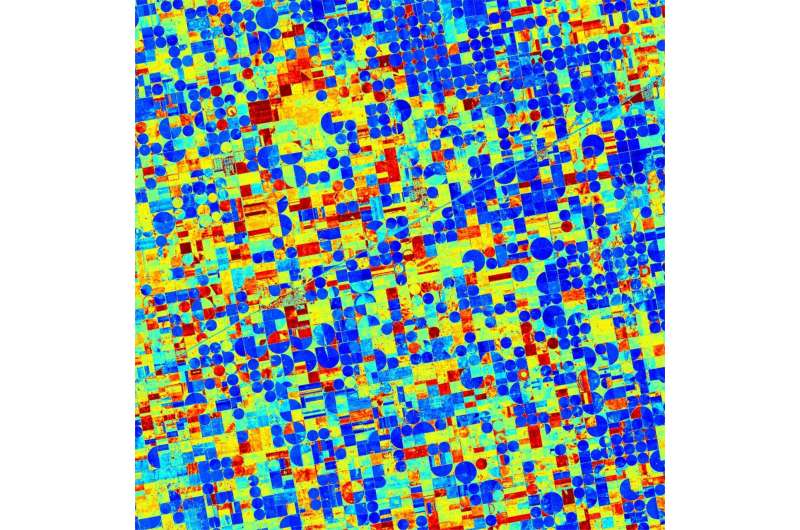
Agricultural areas, viewed from the satellite with the thermal imaging camera. In the example analysis, red represents high temperatures and impending water shortages. Credit: ConstellR

Optimal irrigation in close to real time

The technology's key advantage is that data and information about the water supplied to plants is available after just a few hours. As a result, farmers can adjust their irrigation levels practically in real time to specifically water those fields or plants that are most affected. Moreover, pinpoint precise irrigation systems help to save water and enable more accurate crop forecasts. This means that prices for agricultural products can be calculated accordingly at an early stage because farmers can predict how badly a drought could damage their crops many weeks in advance. "This provides agricultural producers with significantly increased planning security," clarifies Gulde.

The new technology is scheduled to go into operation in space aboard the International Space Station as early as the beginning of 2022. "I am very pleased that Fraunhofer EMI's first spin-off will use the technologies developed at the institute to help optimize the irrigation of fields and  as well as the yield of crops worldwide. This improves food security for people around the world and represents significant progress, especially in times of climate change," enthuses Professor Frank Schäfer, Head of the Systems Solutions department at the institute.

The path to ConstellR

Gulde and Bierdel founded the company ConstellR to further develop and commercialize the technology. Since 2015, the two scientists have been involved in research on the ERNST nanosatellite mission, which uses a compact thermal imaging camera. They came up with the idea of equipping their own satellites with high-resolution spatial thermal imaging cameras for temperature measurement in 2017. At the time, the task for young researchers was to design the smallest satellite with the greatest benefit for society as part of the European Copernicus Masters competition. The EMI researchers were accepted into a startup program—known as an accelerator—with their idea. "It was thanks to our involvement in that program that we learned all the basics of entrepreneurship," describes Max Gulde. But it was only a grant of 1.8 million euros from the German Federal Ministry for Economic Affairs and Energy—ten percent of which was awarded by Fraunhofer EMI—that enabled them to develop the  and found ConstellR.

The two experts will leave the Fraunhofer-Gesellschaft at the end of 2022 to devote themselves fully to their development company. Their research has already resulted in three patents.


Firms employing many scientists and engineers are riskier for investors

stock market
Credit: CC0 Public Domain

A highly skilled workforce of scientists and engineers may boost companies' performance but makes them a riskier investment on the stock market, research shows.

This was because firms with high numbers of scientists and engineers are more inflexible, as they are expensive to employ but too important to sack, the British Academy of Management online annual conference heard today.

Three researchers from Leeds University Business School analyzed data from 1997 to 2018 on 14,786 firms in 16 countries, including the UK, that were listed on the  market.

Dr. Chieh Lin, Professor Steven Toms and Professor Iain Clacher looked at the wage share—the percentage of the total wage bill—spent on staff working in science, technology, engineers or mathematics, known as STEM workers, in 269 industries, such as transport, manufacturing and education.

They found that in those industries where companies spent more of their wage bill on STEM workers, the  value of firms was more volatile.

Firms' "Beta measure" grew in industries where more STEM workers were employed. Beta is a measure of a stock's volatility in relation to the overall market, where a stock that swings more than the market over time has a beta of more than 1.0.

On average, an extra 20% of wage bill spent on STEM workers was linked to an increase in beta by between 9% and 17%.

Also, firms' profits became more sensitive to changes in their sales income as the firm relied more heavily on STEM workers. Because of this uncertainty, investors in the firms demanded a higher return.

STEM workers cost more but are often too important to lay off, making firms unresponsive to downturns. An average STEM  earns $91,000, compared with $47,000 for non-STEM staff. STEM workers account for around 13% of total workforce and 23% of total wages and salaries in the US.

"STEM workers are at the center of the global competition for talent due to their ability to leverage advanced technology both effectively and productively," Dr. Lin told the conference.

"While the contribution of STEM workers to high value-added activities such as R&D and innovation, and therefore growth, is typically emphasized, limited attention has been paid to the risk that a STEM-intensive workforce may entail for individual firms.

"We argue that reliance on STEM workers reduces the operating flexibility of firms by increasing the degree of fixity in labor costs, and therefore total operating costs.

"The operating leverage thus created increases the volatility of cash flow as it becomes more exposed to systematic risk. The risk associated with the employment of STEM workers must be balanced against their contribution to innovation and growth.

"Investment in STEM workers amplifies both the downside risk and upside potential of firms, but with the former effect being more dominant.

"The stocks of STEM worker-intensive firms are riskier due to higher exposure to systematic risk. Investors demand a high return on stocks of STEM worker-intensive firms to compensate for a higher exposure to systematic risk."

Dr. Lin said that while stocks of STEM-intensive  are risky investments in general, exceptions such as Amazon and other tech giants were possible given their robust business models.

The researchers controlled for the effects of several factors such as firm size, indebtedness and growth, in order to study the effect of STEM employment in isolation.

Low wages not education to blame for skills gap
Provided by British Academy of Management