Sunday, October 24, 2021

Canada should limit use of forceps in childbirth to prevent lifelong injuries to women: Study


Education about the risks needed for both clinicians and mothers, say University of Alberta experts on incontinence

Peer-Reviewed Publication

UNIVERSITY OF ALBERTA FACULTY OF MEDICINE & DENTISTRY

Canada has an alarmingly high rate of forceps use during childbirth and a correspondingly high number of preventable injuries to mothers, according to recently published research from an international team of incontinence experts. 

The researchers call for a reduction in the number of births by forceps in Canada and better education for both clinicians and mothers on how to avoid injury when forceps are required. 

“Often women who have had this type of delivery are completely shell-shocked because they’ve got infection, they’ve got pain, they’ve got a newborn and they had no idea that this was even a possibility,” said co-principal investigator Jane Schulz, professor and chair of obstetrics and gynecology in the Faculty of Medicine & Dentistry.

“Education is needed for both patients and health providers that this is a potential complication,” said Schulz, who is also a urogynecologist with the pelvic floor clinic at the Lois Hole Hospital for Women and the Alberta Women’s Health Foundation Chair in Women’s Health Research.

The injuries can lead to immediate or long-term complications including poor healing, infection, chronic pain, sexual dysfunction, bladder or bowel incontinence and pelvic organ prolapse. 

“These birth injuries sometimes result in conditions which are extremely troublesome in later life,” said co-principal investigator Adrian Wagg, division director of geriatric medicine and scientific director for the AHS Seniors’ Health Strategic Clinical Network.

“This is a call to action for Canadian providers in terms of quality improvement,” said Wagg, who is also Alberta Health Services Endowed Professor of Healthy Ageing and professor of continence sciences at the University of Gothenburg.

The researchers analyzed nearly two million birth records from Canada, Norway, Sweden and Austria, focusing on women who were giving birth for the first time or had a vaginal birth after caesarean section (VBAC). 

Overall, five per cent of the women had third or fourth degree tears to the perineum — the area between the vagina and the anus. Canada and Sweden had the highest rates of injury, and Austria and Norway the lowest.

The injuries were associated with the use of instruments — either a vacuum or forceps — during delivery. About one in four pregnancies was delivered using instruments in both Canada and Norway in 2016, but the researchers found that Canadian women had a much higher rate of injury: 24.3 per cent of the Canadian mothers with forceps deliveries were injured, compared with 6.2 per cent in Norway. 

“We’re not doing well compared to other countries that were chosen based on similar social demographics and health-care services,” Schulz said.

Schulz explained that the forceps can cause either mechanical or neurological trauma to the pelvic floor of the mother. 

“They are kind of like large sugar tongs. You put them on the baby’s head and pull the baby out,” she said. “The blades go around the baby’s head and can potentially tear muscles and ligaments of the pelvic floor or cause damage to the nerves that supply the pelvic floor.”

Norway introduced a perineal protection program in 2004 that has led to a sharp decline in injuries. Physicians, midwives and nurses are taught techniques to prevent perineal damage, such as how to slow down the second stage of delivery when the infant’s head is crowning, how to avoid pushing during crowning and when to perform an episiotomy (a surgical cut to the perineum to prevent tearing). 

“They also have education around how to recognize an injury, repair it, make sure antibiotics are given and then follow up to ensure it has healed,” said Schulz.

Schulz noted that some women are at higher risk of injury during childbirth due to factors such as having a larger baby or a shorter perineum. 

Schulz and Wagg said they intend to work with obstetrical health providers, potentially through groups such as the Society of Obstetricians and Gynaecologists of Canada, to improve education for clinicians and provide better information for new mothers.

“Obstetrical care providers go through a checklist of things at prenatal visits including nutrition, genetic screening options, vaccinations and routine prenatal testing, but this is often something that is not discussed, so patients are unaware,” said Schulz.

“I advocate for women to be fully informed about their options in childbirth and counsel women to avoid forceps if at all possible,” said Wagg. “Caesarean section is the fallback option, although of course we know there are other concerns about the health of the infant (such as immune changes), so it’s important to discuss beforehand.”

In an earlier study, Schulz reported on how the perineal clinic in Edmonton, started in 2011, helps women injured in childbirth. Patients are seen within six weeks of delivery so they can be assessed and treated by a team of physicians, nurses and physiotherapists. A team of researchers and clinicians with diverse specialties including geriatrics, obstetrics and gynecology, and urology continues to look for ways to enhance care for patients with pelvic floor problems. 

Both Wagg and Schulz are members of the Women and Children’s Research Health Institute. The study was funded by the Gothenburg Continence Research Centre, of which Wagg is co-director. 

Wagg noted that one in four Canadian women over the age of 65 has a bladder problem and a quarter of them inaccurately believe it’s normal to be incontinent just because they are getting older — which may prevent them from seeking medical help for what may be the result of an injury. 

“We see this as a real opportunity to improve the quality of care for Canadian women,” he said.

###


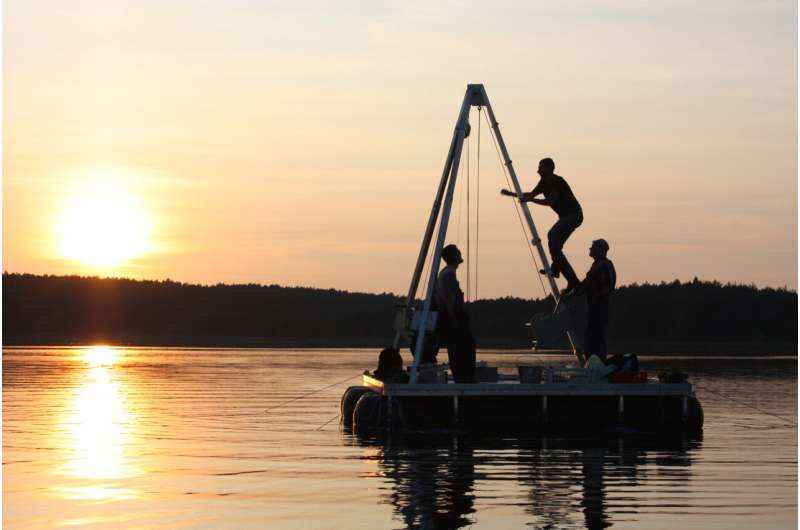
Traces of an ancient road in a lake

Traces of an ancient road in a lake
From a raft the team uses a hollow cylinder to punch through the lake bottom thus getting 
sediments with layers. The layers are called warves and preserve traces from historic
 developments and landscape changes, e.g. pollen or ashes. Credit: Achim Brauer/GFZ

Anyone traveling from the German city of Brandenburg via Berlin to Frankfurt an der Oder at the Polish-German border does so along an ancient route that reaches far into Poland. German and Polish researchers have now documented the influence of this East-West connection on the history of the landscape by examining the sediments of Lake Czechowskie in the Bory Tucholskie and also evaluating historical sources. According to the results, three phases of landscape development can be distinguished in the last eight hundred years: from an almost untouched landscape through an intermediate phase lasting several centuries—characterized by alternations between strong settlement activity and the return of nature after wars—to today's cultural landscape.

One of the two main authors, Achim Brauer of the GFZ German Research Centre for Geosciences in Potsdam, says: "Wars had a clear influence, as the Via Marchionis was repeatedly used for troop transports that led to local destruction and devastation. In this study, for the first time, we have shown the impact on the landscape for every war in the region's history. In general, wars have led to greater or lesser devastation ('renaturalization') of the landscape, which has also lasted for varying lengths of time."

At other times, it was political developments that left their mark on the landscape, such as an agrarian reform in 1343, which led, with a certain time lag, to an accelerated "anthropogenization" of the landscape, that is, to clearly visible human influence. In the sediments of Lake Czechowskie this is shown by a strong increase of rye pollen and the decrease of birch and pine pollen.

Because sediments in a lake exhibit annual stratification similar to tree rings, the German-Polish team was able to pinpoint the year from which pollen originated by counting the individual layers ("warves") down to a resolution of five years. According to this, the  remained largely untouched by humans until about 1350 AD. Extensive forests and natural grasses dominated. Then followed five turbulent centuries. The expansion of agriculture and the formation of larger towns were favored by a warm climate and politically calm times. However, between 1409 and 1435 there was war between the Teutonic Order and Poland—fields became fallow land, forests expanded again. After peace was concluded, five quiet decades followed again, during which an increase in handicrafts was also evident. Hardwood was cut to obtain building material and potash—thus, birch pollen disappeared from lake sediments, rye again increased massively.

Traces of an ancient road in a lake
Sediments from the bottom of lakes are often layered. The individual layers, called warves, preserve information from the past and can be "read" like tree rings. By identifying pollen or ashes, landscape evolution, climate and even political events can be traced. Credit: Achim Brauer/GFZ

Huge army campaigns with thousands of riders and foot soldiers, plague epidemics in several waves and some very cold years with crop failures are also documented. Then, from the middle of the 19th century, the influence of agriculture, settlements and economic activity took over to such an extent that one can speak of a predominantly human influence, which continues to this day.

First author Michał Słowiński says that "the most important result is that this development did not take place uniformly. Rather, we see an alternation of phases of rapid development and significant regressions. The reasons for this are complex interactions of socio-economic, political and climatic factors."

Researchers see need for action on forest fire risk

More information: Michał Słowiński et al, The role of Medieval road operation on cultural landscape transformation, Scientific Reports (2021). DOI: 10.1038/s41598-021-00090-3

Journal information: Scientific Reports 

Provided by Helmholtz Association of German Research Centres 

The climate project that changed how we understand extreme weather

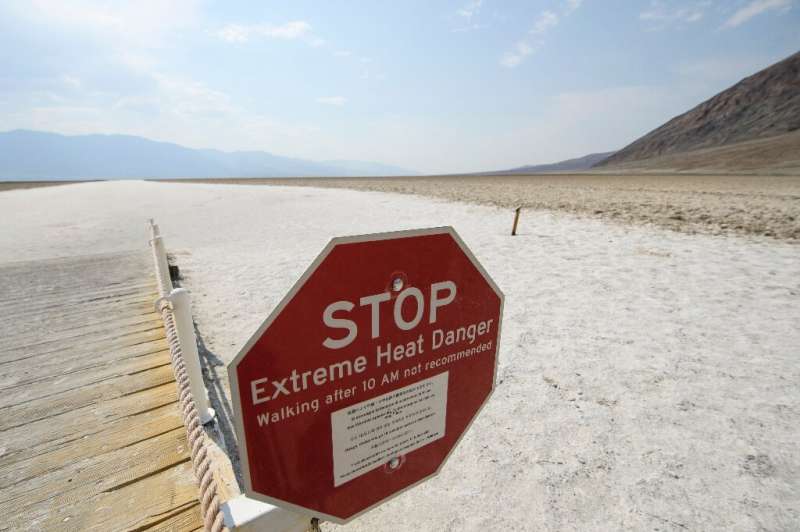
The heatwave in the US and Canada this year would have been 'virtually impossible' without climate change
The heatwave in the US and Canada this year would have been 'virtually impossible' 
without climate change.

When a handful of scientists tried to publish rapid research into the role of climate change in record rainfall that lashed Britain in 2015, they were told their high-speed approach was "not science".

Fast forward to 2021.

As extreme heat scorched North America, the same scientists from the World Weather Attribution (WWA) group concluded that the record-shattering temperatures would have been "virtually impossible" without human-caused .

This time people paid attention.

The finding made headlines worldwide and news stories replaced vague references to the impact of global heating on  with precise details.

And that was exactly the idea of WWA, a network of scientists who wanted to shift understanding of how climate change impacts the real world.

"We wanted to change the conversation, but we never expected that it would be so successful," said climatologist Friederike Otto, who conceived WWA with Dutch scientist Geert Jan van Oldenborgh in 2014.

In September, Otto and van Oldenborgh, who worked for the Royal Dutch Meteorological Institute (KNMI), were among Time magazine's 100 most influential people of 2021.

Their work "means that people reading about our accelerating string of disasters increasingly get the most important information of all: it's coming from us", Time said.

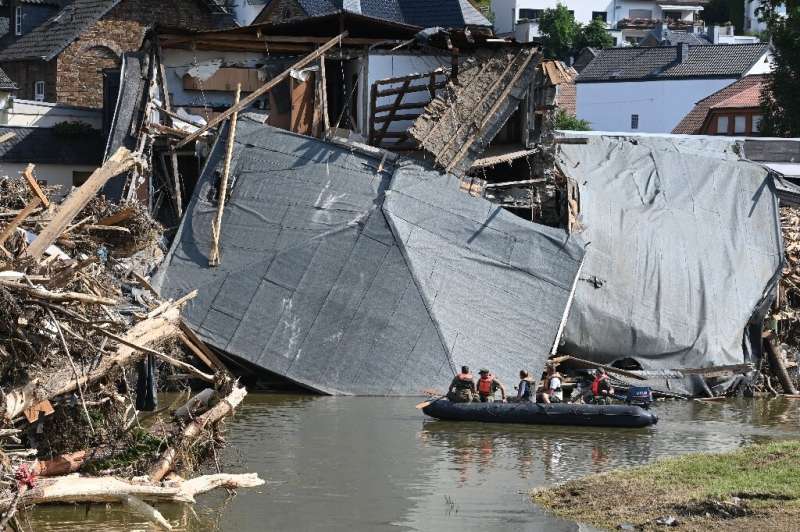
The team found that climate change made heavy rain more intense and flooding more likely in Western Europe in July
The team found that climate change made heavy rain more intense and flooding more likely in Western Europe in July.

Before he died from cancer last week, van Oldenborgh responded with characteristic modesty.

"We never aimed to be influential, just give scientifically defensible answers to questions how climate change influences extreme weather," he tweeted.

Otto said van Oldenborgh, who would have been 60 on Friday, had a "very strong moral compass" to do science for the good of society, particularly for those most vulnerable to climate change.

"I would be really hard pressed to think of anyone of his generation who has done more, and more important, science," said Otto, a lead author in the UN's Intergovernmental Panel on Climate Change.

"But he was so laid back and did not have an inflated ego that I don't think many people recognise this."

Frustration

The WWA's revolutionary approach allows scientists for the first time to specifically link an individual weather event to manmade warming.

The beginnings of extreme weather attribution can be traced back to 2004, when a British study in the journal Nature found that the punishing European heatwave the previous year was made more likely by climate change.

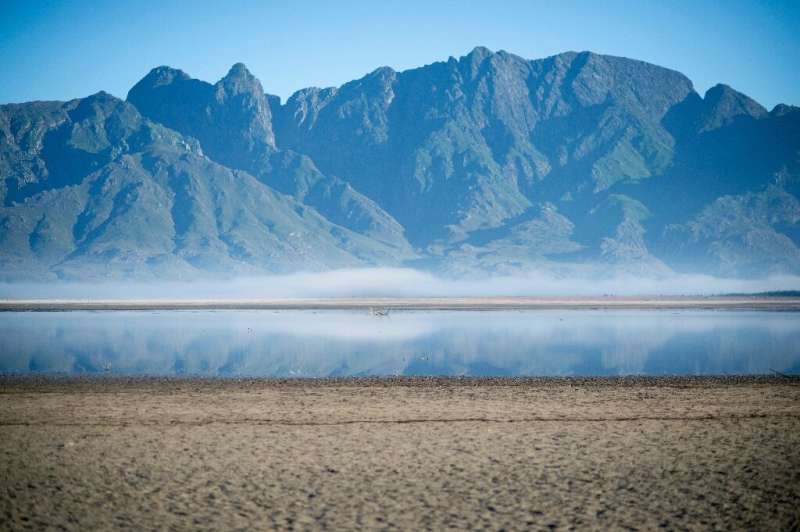
In 2018, WWA found that Cape Town water crisis was made three times more likely because of global heating
In 2018, WWA found that Cape Town water crisis was made three times more likely because of global heating.

But by the time this type of research passed peer review for publication, it was often months after the event.

So when confronted with an  wave or ferocious storm, scientists and the media were reluctant to blame it specifically on human-caused heating.

It was "very frustrating", said Otto.

In one of their earliest studies, the WWA team looked at record rainfall in Britain from Storm Desmond in 2015 and found climate change aggravated the flood hazard.

But their subsequent paper submitted to a scientific journal was rejected.

"There were lots of people in the scientific community saying 'this is too fast. This is not science,'," she said.

A few years later they revisited the research and were able to publish it with the same numbers.

Off the scale

To investigate whether climate change plays a role in an event, WWA compares possible weather today—after about 1.2 degrees Celsius of global warming since the mid-1800s—with a simulated climate without that heating.

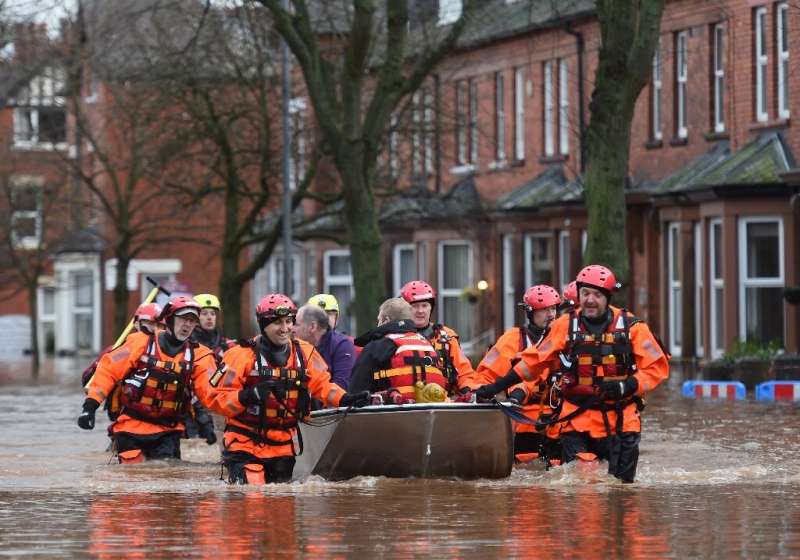
Rain from Storm Desmond in 2015 flooded thousands of homes in northern England
Rain from Storm Desmond in 2015 flooded thousands of homes in northern England.

They also work with local experts to assess exposure and vulnerability and decisions on the ground, like evacuation orders.

The Red Cross was an early partner, as was the US-based science organisation Climate Central, which provided some funding.

WWA has now published peer-reviewed methods and showed that rapid attribution can be an "operational activity" said Robert Vautard, also an IPCC lead author and director of France's Pierre-Simon Laplace Institute.

"You don't publish a paper each time you do a weather forecast," he told AFP.

But when it came to a heatwave in western Canada and the northwestern US in June, temperatures went "off the scale", he added.

The Canadian village of Lytton was almost completely destroyed by fire days after it set the national temperature record of 49.6C.

WWA concluded that in today's , it was a once-in-a-thousand-year event.

There are lingering questions, such as whether some new effect made the heatwave so extreme.

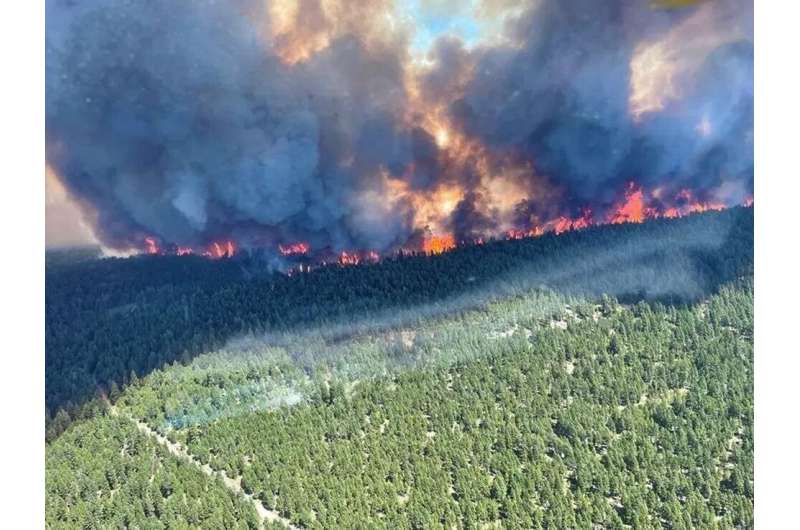
Intense heat and drought sparked dozens of wildfires
Intense heat and drought sparked dozens of wildfires.

"Crossing a tipping point, if you like," said Sarah Kew, who oversaw the research with fellow KNMI scientist Sjoukje Philip.

At the time, van Oldenborgh said the heatwave was something "nobody thought possible".

He continued to work even from his hospital bed, Kew said. He wanted to pass on his knowledge.

With extreme events accelerating, WWA scientists insist they will continue the work.

"Everyone knows that we have a big gap now," said Philip.

"But everyone is also willing to try to fill this gap together."

Dutch climate scientist Geert Jan van Oldenborgh dies at 59
Journal information: Nature 
© 2021 AFP

DNA shows Japanese wolf closest relative of domestic dogs

DNA shows Japanese wolf closest relative of domestic dogs
Stuffed specimen of Honshu wolf (Japanese Wolf, Canis hodophilax). Exhibit in the 
National Museum of Nature and Science, Tokyo, Japan. 
Credit: Momotarou2012/Wikimedia Commons, CC BY-SA 3.0

A team of researchers affiliated with several entities in Japan has found evidence that the Japanese wolf is the closest known relative of domestic dogs. The team has published a paper describing their genetic analysis of the extinct wolf and its relationship with modern dogs.

The Japanese  is a subspecies of the gray wolf and once lived on many of the islands of what is now Japan. The  was declared extinct in 1905 after hunters and landowners killed them off, but many tissue and bone samples were preserved. In this new effort, the researchers extracted DNA from tissue in bone samples from several museums in Japan.

By comparing the DNA of the Japanese wolf with the DNA of other  and  and species such as foxes, the researchers found that it resides on a unique evolutionary branch of wolves—one that arose sometime between 20,000 and 40,000 years ago. They also noted that some of those ancient wolves evolved into Japanese wolves and others evolved into dogs.

Prior research has shown that modern domestic dogs evolved from a type of gray wolf that does not exist today. This new work suggests that scientists are getting closer to learning more about that unique wolf. The new DNA evidence suggests that it lived in East Asia (not the Middle East or Europe as has been widely suggested) and its wolf line migrated later to Japan. It is still unclear, however, what happened to the line that evolved into dogs. The DNA also showed that there was some interbreeding between the wolf line and the dog line. A prior study has shown that approximately 2% of the DNA from a sled dog that died 10,000 years ago was from the Japanese wolf. The researchers suggest such interbreeding appears to have occurred prior to the Japanese wolf making its way to Japan; thus, it does not appear likely that dogs made their way there until much later. They also note that New Guinea singing dogs and dingoes have the highest amount of Japanese wolf DNA of any modern species, suggesting the wolf migrated great distances.Our bond with dogs may go back more than 27,000 years

More information: Jun Gojobori et al, The Japanese wolf is most closely related to modern dogs and its ancestral genome has been widely inherited by dogs throughout East Eurasia, biorxiv (2021). DOI: 10.1101/2021.10.10.463851

© 2021 Science X Network

The impact of coastal hardening on local ecosystems

The impact of coastal hardening on local ecosystems
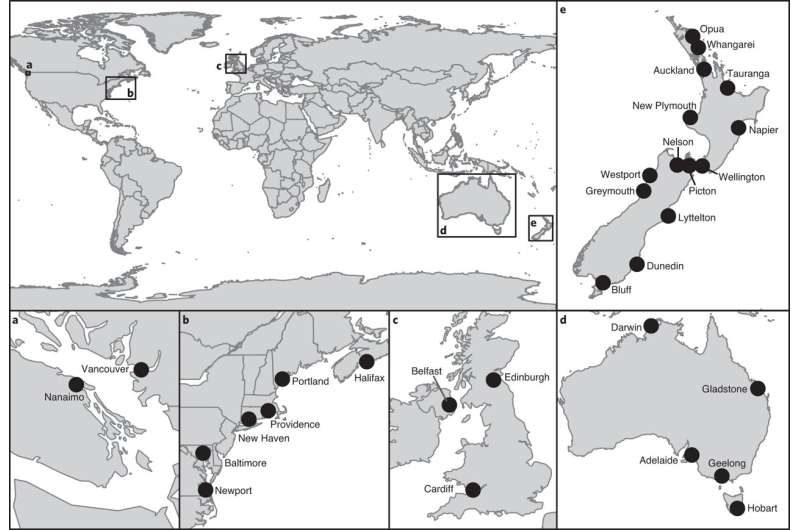
Fig. 1: Costal hardening extent determined for 30 global urban centers. a–e, Insets provide
 details on centers examined around North America (a, b), the United Kingdom (c), Australia 
(d) and New Zealand (e). Maps are from ArcGIS Living Atlas of the World.
 Credit: DOI: 10.1038/s41893-021-00780-w

A team of researchers affiliated with several institutions in New Zealand and Australia has created a model to forecast coastal hardening around the world in the coming years. In their paper published in the journal Nature Sustainability, the group describes collecting and analyzing satellite data to build their model.

Coastal hardening happens when humans build structures on or near the edges of the ocean. What were once marshes, for example, could be replaced by hotels and casinos. In this new effort, the researchers looked at the extent of coastal hardening, its impact on local ecosystems and where it is likely to happen in the near future.

As the researchers note, when natural soft coastline is replaced with hard materials, the geography becomes simpler, which leads to changes in the ecological community that can favor invasive species. Putting up seawalls or similar structures reduces the number of creatures that can live around them, the researchers note, pointing out that the decrease in diversity has been well documented for many  around the world located close to the ocean, such as New York. Prior research has shown that there are common factors that lead to coastal hardening, such as tourism or shipping. Cities that serve as shipping hubs are also much more sensitive to invasive species becoming entrenched.

To learn more about the extent of coastal hardening, the researchers obtained and scrutinized satellite maps for 30 cities around the world. They found that more than half of the coastline in these areas has been hardened. They then gathered shipping, demographic and  for the same cities and used it to create an AI model that could predict hardening of coastal areas in the future.

The model can be used to study likely coastal hardening for specific regions over a specified number of years. They used it to learn more about likely increases in coastal hardening in New Zealand over the next 25 years, as an example—the model showed 243 to 368 kilometers of shoreline near urban areas experiencing new coastal hardening.

New meta-analysis shows engineered hard shorelines are a threat to ecosystems
More information: Oliver Floerl et al, A global model to forecast coastal hardening and mitigate associated socioecological risks, Nature Sustainability (2021). DOI: 10.1038/s41893-021-00780-w
Journal information: Nature Sustainability 
© 2021 Science X Network

Study says tech firms underreport their carbon footprint

carbon footprint
Credit: CC0 Public Domain

Large technology companies such as SAP, IBM and Google are underreporting their greenhouse gas emissions at a time of heightened scrutiny over the role of corporations in driving climate change, a study released Friday claimed.

Research published in the journal Nature Communications found inconsistencies in the way companies declare their carbon footprint, a measure that is increasingly considered important for investors.

The study, conducted by researchers at the Technical University of Munich, examined so-called scope 3 emissions that account for a large share of corporate carbon footprints, such as business travel, employee commuting and how companies' products are used.

Focusing on 56 companies in the , they found that on average these failed to disclose about half of their emissions.

Christian Stoll, one of the report's authors, said some companies—such as Google's parent Alphabet—were found to have been consistent in how they reported their carbon footprint, but excluded some emissions that should have been counted.

Others, such as IBM, had reported their  differently depending on the audience and excluded emissions that should have been included.

Neither Google nor IBM immediately responded to requests for comment.

The authors suggested ways in which companies can improve their emissions reporting.

Laura Draucker, senior manager of corporate  at nonprofit business research firm Ceres, said she agreed with the Nature paper's conclusion that companies' emissions disclosure needs to improve.

"However, we cannot wait for perfect data," said Draucker, who wasn't involved in the study. "Companies can use estimates and screening tools to identify hot spots for climate risk along their , and they can set goals and take actions now to meet those goals—while at the same time, working to improve  and quality."

Ceres' own research showed many of the largest U.S companies lack ambitious climate goals, she added.Data suggests oil giants are not looking very hard to find ways to reduce their carbon footprint

Journal information: Nature Communications 

Data suggests oil giants are not looking very hard to find ways to reduce their carbon footprint

Data suggests oil giants are not looking very hard to find ways to reduce their carbon footprint
Schematic representation of how assessed product is calculated based on different 
categories of energy product and their relationship with the value chain.
 Credit: DOI: 10.1126/science.abh0687

A small team of environmentalists from the London School of Economics and the Political Science Organization for Economic Co-operation and Development has published a Policy Forum piece in the journal Science highlighting the lack of effort by the world's largest oil and gas companies to reduce their carbon footprint. In their paper, the authors claim that of 52 companies they looked at, just two of them have established science-based climate targets.

One of the biggest contributors of greenhouse gas emissions is the gasoline-burning vehicle. Cars and trucks the world over spew billions of tons of carbon into the atmosphere every day. And most of that gasoline is provided by oil and gas giants such as BP and Exxon Mobil. In recent years, these companies have been pushed by consumers and government alike to come up with plans to reduce their carbon footprints by reducing the amount of carbon-based product they sell to consumers. In this new effort, the authors suggest that the oil and gas giants have not responded to pressure as might be expected, and instead appear to be mostly turning a deaf ear.

To learn more about how the big oil and gas companies have been responding to calls for a response to global warming issues, the authors obtained and analyzed data from 52 of the largest companies looking for evidence of a response. They found that just two of the companies had made any public announcements regarding plans to help reduce emissions to meet the goals of the Paris Climate Accord. Occidental Petroleum announced it had plans to help reduce emissions to meet the 1.5 degree Celsius benchmark, and Royal Dutch Shell announced it had plans to help prevent reaching the 2 degree Celsius limit.

The authors also looked at emission intensities, the CO2 emissions from operations and use by customers, noting that only 23 of the companies listed numbers for customer use, which is, of course, the biggest contributor to emissions. They also looked at future  intensity projections for all of the companies and found that just over half had released estimates. Those that did list them had unambitious goals, say the authors.

Overall, the authors found that the vast majority of large oil and  are doing little to assist the effort to reduce , which in the end could be their undoing. As the world moves to alternative fuel sources, these giants could find themselves without customers.

US energy laggards still not Paris compliant: analysis

More information: Simon Dietz et al, How ambitious are oil and gas companies' climate goals? Science (2021). DOI: 10.1126/science.abh0687

Journal information: Science 

© 2021 Science X Network

Historical analysis finds no precedent for the rate of coal and gas power decline needed to limit climate change to 1.5°C


Peer-Reviewed Publication

CELL PRESS

Limiting climate change to the 1.5°C target set by the Paris Climate Agreement will likely require coal and gas power use to decline at rates that are unprecedented for any large country, an analysis of decadal episodes of fossil fuel decline in 105 countries between 1960 and 2018 shows. Furthermore, the findings, published October 22 in the journal One Earth, suggest that the most rapid historical cases of fossil fuel decline occurred when oil was replaced by coal, gas, or nuclear power in response to energy security threats of the 1970s and the 1980s. 

Decarbonizing the energy sector is a particularly important strategy for reaching the goal of net-zero greenhouse gas emissions by 2050, which is necessary in order to prevent global average temperatures from climbing beyond 1.5°C this century. However, few studies have investigated the historical precedent for such a sudden and sweeping transition—especially the decline of carbon-intensive technologies that must accompany the widespread adoption of greener ones.

“This is the first study that systematically analyzed historical cases of decline in fossil fuel use in individual countries over the last 60 years and around the world,” says Jessica Jewell (@jessicadjewell), an associate professor in energy transitions at Chalmers University in Sweden, a professor at the University of Bergen in Norway, and the corresponding author of the study. “Prior studies sometimes looked at the world as a whole but failed to find such cases, because on the global level the use of fossil fuels has always grown over time.”

“We also studied recent political pledges to completely phase out coal power, which some 30 countries made as part of the Powering Past Coal Alliance. We found that these pledges do not aim for faster coal decline than what has occurred historically,” adds Jewell. “In other words, they plan for largely business as usual.”

To explore whether any periods of historical fossil fuel decline are similar to scenarios needed to achieve the Paris target, Jewell and her colleagues, Vadim Vinichenko, a post-doctoral researcher at Chalmers and Aleh Cherp, a professor at Central European University in Austria and Lund University in Sweden, identified 147 episodes within a sample of 105 countries between 1960 and 2018 in which coal, oil, or natural gas use declined faster than 5% over a decade. Rapid decline in fossil fuel use has been historically limited to small countries, such as Denmark, but such cases are less relevant to climate scenarios, where decline should take place in continental-size regions.

Jewell and colleagues focused the investigation on cases with fast rates of fossil fuel decline in larger countries, which indicate significant technological shifts or policy efforts, and controlled for the size of the energy sector, the growth in electricity demand, and the type of energy with which the declining fossil fuel was substituted. They compared these cases of historical fossil fuel decline to climate mitigation scenarios using a tool called “feasibility space,” which identifies combinations of conditions that make a climate action feasible in particular contexts.

“We were surprised to find that the use of some fossil fuels, particularly oil, actually declined quite rapidly in the 1970s and the 1980s in Western Europe and other industrialized countries like Japan,” says Jewell. “This is not the time period that is typically associated with energy transitions, but we came to believe that some important lessons can be drawn from there.” Rapid decline of fossils historically required advances in competing technologies, strong motivation to change energy systems (such as to avoid energy security threats), and effective government institutions to implement the required changes.

“We were less surprised, but still somewhat impressed, by how fast the use of coal must decline in the future to reach climate targets,” she adds, noting that, of all the fossil fuels, coal would need to decline the most rapidly to meet climate targets, particularly in Asia and the OECD regions where coal use is concentrated.

About one-half of the IPCC 1.5°C-compatible scenarios envision coal decline in Asia faster than in any of these cases. The remaining scenarios, as well as many scenarios for coal and gas decline in other regions, only have precedents where oil was replaced by coal, gas or nuclear power in response to energy security threats in smaller electricity markets. Achieving the 1.5°C target requires finding mechanisms of fossil fuel decline that extend far beyond historical experience or current pledges.

The authors found that nearly all scenarios for the decline of coal in Asia in line with Paris Agreement’s goals would be historically unprecedented or have rare precedents. Over half of scenarios envisioned for coal decline in OECD countries and over half of scenarios for cutting gas use in reforming economies, the Middle East, or Africa would also be unprecedented or have rare precedents as well.

“This signals both an enormous challenge of seeing through such rapid decline of fossil fuels and the need to learn from historical lessons when rapid declines were achieved on the national scale,” says Jewell.

###

This work was supported by the Research Council of Norway under the Analyzing Past and Future Energy Industry Contractions: Towards a Better Understanding of the Flip-Side of Energy Transitions project and by the European Union’s Horizon 2020 research and innovation program.

One Earth, Vinichenko et al.: “Historical precedents and feasibility of rapid coal and gas decline required for the 1.5°C target” https://www.cell.com/one-earth/fulltext/S2590-3322(21)00534-0

One Earth (@OneEarth_CP), published by Cell Press, is a monthly journal that features papers from the fields of natural, social, and applied sciences. One Earth is the home for high-quality research that seeks to understand and address today’s environmental Grand Challenges, publishing across the spectrum of environmental change and sustainability science. A sister journal to CellChem, and JouleOne Earth aspires to break down barriers between disciplines and stimulate the cross-pollination of ideas with a platform that unites communities, fosters dialogue, and encourages transformative research. Visit http://www.cell.com/one-earth. To receive Cell Press media alerts, contact press@cell.com.

When and why did human brains decrease in size 3,000 years ago? Ants may hold clues

brain
Credit: Pixabay/CC0 Public Domain

The brain is the most complex organ in the human body. Now, a new study has brought us closer to understanding some of its evolution. It shows that human brains decreased in size approximately 3,000 years ago. By studying ants as models to illustrate why brains may increase or decrease in size, the researchers hypothesize that brain shrinkage parallels the expansion of collective intelligence in human societies.

Studying and understanding the causes and consequences of brain  helps us understand the nature of humanity. It is well documented that  have increased in size over the course of our evolutionary history. Less appreciated is the fact that human brains have decreased in size since the Pleistocene. When exactly these changes happened, or why, was not well known.

"A surprising fact about humans today is that our brains are smaller compared to the brains of our Pleistocene ancestors. Why our brains have reduced in size has been a big mystery for anthropologists," explained co-author Dr. Jeremy DeSilva, from Dartmouth College.

To disentangle this mystery, a team of researchers from different academic fields set out to study the historical patterns of human brain evolution, comparing their findings with what is known in ant societies to offer broad insights.

"A biological anthropologist and a behavioral ecologist and evolutionary neurobiologist began sharing their thoughts on brain evolution and found bridging research on humans and ants might help identify what is possible in nature," said co-author Dr. James Traniello, from Boston University.

Their paper, published in Frontiers in Ecology and Evolution, sheds new light on the evolution of our brain.

A recent size decrease

The researchers applied a change-point analysis to a dataset of 985 fossil and modern human crania. They found that human brains increased in size 2.1 million years ago and 1.5 million years ago, during the Pleistocene, but decreased in size around 3,000 years ago (Holocene), which is more recent than previous estimates.

"Most people are aware that humans have unusually large brains—significantly larger than predicted from our body size. In our deep evolutionary history, human brain size dramatically increased," said Traniello. "The reduction in human brain size 3,000 years ago was unexpected."

The timing of size increase coincides with what is previously known about the early evolution of Homo and the technical advancements that led to; for example, better diet and nutrition and larger social groups.

As for the decrease in brain size, the interdisciplinary team of researchers propose a new hypothesis, finding clues within ant societies.

What could ants teach us about human brain evolution?

"We propose that ants can provide diverse models to understand why brains may increase or decrease in size due to social life. Understanding why brains increase or decrease is difficult to study using only fossils," explained Traniello.

Studying computational models and patterns of worker ant brain size, structure, and energy use in some ant clades, such as the Oecophylla weaver ant, Atta leafcutter ants, or the common garden ant Formica, showed that group-level cognition and division of labor may select for adaptive brain size variation. This means that within a social group where knowledge is shared or individuals are specialists at certain tasks, brains may adapt to become more efficient, such as decreasing in size.

"Ant and human societies are very different and have taken different routes in social evolution," Traniello said. "Nevertheless,  also share with humans important aspects of social life such as group decision-making and division of labor, as well as the production of their own food (agriculture). These similarities can broadly inform us of the factors that may influence changes in human brain size."

Brains use up a lot of energy, and smaller brains use less energy. The externalization of knowledge in , thus needing less energy to store a lot of information as individuals, may have favored a decrease in  size.

"We propose that this decrease was due to increased reliance on collective intelligence, the idea that a group of people is smarter than the smartest person in the group, often called the 'wisdom of the crowds,'" added Traniello.

DeSilva concluded, "We look forward to having our hypothesis tested as additional data become available."Climate changed the size of our bodies and, to some extent, our brains

More information: Jeremy DeSilva et al, When and Why Did Human Brains Decrease in Size? A New Change-Point Analysis and Insights from Brain Evolution in Ants, Frontiers in Ecology and Evolution (2021). DOI: 10.3389/fevo.2021.742639

Journal information: Frontiers in Ecology and Evolution 

Provided by Frontiers