Wednesday, November 03, 2021

Autonomous robotic rover helps scientists with long-term monitoring of deep-sea carbon cycle and climate change


Peer-Reviewed Publication

MONTEREY BAY AQUARIUM RESEARCH INSTITUTE

MBARI's Benthic Rover II 

IMAGE: MBARI'S BENTHIC ROVER II TRAVELS ACROSS THE MUDDY SEAFLOOR, TAKING PHOTOGRAPHS AND MEASURING HOW MUCH OXYGEN BOTTOM-DWELLING ANIMALS AND MICROBES ARE USING OVER TIME. THE INFORMATION GATHERED BY THIS AUTONOMOUS ROVER HAS HELPED SCIENTISTS UNDERSTAND HOW CARBON CYCLES FROM THE SURFACE TO THE SEAFLOOR. view more 

CREDIT: © 2016 MBARI

The sheer expanse of the deep sea and the technological challenges of working in an extreme environment make these depths difficult to access and study. Scientists know more about the surface of the moon than the deep seafloor. MBARI is leveraging advancements in robotic technologies to address this disparity.

An autonomous robotic rover, Benthic Rover II, has provided new insight into life on the abyssal seafloor, 4,000 meters (13,100 feet) beneath the surface of the ocean. A study published today in Science Robotics details the development and proven long-term operation of this rover. This innovative mobile laboratory has further revealed the role of the deep sea in cycling carbon. The data collected by this rover are fundamental to understanding the impacts of climate change on the ocean.

“The success of this abyssal rover now permits long-term monitoring of the coupling between the water column and seafloor. Understanding these connected processes is critical to predicting the health and productivity of our planet engulfed in a changing climate,” said MBARI Senior Scientist Ken Smith.

Despite its distance from the sunlit shallows, the deep seafloor is connected to the waters above and is vital for carbon cycling and sequestration. Bits of organic matter—including dead plants and animals, mucus, and excreted waste—slowly sink through the water column to the seafloor. The community of animals and microbes on and in the mud digests some of this carbon while the rest might get locked in deep-sea sediments for up to thousands of years.

The deep sea plays an important role in Earth’s carbon cycle and climate, yet we still know little about processes happening thousands of meters below the surface. Engineering obstacles like extreme pressure and the corrosive nature of seawater make it difficult to send equipment to the abyssal seafloor to study and monitor the ebb and flow of carbon.

In the past, Smith and other scientists relied on stationary instruments to study carbon consumption by deep seafloor communities. They could only deploy these instruments for a few days at a time. By building on 25 years of engineering innovation, MBARI has developed a long-term solution for monitoring the abyssal seafloor.

“Exciting events in the deep sea generally occur both briefly and at unpredictable intervals, that’s why having continuous monitoring with Benthic Rover II is so crucial,” explained Electrical Engineering Group Lead Alana Sherman. “If you’re not watching all the time, you’re likely to miss the main action.”

Benthic Rover II is the result of the hard work of a collaborative team of MBARI engineers and scientists, led by Smith and Sherman. 

Engineers at MBARI designed Benthic Rover II to handle the cold, corrosive, and high-pressure conditions of the deep sea. Constructed from corrosion-resistant titanium, plastic, and pressure-resistant syntactic foam, this rover can withstand deployments up to 6,000 meters (about 19,700 feet) deep.

“In addition to the physical challenges of operating in these extreme conditions, we also had to design a computer control system and software reliable enough to run for a year without crashing—nobody is there to press a reset button,” explained MBARI Electrical Engineer Paul McGill. “The electronics also have to consume very little power so that we can carry enough batteries to last for a year. Despite all it does, the rover consumes an average of only two watts—about the same as an iPhone.”

Benthic Rover II is about the size of a small car—2.6 meters (8.5 feet) long, 1.7 meters (5.6 feet) wide, and 1.5 meters (4.9 feet) high—and treads gently over the muddy bottom on a pair of wide, rubber tracks.

Researchers deploy Benthic Rover II from MBARI’s vessel, the R/V Western Flyer. The ships’ crew gingerly lowers the rover into the water and releases it to free-fall to the ocean floor. It takes the rover about two hours to reach the bottom. Once it lands on the seafloor, the rover can begin its mission.

First, sensors check the currents flowing along the seafloor. When they detect favorable currents, the rover moves up or across the current to reach an undisturbed site to begin collecting data.

Cameras on the front of the rover photograph the seafloor and measure fluorescence. This distinctive glow of chlorophyll under blue light reveals how much “fresh” phytoplankton and other plant debris has landed on the seafloor. Sensors log the temperature and oxygen concentration of the waters just above the bottom.

Next, the rover lowers a pair of transparent respirometer chambers that measure the oxygen consumption of the community of life in the mud for 48 hours. As animals and microbes digest organic matter, they use oxygen and release carbon dioxide in a specific ratio. Knowing how much oxygen those animals and microbes use is crucial for understanding carbon remineralization—the breakdown of organic matter into simpler components, including carbon dioxide.

After 48 hours, the rover raises the respirometer chambers and moves 10 meters (32 feet) forward, careful not to cross its previous path, and selects another site to sample. It repeats this sampling pattern over and over for the duration of deployment, typically a full year.

At the end of each deployment, the R/V Western Flyer returns to recover the rover, download its data, swap out its battery, and return it to the deep seafloor for another year. Within each year-long deployment, the MBARI team launches another autonomous robot—the Wave Glider—from shore to return quarterly to check on Benthic Rover II’s progress. “The rover can’t communicate with us directly to tell us its location or condition, so we send a robot to find our robot,” explained McGill. An acoustic transmitter on the Wave Glider pings the rover on the seafloor below. The rover then sends status updates and sample data to the glider overhead. The glider then transmits that information to researchers on shore via satellite. 

“Data from the Benthic Rover II have helped us quantify when, how much, and what sources of carbon might be sequestered, or stored, in the abyssal seafloor,” said MBARI Senior Research Specialist Crissy Huffard. 

For the past seven years, Benthic Rover II has been continuously operational at Station M, an MBARI research site located 225 kilometers (140 miles) off the coast of central California. Station M lies 4,000 meters (13,100 feet) below the ocean’s surface—as deep as the average depth of the ocean—making it a good model system for studying abyssal ecosystems.

Over the past 32 years, Smith and his team have constructed a unique underwater observatory at Station M. Benthic Rover II and a suite of other instruments operate there 24 hours a day, seven days a week, for a full year without servicing. 

“The rover’s reliable performance over seven years, spending 99 percent of its life on the seafloor, is a result of many years of testing, troubleshooting, and developing the best techniques to maintain the vehicle,” said Sherman. “It’s a great example of what’s possible when applying technology to challenging problems in science.”

Data collected at Station M show that the deep sea is far from static. Physical, chemical, and biological conditions can change dramatically over timescales ranging from hours to decades.

The surface waters of the California Current over Station M teem with phytoplankton in the spring and summer. These seasonal pulses in productivity cascade from the water column to the seafloor. Much of this sinking organic matter—known as “marine snow”—originated as carbon dioxide in the atmosphere.

Over the past decade, MBARI researchers have observed a dramatic increase in large pulses of marine snow falling to the seafloor at Station M. These episodic events account for an increasing fraction of the yearly food supply at this site. In seven years of operation at Station M, Benthic Rover II recorded significant weekly, seasonal, annual, and episodic events—all providing data that help MBARI researchers understand the deep-sea carbon cycle.

Between November 2015 and November 2020, Benthic Rover II recorded a substantial increase in the rain of dead phytoplankton and other plant-rich debris (phytodetritus) landing on the abyssal seafloor from the waters overhead. A decrease in the concentration of dissolved oxygen in the waters just above the deep seafloor accompanied this windfall of organic matter.

Traditional short-term monitoring tools would not have detected the fluctuations that drive long-term changes and trends. Benthic Rover II has revealed a more complete picture of how carbon moves from the surface to the seafloor.

“Benthic Rover II has alerted us to important short- and long-term changes in the deep sea that are being missed in global models,” underscored Huffard.

The success of Benthic Rover II and MBARI’s ongoing work at Station M highlight how persistent platforms and long-term observations can further our understanding of the largest living space on Earth. With more companies looking to extract mineral resources from the deep seafloor, these data also give valuable insights into the baseline conditions in areas under consideration for industrial development or deep-sea mining.

The ocean is also a crucial component in Earth’s carbon cycle and climate. The ocean and its biological communities are a sink for carbon dioxide. Burning fossil fuels, raising livestock, and clearing forests release billions of tons of carbon dioxide into our atmosphere every year. The ocean has buffered us from the worst impacts by absorbing more than 25 percent of this excess carbon dioxide. Facing a changing climate, understanding how carbon flows between the ocean’s sunlit surface and its dark depths is more important than ever.


About MBARI

MBARI (Monterey Bay Aquarium Research Institute) is a private non-profit oceanographic research center, founded by David Packard in 1987 focused on developing innovative technologies for exploring and understanding the ocean. The mission of MBARI is to advance marine science and technology to understand a changing ocean.

For additional information or images relating to this release, please email pressroom@mbari.org.

Mapping annual wildfire probabilities across California

Statistical modeling highlights predictive importance of local climate and human activity

Peer-Reviewed Publication

PLOS

Active flame front of the Zaca Fire 

IMAGE: ACTIVE FLAME FRONT OF THE ZACA FIRE, THE SECOND LARGEST FIRE ON RECORD IN CALIFORNIA. U.S. FOREST SERVICE. view more 

CREDIT: JOHN NEWMAN, WIKIMEDIA, CC0 (HTTPS://CREATIVECOMMONS.ORG/PUBLICDOMAIN/ZERO/1.0/)

Researchers have uncovered new insights into the dynamics that underlie the probabilities of wildfire across the state of California. Isaac Park of the University of California, Santa Barbara, and colleagues present their method and findings in the open-access journal PLOS ONE on November 3, 2021.

Recent wildfires in California and nearby states have demonstrated the need to better understand the dynamics that determine where and when wildfires occur. However, the factors and conditions that interact to contribute to the probability of wildfire—such as the interplay between local vegetation, precipitation, human land use, and more—are diverse and complex, and they vary between locations and over time.

To improve understanding of those relationships, Park and colleagues used a statistical approach known as generalized additive modeling to explore and map annual wildfire probabilities throughout California from 1970 to 2016. This work built on previous research that employed the same technique for longer time scales. In this case, the researchers tailored the method for annual probabilities by incorporating relevant information on local climate variation, human activity, and the amount of time since the previous fire event for each location and year—all at a geographic scale of 1 kilometer.

This analysis uncovered several new insights into wildfire probabilities in California. For instance, the researchers found, both local climate and human activity—such as the dryness of fuel available to burn and housing density—play key roles in determining wildfire probabilities throughout the state. For example, portions of the Southern California mountains such as the Angeles and Los Padres National Forests were at high risk, having plenty of vegetation and therefore fuel availability as well as being close to and at risk from ignitions starting in high-density housing in the Los Angeles metropolitan area.

In addition, in certain environments, the amount of time since the last fire has an important influence; as do short-term climate variations involving extreme conditions, especially in fire-prone shrublands and forests in southern California.

The researchers also showed that their broad-scale, state-wide approach for predicting wildfire probabilities outperformed statistical models developed for certain localized regions. The researchers suggest that this work—and further refinements to their modeling method—could prove valuable for a variety of research and practical applications in such areas as wildfire emissions and hazard mapping for implementation of fire-resistant building codes.

The authors add: “This study presents a powerful tool for mapping the probability of wildfire across the state of California under a variety of historical climate regimes. By leveraging machine learning methods, it demonstrates the distinct ways in which local climate, human development, and prior fire history each contribute to the yearly risk of wildfire over space and time.”

1,000 years of glacial ice reveal ‘prosperity and peril’ in Europe

Evidence preserved in glaciers provides continuous climate and vegetation records during major historical events

Peer-Reviewed Publication

AMERICAN GEOPHYSICAL UNION

Research base camp at Colle Gnifetti 

IMAGE: RESEARCHERS’ ICE CORE DRILLING CAMP ON COLLE GNIFETTI IN 2015. TWO ICE CORES EXTRACTED FROM THIS AREA PRESERVED A CONTINUOUS ONE-THOUSAND-YEAR RECORD OF EUROPEAN CLIMATE AND VEGETATION. view more 

CREDIT: MARGIT SCHWIKOWSKI

This press release and accompanying multimedia are available online at:
https://news.agu.org/press-release/1000-years-of-glacial-ice-reveal-prosperity-and-peril-in-europe/

AGU press contact:
Liza Lester, +1 (202) 777-7494, news@agu.org (UTC-4 hours)

Contact information for the researchers:
Sandra Brugger, Desert Research Institute, sandra.brugger@dri.edu (UTC-7 hours)

WASHINGTON—Europe’s past prosperity and failure, driven by climate changes, has been revealed using thousand-year-old pollen, spores and charcoal particles fossilized in glacial ice. This first analysis of microfossils preserved in European glaciers unveils earlier-than-expected evidence of air pollution and the roots of modern invasive species problems.

new study analyzed pollen, spores, charcoal and other pollutants frozen in the Colle Gnifetti glacier on the Swiss and Italian border. The research found changes in the composition of these microfossils corresponded closely with known major events in climate, such as the Little Ice Age and well-established volcanic eruptions.

The work was published in Geophysical Research Letters, which publishes high-impact, short-format reports with immediate implications spanning all Earth and space sciences.

The industrialization of European society also appeared clearly in the microfossil record and, in some cases, showed up sooner than expected. Pollen from the introduction of non-native crops was found to go back at least 100 years ago and pollution from the burning of fossil fuels shows up in the 18th century, about 100 years earlier than expected.

Existing historical sources such as church records or diaries record conditions during major events like droughts or famines. However, studying data from the glaciers contributes to the understanding of climate and land use surrounding such events, providing non-stop context for them with evidence from a large land area. Precisely identifying the timing of these events can help scientists better understand current climate change.

“The historical sources that were available before, I don’t think [the sources] got the full picture of the environmental context,” said Sandra Brugger, a paleoecologist at the Desert Research Institute in Nevada and lead researcher on the study. “But also, with the ice core, we couldn’t get the full picture until we started collaborating with historians on this. It needs those two sides of the coin.”

Evidence on high

The new study analyzed microfossils frozen in two 82- and 75-meter-long ice cores pulled from the Colle Gnifetti glacier, which are the first two ice cores from the continent of Europe studied for microfossils. Similar studies have sampled ice cores in South America, Central Asia and Greenland, but those regions lack the breadth of written historical records that can be directly correlated with the continuous microfossil data in ice cores.

Over the centuries, wind, rain and snow carried microfossils from European lowlands, the United Kingdom and North Africa to the exposed glacier. Ice in this glacier site dates back tens of thousands of years, and the altitude of Colle Gnifetti — 4,450 meters above sea level — means the ice was likely never subjected to melting, which would mix the layers of samples and create uncertainty in the chronology of the record.

“They can actually pinpoint and identify the relationships between what’s happening on the continent with climatic records inherent in the ice,” said John Birks, a paleoecologist at the University of Bergen who was not associated with the study. “They can develop, in a stronger way, this link between human civilization and change and climate, particularly in the last thousand years or so where conventional pollen analysis is rather weak.” 

Evidence of pollution due to fossil fuel combustion also appeared earlier in the chronological record than expected. The researchers found evidence of the early burning of coal in the United Kingdom around 1780, much earlier than the expected onset of industrialization around 1850, which could have implications for global climate change modeling.

The records also showed evidence of pollen from non-native European plants from 100 years ago, showing a long legacy of the existing ecological problems created by invasive species transported across continents through trade.

###

AGU (www.agu.org) supports 130,000 enthusiasts to experts worldwide in Earth and space sciences. Through broad and inclusive partnerships, we advance discovery and solution science that accelerate knowledge and create solutions that are ethical, unbiased and respectful of communities and their values. Our programs include serving as a scholarly publisher, convening virtual and in-person events and providing career support. We live our values in everything we do, such as our net zero energy renovated building in Washington, D.C. and our Ethics and Equity Center, which fosters a diverse and inclusive geoscience community to ensure responsible conduct.


Notes for Journalists:
This research study is published with open access and is freely available. Download a PDF copy of the paper here. Neither the paper nor this press release is under embargo.

Paper title:
“Alpine Glacier Reveals Ecosystem Impacts of Europe's Prosperity and Peril Over the Last Millennium”

Authors:

  • Sandra Brugger (corresponding author), Division of Hydrologic Sciences, Desert Research Institute, Reno, NV, USA
  • M. SchwikowskiE. GobetC. Schwörer, C. RohrM. SiglC. PfisterT. M. JenkW. Tinner, Oeschger Centre for Climate Change Research, University of Bern, Bern, Switzerland
  • S. Henne, Swiss Federal Laboratories for Materials Science and Technology, Dübendorf, Switzerland
  • P. D. Henne, U.S. Geological Survey, Geosciences and Environmental Change Science Center, Denver, CO, USA

Rare boomerang collection from South Australia reveals a diverse past

Rare boomerang collection from South Australia reveals a diverse past
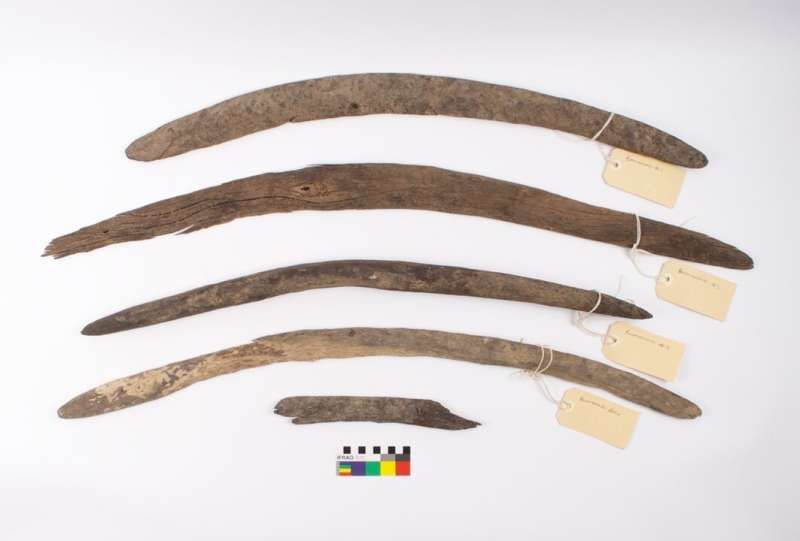
Rare boomerang collection from Cooper Creek (Kinipapa) near Innamincka in South
 Australia's far north-east. Credit: Yandruwandha Yawarrawarrka Traditional Land Owners
 Aboriginal Corporation

New research has analyzed a rare collection of non-returning boomerangs from Kinipapa (Cooper Creek), near Innamincka in South Australia's far northeast.

The four boomerangs and one wooden fragment were discovered in the creek bed during  in 2017 and 2018 by Jason Litherland from National Parks and Wildlife South Australia and Katheryn Litherland, a traditional owner.

The project to analyze the artifacts was a collaborative venture initiated by the Yandruwandha Yawarrawarrka Traditional Landowners (Aboriginal Corporation).

They partnered with Australian Heritage Services, Flinders University and the Australian Nuclear Science and Technology Organisation to carefully document the objects and to conduct radiocarbon dating to determine their ages.

The results of radiocarbon dating revealed that the boomerangs range in age from circa 1650–1830 AD, a time that spans the two centuries leading up to European incursions into the region by explorers such as Sturt, Burke, and Wills.

Rare boomerang collection from South Australia reveals a diverse past
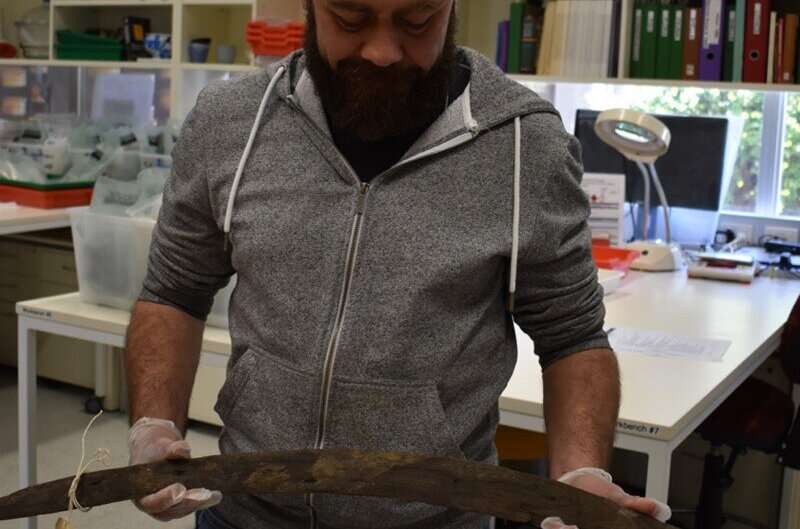
Documenting the boomerangs to conduct radiocarbon dating to determine their ages. 
Credit: Yandruwandha Yawarrawarrka Traditional Land Owners Aboriginal Corporation

"The assemblage reveals a variety of form and function representative of the diverse cultural activities and daily lives of the Aboriginal people who lived near significant waterholes in the Cooper Creek region during this period," said Professor Amy Roberts of Flinders University.

The authors concluded that in addition to their likely use as projectiles, the boomerangs were probably used for fighting, hunting, digging, fire management and possibly in ceremonies.

Rare boomerang collection from South Australia reveals a diverse past
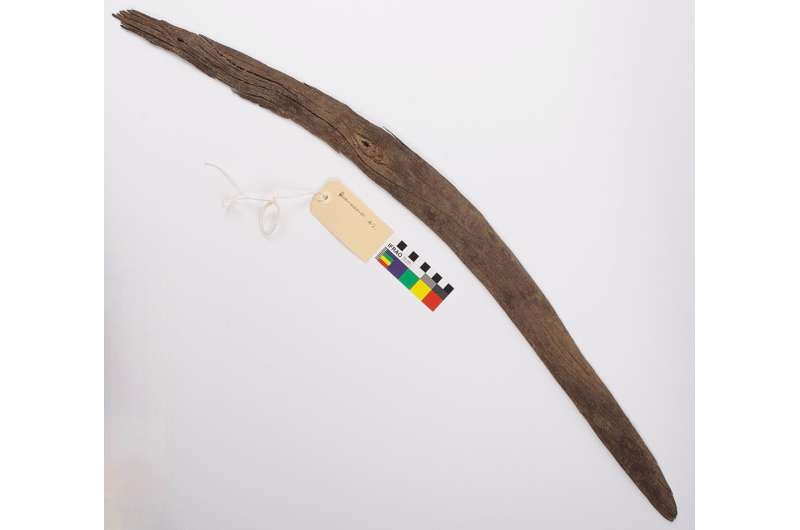
Credit: Yandruwandha Yawarrawarrka Traditional Landowners Aboriginal Corporation

"This range of activities goes well beyond the stereotype of the returning  known to most Australians," said co-author Dr. Daryl Wesley from Flinders University.

"For Yandruwandha and Yawarrawarrka people, the finds provide another example of how their Country continues to tell the stories of their ancestors, as well as affording a tangible connection to the knowledge passed down from their families," said Joshua Haynes, a Yandruwandha Yawarrawarrka traditional owner and co-author.

"We will continue to protect and preserve our artifacts on Country, that's what our ancestors would want us to do. When you see them old people in whirly winds you know they are here watching and protecting our Country," said Katheryn Litherland, a Yandruwandha Yawarrawarrka traditional owner and co-author.

Rare boomerang collection from South Australia reveals a diverse past
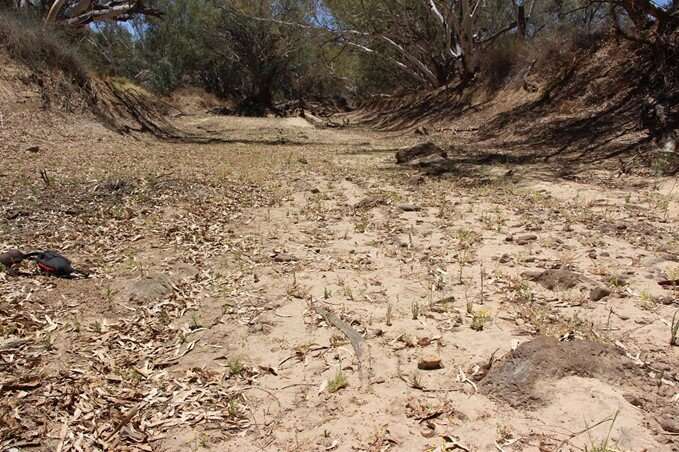
The four boomerangs and one wooden fragment were discovered in the creek bed during drought conditions in 2017 and 2018 by Jason Litherland from National Parks and Wildlife South Australia and Katheryn Litherland, a traditional owner. Credit: Yandruwandha Yawarrawarrka Traditional Land Owners Aboriginal Corporation

Predictions for  in the region threaten to alter the conditions that allowed the preservation of these artifacts, which may affect the potential survival of other wooden objects that remain in the environment.Boomerangs return with greater insights into ample uses

More information: Amy Roberts et al, Morphological Analysis and Radiocarbon Dating of Non-Returning Boomerangs from Cooper Creek/Kinipapa, Australian Archaeology (North-East South Australia) (2021). DOI: 10.1080/03122417.2021.1994685

Provided by Flinders University 

World's largest whales eat more than previously thought, amplifying their role as global ecosystem engineers

World's largest whales eat more than previously thought, amplifying their role as global ecosystem engineers
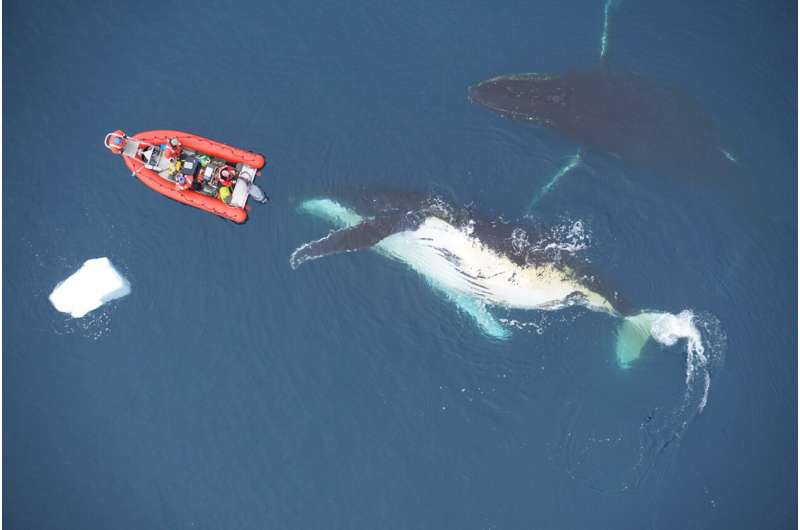
To crack the conundrum of just how much food 30- to 100-foot whales eat, scientists used 
data from 321 tagged whales spanning seven species living in the Atlantic, Pacific and
 Southern Oceans collected between 2010 and 2019. Each of these tags, suction-cupped
 to a whale’s back, is like a miniature smartphone—complete with a camera, microphone, 
GPS and an accelerometer that tracks movement. The tags track the whales’ movements 
in three-dimensional space, allowing scientists to look for telltale patterns to figure out how 
often the animals were engaged in feeding behaviors. By braiding this line of evidence with
 other data the research team collected, the scientists could generate the most accurate
 estimates to date of how much these gargantuan mammals actually eat each day and, by
 extension, each year. 
Credit: Duke University Marine Robotics and Remote Sensing under NOAA permit 14809-03 and ACA permits 2015-011 and 2020-016

New research co-authored by Nicholas Pyenson, curator of fossil marine mammals at the Smithsonian's National Museum of Natural History, shows evidence that the world's largest whales have been sold short. The study, published today in the journal Nature, finds that gigantic baleen whales—such as blue, fin and humpback whales—eat an average of three times more food each year than scientists have previously estimated. By underestimating how much these whales eat, scientists may also have been previously underestimating the importance of these undersea giants to ocean health and productivity.

Since whales eat more than previously thought, they also poop more, and whale poop is a crucial source of nutrients in the open . By scooping up food and pumping out excrement, whales help keep key nutrients suspended close to the surface where they can power blooms of the carbon-absorbing phytoplankton that form the base of ocean food-webs. Without whales, those nutrients more readily sink to the seafloor, which can limit productivity in certain parts of the ocean and may in turn limit the capacity of ocean ecosystems to absorb planet-warming carbon dioxide.

The findings come at a pivotal moment as the planet faces the interconnected crises of global climate change and biodiversity loss. As the planet warms, the oceans absorb more heat and become more acidic, threatening the survival of food sources that whales need. Many species of baleen whales also have not recovered from industrial whaling during the 20th century, remaining at a small fraction of their pre-whaling population sizes.

"Our results say that if we restore whale populations to pre-whaling levels seen at the beginning of the 20th century, we'll restore a huge amount of lost function to ocean ecosystems," Pyenson said. "It may take a few decades to see the benefit, but it's the clearest read yet about the massive role of large whales on our planet."

Surprisingly, some basic biological questions remain unanswered when it comes to the world's biggest whales. Marine ecologist and Stanford University postdoctoral fellow Matthew Savoca, one of Pyenson's collaborators and lead author of the study, found himself confronted by one of these remaining mysteries: how much the massive filter-feeding baleen whales ate each day.

Savoca said the best estimates he encountered from past research were guesses informed by few actual measurements from the species in question. To crack the conundrum of just how much food 30- to 100-foot whales eat, Savoca, Pyenson and a team of scientists used data from 321 tagged whales spanning seven species living in the Atlantic, Pacific and Southern Oceans collected between 2010 and 2019.

Researchers find whales are more important ecosystems engineers than previously thought
Video and 3D-motion tags that are deployed on large whales with suction cups.
 Credit: Goldbogen Lab

Savoca said each of these tags, suction-cupped to a whale's back, is like a miniature smartphone—complete with a camera, microphone, GPS and an accelerometer that tracks movement. The tags track the whales' movements in three-dimensional space, allowing the team to look for telltale patterns to figure out how often the animals were engaged in feeding behaviors.

The data set also included drone photographs of 105 whales from the seven species that were used to measure their respective lengths. Each animal's length could then be used to create accurate estimates of its body mass and the volume of water it filtered with each mouthful. Finally, members of the team involved in this near-decade-long data collection effort used small boats equipped with echo-sounders to race to sites where whales were feeding. The echo-sounders use sound waves to detect and measure the size and density of swarms of krill and other prey species. This step was crucial empirical grounding for the team's estimates of just how much food the whales might be consuming.

By braiding these three lines of evidence together—how often whales were feeding, how much prey they could potentially consume while feeding and how much prey was available—the researchers could generate the most accurate estimates to date of how much these gargantuan mammals eat each day and, by extension, each year.

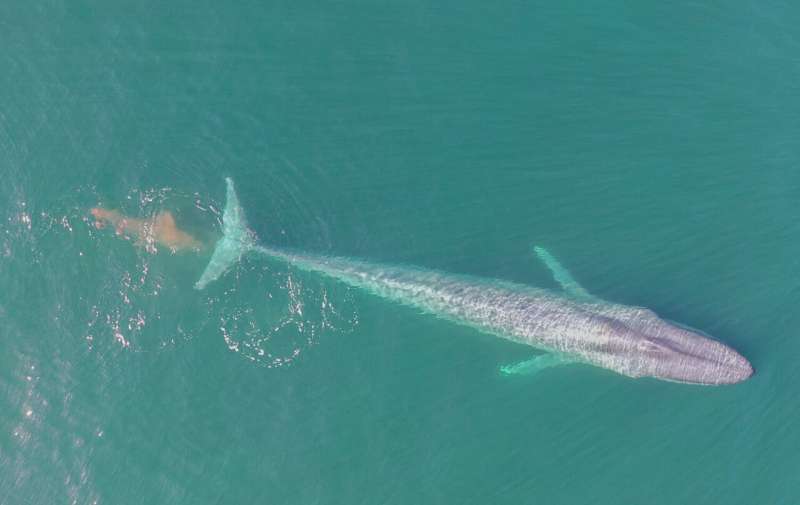
World's largest whales eat more than previously thought, amplifying their role as global ecosystem engineers
Because whales eat more than previously thought, they also poop more, and whale poop
 is a crucial source of nutrients in the open ocean. By scooping up food and pumping out 
excrement, whales help keep key nutrients suspended close to the surface where they 
can power blooms of the carbon-absorbing phytoplankton that form the base of ocean 
food-webs. Without whales, those nutrients more readily sink to the seafloor, which can
 limit productivity in certain parts of the ocean and may in turn limit the capacity of ocean
 ecosystems to absorb planet-warming carbon dioxide. 
Credit: Elliott Hazen under NOAA/NMFS permit 16111

For example, the study found an adult eastern North Pacific blue whale likely consumes 16 metric tons of krill per day during its foraging season, while a North Atlantic right whale eats about 5 metric tons of small zooplankton daily and a bowhead whale puts down roughly 6 metric tons of small zooplankton per day.

To quantify what these new estimates mean in the context of the larger ecosystem, a 2008 study estimated that all of the whales in what is known as the California Current Ecosystem, which stretches from British Columbia to Mexico, required about 2 million metric tons of fish, krill, zooplankton and squid each year. The new results suggest that the blue, fin and humpback whale populations living in the California Current Ecosystem each require more than 2 million tons of food annually.

To demonstrate how more prey consumption by whales increases their capacity to recycle key nutrients that might otherwise sink to the seafloor, the researchers also calculated the amount of iron all this extra whale feeding would recirculate in the form of feces. In many parts of the ocean, dissolved iron is a limiting nutrient, meaning that there might be plenty of other key nutrients such as nitrogen or phosphorus in the water, but a lack of iron prevents potential phytoplankton blooms. Because whales eat so much, they end up ingesting and excreting substantial amounts of iron. Prior research found whale poop has around 10 million times the amount of iron found in Antarctic seawater, and because whales breathe air they tend to defecate near the surface—just where phytoplankton need nutrients to help power photosynthesis. Using past measurements of the average concentrations of iron in whale poop, the researchers calculated that whales in the Southern Ocean recycle roughly 1,200 metric tons of iron every year.

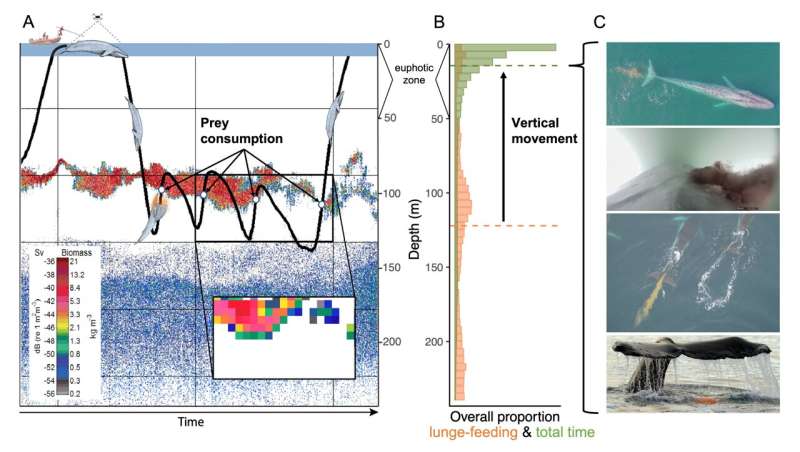
Researchers find whales are more important ecosystems engineers than previously thought
Field measurements informing baleen whale prey consumption and nutrient recycling.
 Photos taken under NOAA permits 16111, 14809, 23095, and ACA permits 2015-011 and
 2020-016. Credit: Alex Boersma

These surprising findings led researchers to investigate what their results might tell them about the marine ecosystem before industrial whaling slaughtered 2 to 3 million whales over the course of the 20th century. Based on whaling industry records of animals killed in the waters surrounding Antarctica in the Southern Ocean, the researchers used existing estimates of how many whales used to live in the region combined with their new results to estimate how much those animals likely ate.

According to the analysis, minke, humpback, fin and blue whales in the Southern Ocean consumed some 430 million metric tons of krill annually at the beginning of the 1900s. That total is double the amount of krill in the entire Southern Ocean today and is more than twice the total global catch from all human wild-capture fisheries combined. In terms of the whales' role as nutrient recyclers, the researchers calculate that whale populations, before losses from 20th-century whaling, produced a prodigious flow of excreta containing 12,000 metric tons of iron, 10 times the amount whales currently recycle in the Southern Ocean. 

These calculations suggest that when there were a lot more whales chowing down on krill, there must have been a lot more krill for them to eat. Savoca said that the decline of krill numbers following the loss of so many of their biggest predators is known to researchers as the krill paradox and that the decline in krill populations is most pronounced in areas where whaling was especially intense, such as the Scotia Sea between the Southern Ocean and the Atlantic Ocean southeast of South America.

"This decline makes no sense until you consider that whales are acting as mobile krill processing plants," Savoca said. "These are animals the size of a Boeing 737, eating and pooping far from land in a system that is iron-limited in many places. These whales were seeding productivity out in the open Southern Ocean and there was very little to recycle this fertilizer once whales were gone."

The paper posits that restoring whale populations could also restore lost marine productivity and, as a result, boost the amount of carbon dioxide sucked up by the phytoplankton—which are eaten by krill. The team estimates that the nutrient cycling services provided by pre-whaling populations at the start of the 20th century might fuel a roughly 11% increase in marine productivity in the Southern Ocean and a drawdown of at least 215 million metric tons of carbon, absorbed and stored in ocean ecosystems and organisms in the process of rebuilding. It is also possible these carbon reduction benefits would accrue year over year.

"Our results suggest the contribution of whales to global productivity and carbon removal was probably on par with the forest ecosystems of entire continents, in terms of scale," Pyenson said. "That system is still there, and helping whales recover could restore lost ecosystem functioning and provide a natural climate solution."

Pyenson said he, Savoca and others are pondering what the impact of  might be if the team had been less conservative with their estimates, as well as a potential line of research comparing the relatively recent losses of large mammals in the sea to those lost on land, such as the American bison. Though based at Stanford, Savoca will continue his work this fall at the Smithsonian collecting samples from its extensive baleen whale collections.Study suggests climate change could prevent recovery of southern right whales

More information: Matthew Savoca, Baleen whale prey consumption based on high-resolution foraging measurements, Nature (2021). DOI: 10.1038/s41586-021-03991-5. www.nature.com/articles/s41586-021-03991-5

Journal information: Nature 

Provided by Smithsonian 

History of insect invasions offers insight into the future

History of insect invasions offer insight into the future
Spotted lanternfly is a destructive insect that feeds on a wide range of fruit, ornamental, 
and hardwood trees, including grapes, apples, walnut, and oak; a serious threat to the 
United States' agriculture and natural resources. Credit: USDA / Lance Cheung.

Over the past two centuries, thousands of non-native insects have hitchhiked to the United States in packing material, on live plants, and in passenger baggage. Scientists with two U.S. Department of Agriculture (USDA) agencies and their partners used the history of live plant imports and invasion by a common group of insects to estimate the rate at which new insects are arriving and how many new insect species may yet be in store for U.S. forests and agricultural fields.

Findings suggest that efforts to reduce biological hitchhiking on live plant imports, often referred to as "biosecurity," are working. However, more than a century of invasion by Hemiptera insects also suggests that increased trade might offset the effects of improved biosecurity. As many as 25 percent of invading Hemiptera insects may have yet to be detected in the nation's forests and agricultural fields.

The study, "Hidden patterns of insect establishment risk revealed from two centuries of alien species discoveries," was published recently in the journal Science Advances. The study's lead author, Matthew MacLachlan, a research economist with the USDA Economic Research Service, and co-author Andrew Liebhold, a research entomologist with the USDA Forest Service, examined records from 1854 to 2012; they found that 930 non-native species of plant-feeding insects in the Hemipter order have invaded the United States. The research team was able to identify the origins of 770 of those species.

"Our work quantifying the establishment risk posed by imports from distinct regions and how these risks have changed with the accumulation of trade history and time gives policy-makers a better picture of the risks of insect invasion per unit of  and region," MacLachlan said.

Hemiptera are small, plant-feeding insects (the order includes true bugs, aphids, and scales), and many of these species cause considerable damage to agricultural and forest . The Hemiptera order includes more than 80,000 insect species, and accidental transport of live plants or plant products is the main pathway by which most Hemiptera move among continents.

"Data on historical discoveries of non-native Hemiptera in the United States helped us estimate rates of new  establishments that may occur as a result of plant imports from various world regions today," Liebhold said.

Co-authors include Takehiko Yamanaka of the Institute for Agro-Environmental Sciences, NARO (NIAES) in Japan and Michael R. Springborn of the University of California, DavisPlants can prepare for insect attack sequence

More information: Matthew J. MacLachlan et al, Hidden patterns of insect establishment risk revealed from two centuries of alien species discoveries, Science Advances (2021). DOI: 10.1126/sciadv.abj1012

Journal information: Science Advances 

Provided by USDA Forest Service 

As-needed pesticide use brings wild bees, increases watermelon yield without reducing corn profits

As-needed pesticide use brings wild bees, increases watermelon yield without reducing corn profits
A team of researchers at Purdue University found as-needed pesticide use increased 
pollination from wild bees and increased watermelon yield. 
Credit: Purdue University / Tom Campbell

Many farmers rent bee hives to pollinate crops, but they could tap into the free labor of wild bees by adopting an as-needed approach to pesticides, a new proof-of-concept study shows.

A multiyear study of commercial-scale fields in the Midwest found this approach led to a 95% reduction in pesticide applications, while maintaining or increasing crop yield for corn and watermelon. The findings are detailed in a paper published in the Proceedings of the National Academy of Sciences.

"An as-needed approach to pesticide treatment can benefit ," said Ian Kaplan, professor of entomology at Purdue University, who led the project. "With reduced pesticide use, we saw within the first year wild bees returned to the fields, and our findings showed an average 26% increase in watermelon yield."

The team of researchers from Purdue's College of Agriculture studied fields at five different locations in Indiana and the Midwest over a period of four years to compare conventional pest management with an , or IPM, approach. The IPM approach relied on scouting the fields and applying  only when pest levels reached previously established thresholds for damage that would lead to economic losses.

In the last few decades, pesticides have been used preemptively, beginning with treated seed and followed by applications on a set schedule, said Christian Krupke, professor of entomology and member of the research team.

"Using these potent insecticides, more often, increases the potential for unintended consequences and harm to insects, animals and human health. This study shows that we may not need such powerful weapons to control pests, and at a minimum, we don't need to use them as frequently as we do," Krupke said.

Agricultural sustainability and the benefits of IPM are gaining attention. Walmart recently announced a policy requiring all global fresh produce and floral providers to adopt IPM practices by 2025.

"It is important for people to know that there is another option between conventionally grown produce and organic produce," said Kaplan who leads Purdue's Insect Ecology Lab. "IPM can greatly reduce the amount of pesticides used to grow food without taking the tool entirely away from farmers or putting the food supply at risk."

Midwest growers also are attuned to the issue and want solutions to protect their crops and their pollinators, said Laura Ingwell, assistant professor of entomology. Indiana is one of the major watermelon production states in the U.S. and the pollinator-dependent crop accounts for an average of 7,000 acres of land annually.

"Unfortunately, it is hard to find untreated corn or soybean seed," she said. "Across the Midwest watermelon fields are like islands in a sea of corn and soybeans. We need to understand how the management of one impacts the other because many Indiana farmers have all of these crops in rotation."

The team worked with farm staff at the Purdue research fields to grow both corn, which is wind pollinated, and watermelon, which is insect pollinated, to replicate a real agricultural ecosystem in Indiana. Each site had a pair of 15-acre fields, one with untreated seed and using IPM, and the other using treated seed and conventional pest management practices like calendar-based insecticide sprays. The crops were rotated over the course of the study, and the different locations allowed the team to examine the impact of different soil types and environmental conditions, said Jacob Pecenka, a graduate student who performed much of the study.

"We used weekly scouting to monitor pests at the IPM fields, which means we would go into the field, look for pests and take a sample count of the numbers of different pests present," he said. "It was surprising that the pests rarely reached the established threshold for economic risk to the crops. Only four times during the course of the study did pests reach a threshold that triggered pesticide application. That is a huge reduction from the 97 treatments of the conventionally managed fields."

Pecenka and his team also monitored the flowers and counted the number of visits by bees in the watermelon fields.

"The IPM fields had a 130% increase in the number of flower visits over the conventional fields," he said. "The biggest players in pollination were native, wild bees. They are efficient pollinators and serious foragers."

Due to watermelon crops being grown in the middle of the cornfields, any wild pollinators had to travel at least 100 feet to get to the watermelon flowers. Despite this challenge, wild  made up 80% of the flower visits while honeybees were only 20%, even though their colonies were placed within a few feet of the watermelon , Pecenka said.

"We don't have a great understanding of the biology of many wild bee species, but this study suggests they are important and resilient," he said. "Within the first year these bees were a significant presence in the fields with low levels of pesticide, which can kill the , confuse their navigation and repel them."

The team also observed an increase in the number of beneficial insects in the IPM fields, Ingwell said.

"Wasps, ladybugs and other natural predators of watermelon pests step in when the pest levels rise," she said. "It is tempting to pretreat with pesticides as an insurance policy for your crop, but this study shows we can trust the natural system most of the time. Weekly scouting in the watermelon crop is enough to maintain the yield and benefit the insect community in terms of pest suppression and pollination."

Resources for pollinator protection, and fruit and vegetable growers are available through the Purdue Extension offices.

The team, which also included professor emeritus Rick Foster, next plans to scale up the study using 50-acre commercial fields.More support needed for pollination services in agriculture

More information: Jacob R. Pecenka et al, IPM reduces insecticide applications by 95% while maintaining or enhancing crop yields through wild pollinator conservation, Proceedings of the National Academy of Sciences (2021). DOI: 10.1073/pnas.2108429118

Journal information: Proceedings of the National Academy of Sciences 

Provided by Purdue University