Sunday, December 05, 2021

Growing environmental footprint of plastics driven by coal combustion


Abstract

Research on the environmental impacts from the global value chain of plastics has typically focused on the disposal phase, considered most harmful to the environment and human health. However, the production of plastics is also responsible for substantial environmental, health and socioeconomic impacts. We show that the carbon and particulate-matter-related health footprint of plastics has doubled since 1995, due mainly to growth in plastics production in coal-based economies. Coal-based emissions have quadrupled since 1995, causing almost half of the plastics-related carbon and particulate-matter-related health footprint in 2015. Plastics-related carbon footprints of China’s transportation, Indonesia’s electronics industry and India’s construction sector have increased more than 50-fold since 1995. In 2015, plastics caused 4.5% of global greenhouse gas emissions. Moreover, 6% of global coal electricity is used for plastics production. The European Union and the United States have increasingly consumed plastics produced in coal-based economies. In 2015, 85% of the workforce required for plastics consumed by the European Union and the United States was employed abroad, but 80% of the related value added was generated domestically. As high-income regions have outsourced the energy-intensive steps of plastics production to coal-based economies, renewable energy investments throughout the plastics value chain are critical for sustainable production and consumption of plastics.

Main

The global demand for plastics has quadrupled over the past four decades1 and is projected to further increase in the future, intensifying the impacts on the environment and human health2,3,4,5. Strategies for the sustainable production and consumption of plastics require information on the value chain of plastics6,7,8,9, such as fossil resource extraction and processing, resin production, manufacturing into plastics products, plastics use and end-of-life treatments. Many studies have addressed the environmental impacts of (micro)plastics pollution2,4,5,6,8,10,11,12,13,14 and plastics incineration7,15,16. Less attention has been paid to plastics production, which also has substantial environmental impacts, such as those caused by the release of greenhouse gas (GHG)17,18,19,20 emissions. Furthermore, plastics production induces health impacts, such as through the release of particulate-matter (PM) emissions, and socioeconomic impacts, such as by employing a workforce and creating value added.

Since the value chain of plastics spans the entire globe, plastics are often produced in a different country from the one in which they are ultimately consumed21. Therefore, the environmental, health and socioeconomic impacts resulting from one country’s plastics consumption can occur elsewhere around the globe. Multiregional input-output (MRIO) analysis allows these impacts to be assessed along the global value chain22,23,24,25,26,27,28. However, the accuracy of results from standard MRIO analysis has been limited when analysing the cumulative impacts of materials such as plastics due to double counting29,30,31,32. For example, when assessing cumulative GHG emissions (including upstream emissions) of primary plastics production and plastics recycling, double counting occurs because some primary plastics are ultimately recycled. In standard MRIO analysis32, the emissions of these primary plastics are counted again as upstream emissions in plastics recycling (a detailed explanation is provided in Cabernard et al.31).

In this article, we apply an enhanced method based on MRIO analysis that prevents double counting29,30,31,33 to assess the environmental impacts of global plastics production from 1995 to 2030 and extend this method to evaluate the role of coal combustion (Methods). We assess GHG emissions that occur in the global plastics value chain, called the carbon footprint of plastics. In this context, the study highlights the importance of plastics production, including resin production, manufacturing into plastics products and related upstream activities. Moreover, we analyse fossil resources used as a fuel and feedstock for plastics production, called here the fossil resource footprint of plastics. To evaluate the role of trade, the link between plastics-producing and consuming regions is mapped. Further, we analyse the future evolution of the global carbon footprint of plastics assuming that the world follows the International Energy Agency’s (IEA’s) projection for a 2 °C or 6 °C scenario34,35. Finally, this study analyses the PM health impacts, the workforce employed and value added created in the global plastics production chain to provide an overview of the health and socioeconomic impacts (Methods).

Results

Global carbon footprint of plastics and value-chain analysis

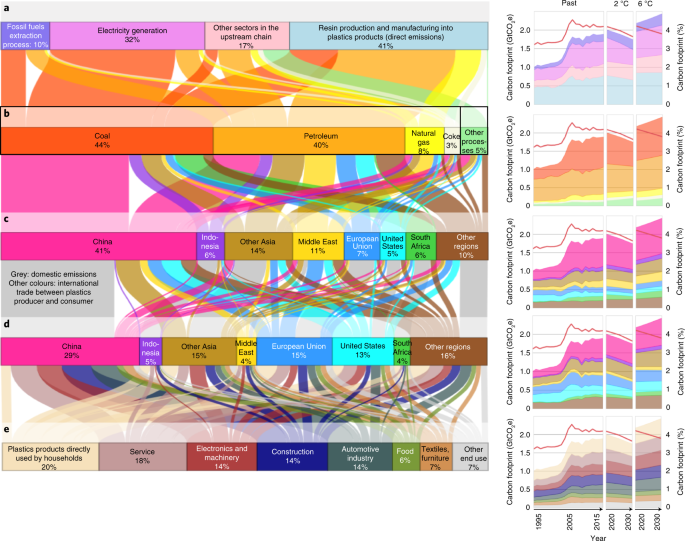
Since 1995, the carbon footprint of plastics has doubled, reaching 2 GtCO2-equivalent (CO2e) in 2015, accounting for 4.5% of global GHG emissions (Extended Data Fig. 1). The major driver of the rising carbon footprint of plastics has been the increased combustion of coal for plastics production, including resin production, manufacturing into plastics products and related upstream activities (Fig. 1a,b). As coal-based emissions for plastics production have quadrupled since 1995, plastics production accounted for the majority (96%) of the carbon footprint of plastics, while the end-of-life stages, including recycling, incineration and landfills, induced a minor fraction (6%, year 2015, Extended Data Fig. 1). Consequently, coal-based emissions caused almost half of the carbon footprint of global plastics production in 2015, due mainly to electricity and heat supply from coal for resin production and manufacturing into plastics products (Fig. 1a,b). In total, 6% of global coal electricity was used for plastics production in 2015.

Fig. 1: Global value-chain analysis of the carbon footprint (GHG emissions) of global plastics production in 2015.
figure1

ae, The sum of each horizontal bar of the flow chart refers to the carbon footprint of global plastics production in 2015 (1.9 GtCO2e, 100%) and allocates it to the different perspectives in the global value chain: the sectors where GHG emissions are released (a); the processes that release GHG emissions, that is, combustion (88%) and non-combustion (7%) processes of fossil fuels (left side: 95% in total) and other processes (right side: 5 % in total): biogenic emissions (2.7%), hydrofluorocarbon emissions (1.7%) and cement production (0.8%) (b); the regions where GHG emissions are released (production perspective) (c); the regions where plastics are finally used (consumption perspective) (d); and the end products or sectors where plastics are finally used: plastics packaging material is allocated to the end product or sector where it is used (for example, food packaging in the food sector) (e). The flows show the linkages between the perspectives. To enhance clarity, linkages contributing to less than 0.1% of the plastics-related carbon footprint are not shown. The small graphs on the right show the temporal evolution of the carbon footprint of global plastics production for each perspective (ae) over the past two decades (1995–2015) and in the future (2020–2030) if the world follows the IEA’s projection for a 2 °C or 6 °C scenario34,35 (but not accounting for the decrease in global GHG emissions in 2020 due to the COVID-19 pandemic, as in Liu et al.66). The colours of the graphs on the right correspond to the bars of the flow chart. The red line in each graph represents the global share. The end-of-life stages of plastics (recycling, incineration and landfills) contributed another 120 MtCO2e in 2015, not illustrated in this figure. A detailed value-chain analysis of the carbon footprint of global plastics recycling is shown in Extended Data Fig. 2.

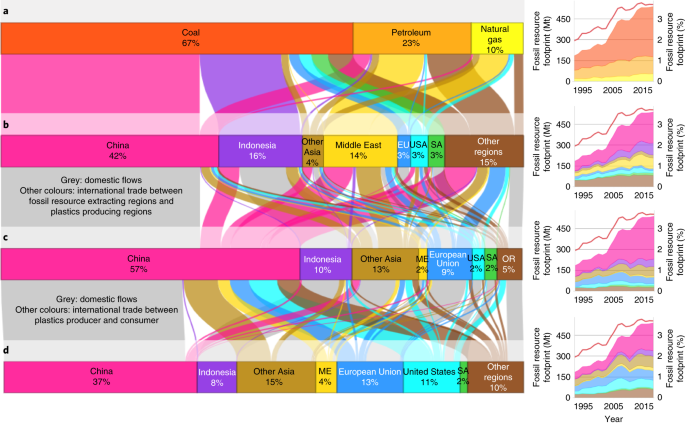
Due to the increased reliance on coal, the fossil resource footprint of plastics, including fossil resources used as fuel and feedstock for plastics production, has tripled since 1995 (Fig. 2a). Fossil fuels combusted for global plastics production released a total of 1.7 GtCO2e in 2015 (Fig. 1b, 88%). The carbon contained in fossil resources used as feedstock for plastics production accounted for another 890 MtCO2e (meaning this amount would be released if all plastics produced in 2015 were combusted without credits from energy recovery). Thus, twice as much fossil carbon is combusted as fuel for plastics production (1.7 GtCO2e) than contained as feedstock in plastics (890 MtCO2e). Our results further indicate that if all plastics produced in 2015 were incinerated, this would increase the annual carbon footprint of plastics by 19% (350 MtCO2e, subtracting credits from energy recovery36). While the GHG emissions of plastics incineration are commonly known7,8,15, our results show that even in a worst-case scenario in which all plastics were combusted, the major share of GHG emissions would still occur in the production phase.

Fig. 2: Value-chain analysis of the fossil resource footprint of global plastics production, including the extraction of fossil resources used as a fuel and feedstock for plastics production.
figure2

ad, The sum of each horizontal bar of the flow chart on the left refers to the fossil resource footprint of global plastics production in 2015 (540 Mt in 2015, 100%) and allocates it to the different perspectives in the global value chain: type of extracted fossil resource (a); region where fossil resources are extracted (b); region where fossil resources are used for plastics production (as fuel or feedstock) (c); region where plastics are consumed (d). The small graphs on the right show the temporal evolution of the fossil fuel footprint of global plastics production for each perspective (ad) over the past two decades. The colours of the graphs on the right correspond to the bars of the flow chart. The red line in each represents the global share. EU, European Union; ME, Middle East; SA, South Africa; USA, United States; OR, other regions.

Growth in plastics production in coal-based emerging economies, such as China, Indonesia and South Africa, was the major driver of the increasing carbon footprint of plastics (Fig. 1). Since 1995, China’s plastics-related carbon footprint has more than tripled from both a production and a consumption perspective (Fig. 1b–d). In 2015, 40% of the global plastics-related carbon footprint and more than 60% of the related coal-based emissions were caused in China. In Indonesia, coal mining for plastics production has increased by a factor of 300 since 1995 (Fig. 2b). In 2015, 15% of Indonesia’s totally mined coal was used for plastics production, either domestically or abroad. More than 10% of Indonesia’s total domestic GHG emissions were attributed to plastics production in 2015. South Africa’s plastics-related carbon footprint has increased tenfold since 1995, and 95% of it was caused by domestic coal consumption in 2015. The reason for this is that South Africa uses coal not only to supply electricity and heat but also as a feedstock for plastics production37. Almost half of the plastics produced in China and South Africa were exported, such as to the European Union and to the United States (Fig. 1c,d).

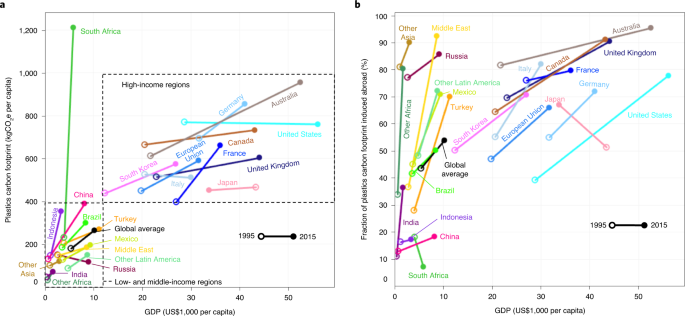
High-income regions, such as the European Union and the United States, contributed substantially to the increasing global carbon footprint of plastics by their rising demand for plastics produced in lower-income regions, particularly in coal-based economies such as China (Figs. 1 and 3 and Extended Data Fig. 3). Due to the outsourcing of plastics production to lower-income regions, the European Union’s plastics-related carbon footprint increased although their domestic plastics-related GHG emissions decreased (Extended Data Fig. 4). In 2015, two-thirds of the European Union’s plastics-related carbon footprint was emitted abroad, mainly in lower-income regions with less-stringent environmental policies. The fraction of the plastics-related carbon footprint caused abroad was even higher for Australia, Canada and the United States (>80% in 2015, Fig. 3b). Since 1995, the United States’ plastics-related carbon footprint generated abroad quadrupled, while their plastics-related domestic GHG emissions decreased (Extended Data Fig. 5). Consequently, the fraction of the United States’ plastics-related carbon footprint induced abroad increased from 39% in 1995 to 78% in 2015. One-third of the United States’ plastics-related carbon footprint in 2015 occurred in China (Fig. 1c,d; see Supplementary Results 1 for further results on the Middle East and Supplementary Results 2 and Supplementary Fig. 2 for results on the carbon intensity of plastics resin production per region).

Fig. 3: Plastics-related carbon footprints of nations and the role of imports in 1995 and 2015.
figure3

a, Change in the per capita carbon footprints of plastics from a consumption perspective. b, Change in the fraction of the carbon footprint of plastics induced abroad due to imports plotted against the GDP and grouped by income67 from 1995 to 2015 (as single data points for these two years). The carbon footprints of plastics shown in this figure allocate the GHG emissions to the region where the plastics were finally used (consumption perspective). Net traded GHG emissions of plastics (production-based minus consumption-based GHG emissions) are shown in Extended Data Fig. 3.

In addition to increased plastics exports, emerging economies contributed to the rising global carbon footprint of plastics by their growing plastics demand, due mainly to their growing infrastructures, transportation systems and digitalization. Since 1995, the plastics-related carbon footprint of China’s transportation system, Indonesia’s electronics industry and India’s construction sector has increased more than 50-fold. In 2015, 15% of the global carbon footprint of plastics was attributed to plastics used for construction, and almost half of these emissions were attributed to China’s construction (Fig. 1d,e). In addition, plastics are responsible for 15% of the carbon footprint of the global automotive industry, and more than one-third of these GHG emissions were attributed to China’s automotive industry. While China also manufactured most of the plastics embodied in electronics (65%), a smaller portion (42%) was used by China itself, and the majority (58%) was exported to other regions.

Climate change scenarios

If the world follows the IEA’s projection for a 6 °C scenario34,35, the global carbon footprint of plastics would grow by 31% from 2015 to 2030, and thus almost at the same speed as projected plastics production (+40%, Fig. 1, see Extended Data Fig. 6 for per capita projections). The strongest increase is expected for coal-based economies, such as China, India and South Africa, while the largest international customers of plastics produced in these coal-based economies continue to be the European Union and the United States. Following the IEA’s projection for a 2 °C scenario34,35 would reduce the global carbon footprint of plastics by 10% from 2015 to 2030, while plastics production would increase by 40%. This would be attributed to investment in renewable energy production, mainly clean electricity, and improved energy efficiency in resin production. However, coal combustion would still contribute more than a third of the carbon footprint of plastics in 2030 if the world followed the IEA’s projection for a 2 °C scenario34,35. This highlights the potential of a rapid phase-out of coal to further reduce the carbon footprint of plastics in the future, as keeping global warming below 1.5 °C is critical for preventing major climate-related hazards38.

Despite the growing demand for plastics in emerging economies, the carbon footprints of plastics remain distinctly higher in high-income regions on a per capita level (Fig. 3a), and this imbalance is projected to persist into the future (Extended Data Fig. 6). Taking into account the projected reduction in plastics-related carbon footprints per region if the IEA’s measures for a 2 °C scenario34,35 were implemented, high-income regions in particular would have a high saving potential at the per capita level, which would also reduce income-related differences in the carbon footprints of plastics.

Health and socioeconomic impacts of plastics production

Since 1995, the global PM health footprint of plastics has increased by 70%, causing the loss of 2.2 million disability-adjusted life years (DALY) and representing 2.8% of global PM health impacts in 2015 (based on EXIOBASE322 and Cabernard et al.31, Extended Data Figs. 7 and 8). Similar to GHG emissions, plastics production accounted for the majority (96%) of the plastics-related PM health footprint, half of which was attributed to coal combustion (year 2015, Fig. 4a,b). Moreover, the majority (75%) of PM health impacts were caused in China, India, Indonesia and other Asia, while high-income regions increasingly consumed plastics produced in these regions (Fig. 4c,d). In 2015, the majority of the European Union’s (80%) and the United States’ (91%) plastics-related PM health footprint was caused abroad, mainly in Asia. Thus, only 8% of the global plastics-related PM health footprint effectively occurred in high-income regions (Extended Data Fig. 9c), although one-third of global plastics was consumed in high-income regions.

CONTINUE READING HERE Growing environmental footprint of plastics driven by coal combustion | Nature Sustainability


PAKISTAN
Coal termed hedge against world fuel price volatility
Published December 5, 2021 -

Donkeys stand at the entrance of a coal mine in Choa Saidan Shah, Punjab 
on May 5, 2014. — Reuters/File

KARACHI: Coal is on its way out globally as the impact of climate change becomes more obvious by the day.

But the energy companies involved in mining and coal-based power generation in Pakistan are scaling up their production capacities to ensure “reliable and affordable” electricity going forward.

“Coal provides us with a hedge against international fuel price volatility. It’s indigenous and its price is not pegged to the international market,” said Engro Energy Ltd CEO Ahsan Zafar Syed while speaking to Dawn in a recent interview.

His company owns 11.9 per cent shareholding in Sindh Engro Coal Mining Company Ltd (SECMC), which has been mining 3.8 million tonnes of coal every year since 2019. It sells its entire output to Engro Powergen Thar Ltd (EPTL), the country’s only coal-based 660-megawatt power plant that burns indigenous fuel. Engro Energy Ltd owns 50.1pc shares in EPTL.

“Covid-19 showed us how one event could affect the international fuel supply chains. Economic progress requires indigenous fuel sources to ensure energy security and protection from supply-chain disruptions,” he said.

Engro Energy CEO says Covid showed how one event can disrupt international supply chains

The contribution of coal to the electricity fuel mix has surged in recent years as an increasing number of power plants on both imported and indigenous coal became part of the national grid. Its share in the total power generation in the first 10 months of 2021 was 20pc.

Despite a global movement against the use of coal, Mr Syed said SECMC is poised to double its output to 7.6m tonnes per annum by June 2022. The mine’s expansion under the ongoing second phase will coincide with the commissioning of a 330MW power plant by Thar Energy Ltd, whose majority shareholding is with The Hub Power Company (Hubco).

Another Hubco-sponsored power plant of 330MW, ThalNova Power Thar Ltd, is expected to come on line in September-October next year. Its commissioning will ensure 100pc consumption of the enhanced output of the Thar coal mine.

The third phase of the mine expansion will then take the output to 12.2m tonnes of coal per annum by June 2023, said Mr Syed. The increased output will supply fuel to the 660MW power plant that the Lucky Group is building at Port Qasim.

“You can’t even think about abandoning this [mining] project. We must take it to a point where it achieves economic viability. Only then you can pause and think about other options,” said Mr Syed.

Based on the pricing structure in place for Thar coal, SECMC earns an internal rate of return or IRR of 20pc above the project cost. The price of indigenous coal is currently $61 per tonne, about half of the rate prevailing in the international market.

Thar coal’s price will come down to $42 per tonne upon the completion of the ongoing second phase, he said. Thanks to the economies of scale, it’ll further drop to $27 per tonne when the third phase is completed.

“International commodity prices aren’t coming back to their normal levels until mid-2022 at least. But even after they normalise, our post-expansion coal will still be the cheapest source of energy at $27 per tonne,” said Mr Syed, noting that the mine’s output must be increased to 12.2m tonnes per annum for it to fully achieve the economic and financial viability.

Focus on renewable energy


Mr Syed went to great pains to state that he and his company firmly believe in climate change and consider coal to be a dirty fuel source. But burning coal is unavoidable to meet the developing economy’s base-load power requirements, he insisted.

However, renewable sources of energy should be promoted simultaneously, he said, noting that his company is now focusing more on wind and solar projects.

Engro Energy is going to establish a 400MW wind and solar power project at Jhimpir to sell 20pc cheaper electricity to bulk consumers based in Port Qasim and Dhabeji under a business-to-business (B2B) model by 2024.

In addition, the company has signed 17 letters of intent with the Balochistan government to set up 10 wind power and seven solar power plants of up to 1,700MW in Chagai district.

“We’ve set up wind masts. They’ve been collecting [meteorological] data for two years now,” he said.

Published in Dawn, December 5th, 2021
WAIT, WHAT
Hawaii Is Under A Blizzard Warning & The Weather Forecast Calls For A Foot Of Snow

Winter is coming for Hawaii 😭

Part of Hawaii is under a blizzard warning. Really.

The National Weather Service (NWS) warns that high winds and heavy snow are coming for the Big Island summits, and things could get pretty nasty over the weekend.

Up to 12 inches of snow are expected to fall in the area from Friday evening until Sunday morning, according to the NWS.

Wind gusts are also expected at speeds of up to 100 miles per hour.

“Travel could be very difficult to impossible,” the warning says. “Blowing snow will significantly reduce visibility at times, with periods of zero visibility.”

The weather agency adds that the strong winds will “likely cause significant drifting snow.”

The news will likely not delight vacationers who are trying to escape the frigid winter weather this December, especially since the NWS is recommending that people stay indoors during the storm.
Story continues below

“Travel should be restricted to emergencies only,” it said. “If you must travel, have a winter survival kit with you. If you get stranded, stay with your vehicle."

Hawaii is known to get snow a few times a year, according to the South Kohala Management tourism site.

The summits of the island's volcanos typically get the worst of it, with 8 inches forecast in 2017.

But it's not all bad. The bare slopes of the volcanoes can apparently make for some pretty awesome sledding after a snowstorm.
IKEA Customers Slept Over In The Store's Beds During A Danish Snowstorm & Lived The Dream

Admit it: you've secretly thought about doing this.


@ikeaaalborg | Instagram
Josh Elliott
December 03, 2021 

IKEA typically doesn't let you sleep in the cozy display beds at its stores — but a few lucky people are now the exception to the rule.

More than two dozen people spent the night in a Denmark IKEA's showroom this week after a winter storm trapped them in the store, The Associated Press reports.

The storm hit late Wednesday in Aalborg, Denmark, leaving six customers, many IKEA employees and staff from a nearby toy shop stranded.

But don't feel too badly for them, because they had a blast.

The customers and staff enjoyed dinner from IKEA's cantina, kicked back and watched some TV and then they each picked out a bed where they would spend the night, AP reports.


The people were able to "pick the exact bed they always have wanted to try."

"The evening went very fast before we went to bed between [11 p.m.] and 1 a.m.," store manager Peter Elmose told Ekstra Bladet, a Danish newspaper.

Customer Erik Bangsgaard, who had to stay at the store for their night along with his wife, said they enjoyed sleeping on the fold-out sofa that they chose. However, the bright showroom lights stayed on throughout the night.

"They could not dampen it, so we just had to try to sleep anyway," he told TV2Nord.

Everyone went home in the morning and IKEA changed the sheets on all the beds afterward, but not before sharing a few photos and videos of the scene after a very unusual night.

Toy store employee Michelle Barrett told Denmark's public broadcaster DR that it was an unusual but unforgettable scenario.

"We just laughed at the situation, because we will probably not experience it again," Barrett said.
The skeleton of a Roman 'vaporized' just steps from the sea as he fled the Mount Vesuvius eruption in 79 AD, found by archaeologists


Alia Shoaib
Sat., December 4, 2021

Francesco Sirano, director of the excavations, near the skeleton of the last person who was trying to escape from Herculaneum during the eruption of the volcano Vesuvius.Marco Cantile/LightRocket via Getty Images

Archaeologists discovered the skeleton of a Roman man who was fleeing the eruption of Mount Vesuvius in 79 AD.

Scientists believe the man was possibly trying to get on a rescue ship.

The skeleton was lying facing upwards, which suggests that he had turned to face the onrushing cloud.

Archaeologists discovered the skeletal remains of a man killed by the eruption of Mount Vesuvius in 79 AD, offering new insights into one of the most famous volcanic eruptions in history.

The man, who researchers believe was between 40 and 45 years old, was killed just steps from the sea in the ancient Roman town of Herculaneum as he tried to escape, Italian news agency ANSA said.

He was carrying with a wooden box containing a ring, which could have been his most prized possession, The Times said.

The eruption of Mount Vesuvius nearly 2,000 years ago destroyed several major Roman cities, including Pompeii and Herculaneum.

The remains were discovered during excavations in October, and archaeologists released several images for the first time on Wednesday.

The skeleton of a male victim just found during a new excavation campaign in the Herculaneum archaeological area, the town buried with the nearly Pompeii by the eruption of Vesuvius volcano on 79 AD.Carlo Hermann/KONTROLAB/LightRocket via Getty ImagesMore

"The last moments here were instantaneous but terrible," Francesco Sirano, the site director, told ANSA.

"It was 1 a.m. when the pyroclastic surge produced by the volcano reached the town for the first time with a temperature of 300-400 degrees, or even, according to some studies, 500-700 degrees."

"A white-hot cloud that raced towards the sea at a speed of 100km [60 miles] per hour, which was so dense that it had no oxygen in it," he added.

The man's bones were stained red from blood, Sirano told the outlet, because of combustion caused by the flow of magma, ash, and gas.

"They would have burnt off all his clothing and vaporized his flesh. Death would have been instantaneous," said Pierpaolo Petrone, an anthropologist and archeologist, reported The Telegraph.

The remains were surrounded by heavy carbonized wood, including a roof beam that could have crushed his skull, ANSA reported.

Unusually, the skeleton was facing upwards, suggesting that he had turned to face the onrushing cloud of hot gas and volcanic matter.

"Most of the people we've found here at Herculaneum were face down, but maybe he was trying to reach a boat and turned because he heard the roar of the cloud racing towards him at 100km/h," Sirano said, according to The Times.

The remains were found in an area where 300 people were unearthed in fishermen's shelters in the 1980s, likely awaiting a possible rescue by the fleet of Pliny the Elder, ANSA said.

Researchers are now puzzling over the man's identity and wondering why he was not sheltering with the others. Sirano suggested he could have been a rescuer or soldier helping people escape to the sea.

Alternatively, he could have been a fugitive who left the group to try and get on a rescue ship.

Some experts have suggested he was not a rich man, evidenced by the ring he was carrying.

"The ring is reddish, meaning iron, but there is something green inside the box which could be bronze," Ivan Varriale, an archaeologist, told The Times.

"The box looks like it was used to keep change, and if that's all he was carrying, he may not have been rich."

Traces of fabric in the stone indicated that the wooden box was once stored in a bag.

Thousands of years ago, Herculaneum was a seaside town favored by wealthy Romans. The ancient town now lies beneath the modern Italian city of Ercolano.
Canadian housing 'too much of an asset class' now: Rosenberg


7:53
It's not an influx of investors that are rising home prices, it's...

Dec 3, 2021

People who buy a home in Canada aren't merely owning a place to live, but rather controlling a seemingly ever-appreciating asset class, as the cost of housing in many Canadian cities continues to soar, according to Bay Street economist David Rosenberg.

"Housing has become not just a place to live in Canada, it's become like an asset class, and probably too much of an asset class," said Rosenberg, chief economist and strategist at Rosenberg Research and Associates Inc., in an interview on Friday. "We've deviated way too far in terms of pricing and where nominal growth is in the economy."

Rosenberg's comments come as the price of a house in Toronto soared to a record $1,163,323 in November, up nearly 22 per cent from a year earlier, according to Toronto Regional Real Estate Board data released Friday. Toronto wasn't the only city in Canada to report steep housing price hikes in November, with the average price of a home in Vancouver climbing 16 per cent to $1,211,200, while Calgary prices were up nine per cent to $461,000, according to those city's respective real estate boards.

Cooling Canada's housing markets has been a debate years in the making, with some analysts pointing to the Bank of Canada raising interest rates as a way to make homes more affordable for the average Canadian. Based on forward overnight index swap rates, investors expect the Bank of Canada to raise rates five times over the course of 2022, according to Bloomberg data.

However, Rosenberg cautions that rate hikes are unlikely to move at that pace, given the amount of outstanding debt Canadians have taken on. Statistics Canada said in August that Canadian households carried approximately $2.5 trillion in debt one year into the COVID-19 pandemic, about two-thirds of which was tied to mortgages.

“We had a mountain of debt before the [COVID-19 pandemic] that prevented a normal policy move in the last cycle. Now we're choking on even more debt," Rosenberg said. "Central banks might want to raise rates (but) they won't raise them as much as what the markets got priced in."

Rosenberg - who rose to prominence through a series of bearish market calls during his time as a Merrill Lynch economist in 2007-2008 - expects the Canadian economy to underperform next year. He’s predicting equity valuations will be "quite weak" and that the housing market landscape will be much different from what homeowners are seeing currently.

"When I tell this tale, people say 'Well, you're like the boy who cried wolf.' To which I say, 'Just remember that the wolf shows up at the end of the story,'" he said.

BNN
Physics Nobel belies Italy's scientific brain drain

Giorgio Parisi will share this year's physics Nobel with US and German scientists (AFP/Alberto PIZZOLI)

Claudia CHIEPPA and Gildas LE ROUX
Sat, December 4, 2021

Italian physicist Giorgio Parisi will receive a shared Nobel prize at a ceremony Monday, but behind the celebrations is consternation at the brain-drain that for years has seen many young scientists leave to work abroad.

Some 14,000 Italian researchers quit the country between 2009 and 2015, according to Italy's national statistics agency Istat -- a trend explained in large part by a lack of investment.

"Italy is not a welcoming country for researchers, whether Italian or foreign," Parisi said in October after being awarded the Nobel prize for his work on the interplay of disorder and fluctuations in physical systems.

"Research is underfunded and the situation has worsened over the past 10-15 years."

Government funding fell from 9.9 billion euros ($11.2 billion) in 2007 to 8.3 billion in 2015 -- the latest figures available -- while in 2019, research spending in the eurozone's third largest economy was significantly below the EU average.

As well as Parisi, Italy has produced some top scientists in recent decades, notably Carlo Rubbia, the CERN physicist who won a Nobel in 1984, and neuroembryologist Rita Levi-Montalcini, who won in 1986.

But commentators note that research budgets were slashed after the 2008 financial crisis, while Italy's notorious bureaucracy also plays a role in sending young talent abroad.

"In Italy, unfortunately, there are big obstacles to getting a university job," said Eleonora D'Elia, a 35-year-old biologist from Rome, who has been teaching for the past four years at Imperial College London.

She cited "a lack of funding, and jobs available, the contacts needed and a highly complex system based on the number of articles published".

- Like a vegetable garden -

The scale of the problem was confirmed by Roberto Antonelli, head of the prestigious Lincean Academy in Rome, who told AFP there had been "an enormous reduction in funds for universities and Italian research facilities".

This was accompanied by "a reduction in the quality of positions available for young people compared to other countries".

The number of professors and of long-term contracts at universities has fallen from 60,882 in 2009 to 48,878 in 2016 -- a drop of almost 20 percent.

In London, d'Elia told AFP, there is "more support in terms of salary and research budget", whereas in Italy, where she hopes one day to return to be with her family and friends, she "would have to constantly fight to get that".

The Italian government has vowed to use some of the massive post-pandemic recovery funds it expects to receive from the European Union between now and 2026 to help boost home-grown research.

Research Minister Cristina Messa in October promised six billion euros in funding for 60 projects.

- 'Like a vegetable garden' -

Antonelli welcomed the funds, but warned: "The problem is the continuity of funding... what will happen after 2026?"

He said research must be measured in percentage of GDP, which ranges from "the highest such as in Finland, Japan and South Korea, to the lowest among developed countries such as Italy, which do not invest comparable funds when compared to neighbours such as Germany or France".

Italy spent just 1.45 percent of gross domestic product (GDP) on research in 2019, below the EU average of 2.19 percent and Germany's 3.17 percent, according to data from European agency Eurostat.

Parisi has also emphasised the importance of a long-term view.

"Research is like a vegetable garden, if you think you can water it every fortnight, things will go wrong," he said.

str-glr/ar/tgb
Albanian bunkers ravaged by rising tides as erosion takes toll


Bunkers built under the direction of Albania's former dictator Enver Hoxha are now underwater (AFP/Gent SHKULLAKU)

Briseida MEMA
Sat, December 4, 2021, 11:31 PM·4 min read

Albania's communist-era bunkers were meant to withstand a nuclear strike, but decades later the fortifications are being devoured by the sea as the country's coastline is battered by erosion.

The shores of the Balkan country are among the most affected in Europe by erosion, according to experts, who blame climate change and uncontrolled urbanisation for the scourge.

Along the shores of Seman in central Albania, many of the bunkers built under the direction of former dictator Enver Hoxha -- who feared imminent invasion by the United States, Soviet Union and China among others -- are now underwater.

The same goes for the police station, a sports field and an oil well.

On the beaches, tree trunks have been ripped apart, while collapsed roofs testify to the population's helplessness in the face of the ever-advancing sea.

"The bunkers were supposed to resist everything but they failed in their one and only battle," Ilir Zani, 80, tells AFP.

According to locals, the Adriatic has advanced by 800 metres (half a mile) in this area in the past three decades alone.

Seman resident Izmir Mernica, 47, fears his cafe may be next.

"We are worried, the sea is swallowing everything," he says, pointing to a water tower now marooned in middle of the Adriatic.

- 'Waves will swallow us' -

In 2009, the authorities relied on military tanks to pull seven submerged bunkers from the sea following a string of drowning deaths caused by the whirlpools created by the currents around the structures.

More than a decade later, the bunkers are back underwater.

The sea "took them again", says Mernica.

According to climate change experts working for the United Nations Development Programme (UNDP), more than a third of Albania's 427-kilometre (265-mile) coastline is affected by erosion, at a rate of roughly one to two metres (three to seven feet) per year.

Abdulla Diku, an environmental specialist, said that for each hectare of land about 27 tonnes of soil are lost to encroaching tides each year, which is approximately 11 times the average for other European countries.

In central Albania's Qerret, Vlash Moci still maintains his bunker, which once housed anti-aircraft guns and is now a bar that attracts foreign tourists.

Moci, 64, is worried that the rising tides may claim his business soon, with the neighbouring bunker -- a pale green structure that looks like a flying saucer -- already close to being consumed.

"We are afraid that one day big waves will swallow us. It's terrible," he tells AFP.

To fight back, the owners of nearby villas and hotels in Qerret have begun constructing illegal jetties perpendicular to the sea.

But experts argue the measures only exacerbate the situation.


Experts blame climate change and uncontrolled urbanisation for the erosion on Albania's coast (AFP/Gent SHKULLAKU)


- 'Erosion hotspot' -


"These are individual solutions that aggravate the problem and harm biodiversity and marine ecosystems," warns Mirela Kamberi, an expert with the UNDP.

With little being done to stop the rising tides, the sea appears to be irresistible for the foreseeable future.

Due to climate change, experts predict sea levels in Albania will increase by 40 to 105 centimetres (16 to 41 inches) by 2100, compared with the changes recorded between 1986 and 2005.

To add to the country's woes, deforestation has also taken a toll, while the unregulated dredging of sand from rivers has accelerated their course and uncontrolled urban development along the coast has damaged the area's natural defences.

"The problem is that people have cut down almost all the fir trees to build buildings, damaging nature's systems," says Besnik Zara, 66, as he casts a fishing rod into the sea.

And in the Shupal mountains near Tirana, it is easy to see the damage erosion has wreaked further inland -- most of which has been caused by deforestation and the rivers that feed a nearby reservoir.

This lake, which supplies the capital with drinking water, "is already considered an erosion hotspot", says Diku.

To cope, the authorities banned the felling of more trees from the area's forests in 2016.

They have also vowed to implement promises made at the UN climate conferences in Paris and Glasgow and have begun passing new legislation.

"Environmental crime will be treated by the criminal code as a crime against life, property or on a par with organised crimes," warned interior minister Bledi Cuci.

bme/ev/ds/imm/dl
Texas bears brunt of US plastic pollution


Environmental activist Diane Wilson shows plastic pellets that pollute the Gulf coast of Texas (AFP/Mark Felix)

François PICARD
Sat, December 4, 2021,

Former shrimper Diane Wilson watches in disgust as a Taiwan-owned factory in Texas spews millions of plastic pellets into the Matagorda Bay.

For years Wilson has been documenting this pollution by Formosa Plastics Group, the world's fourth largest plastic manufacturer. It set up shop in 1983 south of Houston in Point Comfort, near the waters where she used to catch shrimp in abundance.

"When we did the sampling on Formosa, we found 2,000 violations. How many did the state of Texas have? Zero," Wilson told AFP as she stood at the helm of a shrimp boat.

She said regulators at environmental protection agencies in Texas, the second most populous US state, operate in a revolving door system.

"They leave the state agencies and get a job at the chemical plant because there is no money in being an inspector or an officer," Wilson said.

- America the polluter -

The United States is by far the world's biggest plastic polluter, according to a study released Wednesday.

It generated 42 million tons of waste in 2016, more than twice as much as China and more than all the countries of the European Union combined, says the study by the National Academies of Sciences, Engineering, and Medicine.

The US accounts for less than five percent of the world's people.

Point Comfort, population 737, is essentially a plastics town: it has 17 Formosa production units spread out over many acres.

Wilson, a mother of five, comes from a family that has been shrimping for four generations and is the face of the local fight against Formosa's polluting practices.

In particular she is battling white pellets, called nurdles, that factories near the coast release by the millions. These little balls smaller than beans are the raw material that buyers melt down to make a variety of plastic products.

The nurdles leak from faulty pipes at production plants and are so light they are easily carried off into nature by the slightest wind.

- Few shrimpers left -


Complaining that the state of Texas takes a hands-off approach, Wilson sued Formosa Plastics and managed to force it to sign in 2019 a consent decree under which it pays tens of thousands of dollars for each day in which it releases plastic pellets or powder into the environment.

"At this moment Formosa has had over 50 violations probably since June of this year, and they have been fined approximately $1.1 million," Wilson said.

"And the money that Formosa pays goes into a trust. It's called the Matagorda trust. It goes into environmental projects."

But Formosa also dumps toxic liquid waste into the water, millions of gallons a day, she said. This discharge is legal -- and it has ruined the local shrimp industry, Wilson added.

"There used to probably be maybe 4, 5, 600 fishermen in this community and now you're lucky if there's more than a handful of them," she added.

Formosa Plastics Group also has factories in the US states of Louisiana, South Carolina and New Jersey, as well as in Vietnam and Taiwan itself.

"We documented that within the next decade there will be more greenhouse gas emissions from plastic production than from coal plants in the United States," said Judith Enck, author of a report for Beyond Plastics, a project run by Bennington College in Vermont.

Her study found that almost 80 percent of CO2 emissions from the plastics industry in America happen along the coast of the Gulf of Mexico -- in Louisiana but mainly in Texas.

- $560 million in fines -


Plastic is made using a variety of gases, ethane in particular. And the southern US offers advantages for producing it: cheap energy, skilled labor, and good port and energy infrastructure.

Enck said the region has another lure: "A lot of fossil fuel companies like to do business in Texas because environmental laws are so weak and often not enforced."

In the last 21 years, Formosa plastics group -- all of its affiliates and subsidiaries across various countries -- have paid in total just over $560 million of fines, said Jane Patton, who wrote a report entitled "Formosa Plastics Group: a Serial Offender of Environmental and Human Rights."

It was published in October by environmental advocacy group CIEL.

Formosa Plastics declined to be interviewed for this story, referring AFP instead to the 2019 consent decree engineered by the shrimper Wilson.

str/seb/dw/mlm
Turning leaked methane into fishmeal would turn a profit while helping the environment

Why not turn a problem into an asset?
ZME
November 29, 2021

The issue of methane pollution might become an asset in the future, thanks to new technology that can transform this potent greenhouse gas into fish food.

I
 Sirawich Rungsimanop.

Approaches to converting methane into fishmeal have already been developed, the authors note, but the economic uncertainty during the pandemic has prevented its use to promote food security on any meaningful scale. The new study analyzes the method’s economic viability today. The main takeaway of the research is that methane-to-fishmeal conversion is economically feasible for certain sources of the gas and that other sources can be made profitable with certain improvements.

The approach can also be of quite significant help against climate change, the team adds, and is capable of meeting all the global demand for fishmeal, further reducing the strain we’re placing on natural ecosystems.

Untapped resource

“Industrial sources in the U.S. are emitting a truly staggering amount of methane, which is uneconomical to capture and use with current applications,” said study lead author Sahar El Abbadia, a lecturer in the Civic, Liberal and Global Education program at Stanford.

“Our goal is to flip that paradigm, using biotechnology to create a high-value product.”

Carbon dioxide is the best-known greenhouse gas, and currently the most abundant one in the Earth’s atmosphere. That being said, methane is another important player in our current climate woes. Methane is estimated to have 85 times the global warming potential of CO2 over a 20-year period, and at least 25 times as great a potential over a 100-year period. Methane also represents a direct hazard to public health as concentrations of this gas are increasing in the troposphere (the lower layer of the atmosphere, where people live). An estimated 1 million premature deaths occur worldwide, per year, due to respiratory illnesses associated with methane exposure.

The problem posed by methane is also increasing over time: the relative concentration of this gas in the atmosphere has been increasing twice as fast as that of CO2 since the onset of the Industrial Revolution, the team explains. Although there are natural sources of atmospheric methane, mostly through the decomposition of organic matter and from digestive processes, the lion’s share of that increase is owed to human-driven emissions.

Methanotrophs, bacteria that consume methane, have been explored as a potential solution in the past. If supplied with methane, oxygen, and certain nutrients, these bacteria produce a protein-rich sludge that can be used, among other things, to produce feedstock for fish farms. This process is already in commercial use by some companies; however, they are supplied by methane fed through gas distribution grids.

The authors note that capturing methane emissions — such as those from landfills, wastewater treatment plants, or leaked at oil and gas facilities — would be both cheaper and much more eco-friendly. Besides economic and environmental benefits, the shift from pumped to captured methane in the production of fishmeal would also help ensure humanity’s greater food security. The authors explain that seafood consumption has increased more than four times since the 1960s, with grave consequences for natural fish stocks.

Aquaculture (fish farms) now provide around half of the quantity of animal-sourced seafood consumed globally. Demand for seafood in the form of algae and animals is also estimated to double by 2050, the team adds, which will place increased strain on producers.

Against this backdrop, methane-sourced fish feed can represent an important asset towards food security in the future, and allow us to have the seafood we crave for minimal environmental impact.
Makes economic sense
Unused methane emissions in the U.S. from landfills, wastewater treatment plants and oil and gas facilities. Image credits El Abbadi, et al., (2021), Nature Sustainability.

In order to determine whether such efforts would also be economically-feasible, the team modeled several scenarios, each with a different source of methane used in the production of the fishmeal. These included natural gas purchased from commercial grids, as well as methane captured from relatively large wastewater treatment plants, landfills, and oil and gas facilities. For each scenario, they looked at a range of variables that would factor into a company’s bottom line, including the availability of trained labor and the cost of electricity used to keep the bioreactors running.

In the scenarios that involved methane capture from landfills and oil & gas facilities, the production cost for one ton of fishmeal would be $1,546 and $1,531, respectively. Both are lower than the 10-year average market price of such products, which sits at $1,600. In scenarios in which methane capture was performed at wastewater treatment plants, the cost per ton sat at $1,645, which is just slightly over the market average. However, the highest prices per ton were seen when methane was purchased directly from the commercial grid — $1,783 per ton.

Surprisingly enough, electricity was the single largest expense for all scenarios, representing around 45% of total costs on average. This means that areas with low electricity production costs could see significant decreases. The authors estimate that in states such as Mississippi and Texas, these costs would go down by around 20%, to an average of $1,214 per ton ($386 less than the 10-year average).

With certain improvements, such as bioreactors with more efficient heat transfer to reduce the need for cooling, production costs can be reduced even further. Even in the scenarios where wastewater treatment plants provided the methane, steps can be taken to reduce costs. For example, wastewater itself can be used as a source of nitrogen and phosphorus (key nutrients), as well as for cooling.

The team estimates that if manufacturers can bring the per ton production cost by 20%, there would be profits to be made even if all the supply of fishmeal today was covered using methane-produced materials with gas captured in the U.S. alone. With ever more reductions in cost per ton, such products could out-compete soybean and other crops for animal feed in general.

“Despite decades of trying, the energy industry has had trouble finding a good use for stranded natural gas,” said study co-author Evan David Sherwin, a postdoctoral researcher in energy resources engineering at Stanford. “Once we started looking at the energy and food systems together, it became clear that we could solve at least two long-standing problems at once.”

The paper “Displacing fishmeal with protein derived from stranded methane” has been published in the journal Nature Sustainability.