Friday, October 21, 2022

Surprising Results From NASA’s IXPE Help Unlock the Secrets of Famous Exploded Star
Cas A Supernova Remnant Composite

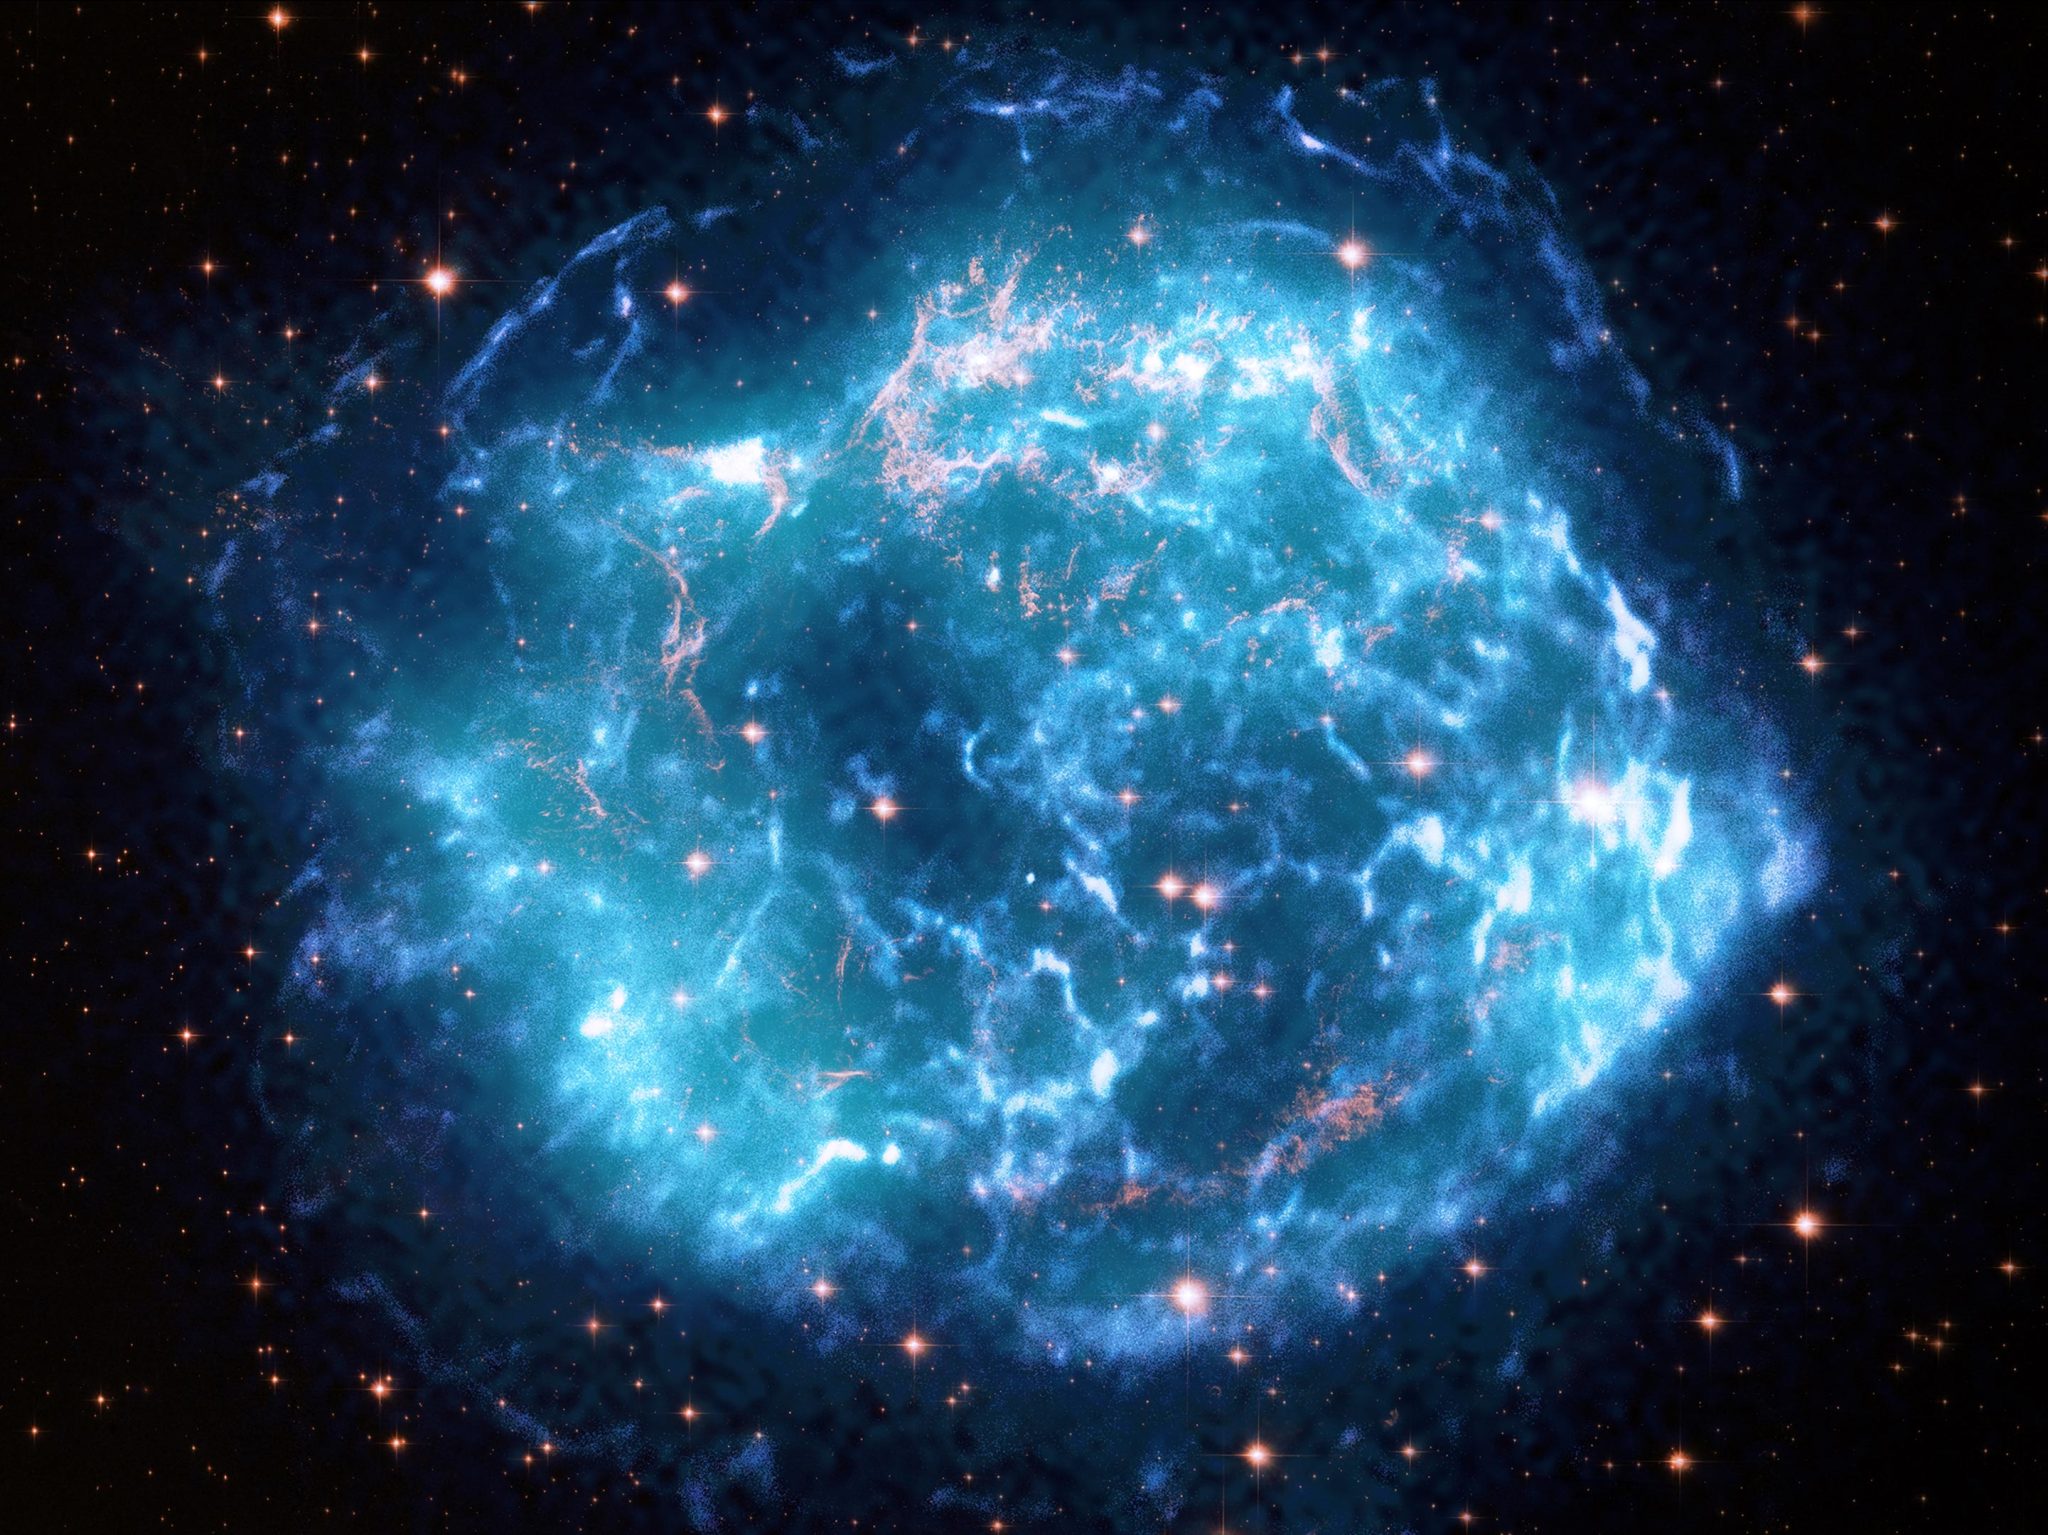
Composite images of the Cas A supernova remnant, a structure resulting from the explosion of a star in the Cassiopeia constellation. The blues represent data from the Chandra Observatory, the turquoise is from NASA’s Imaging X-ray Polarimetry Explorer (called IXPE), and the gold is courtesy of the Hubble Telescope. Credit: X-ray: Chandra: NASA/CXC/SAO, IXPE: NASA/MSFC/J. Vink et al.; Optical: NASA/STScI

Using NASA’s Imaging X-ray Polarimetry Explorer (IXPE), astronomers have, for the first time, measured and mapped polarized X-rays from the remains of an exploded star. The findings come from observations of Cassiopeia A, a famous stellar remnant. The results shed new light on the nature of young supernova remnants, which accelerate particles close to the speed of light.

Launched on December 9, 2021, IXPE, a collaboration between NASA and the Italian Space Agency, is the first satellite that can measure the polarization of X-ray light with this level of sensitivity and clarity. It was designed to discover the secrets of some of the most extreme objects in the universe – the remnants of supernova explosions, powerful particle streams spit out by feeding black holes, and more.

“These IXPE results were not what we expected, but as scientists we love being surprised.” — Dr. Jacco Vink

All forms of light – from radio waves to gamma rays – can be polarized. Unlike the polarized sunglasses we use to cut the glare from sunlight bouncing off a wet road or windshield, IXPE’s detectors map the tracks of incoming X-ray light. Scientists can use these individual track records to figure out the polarization, which tells the story of what the X-rays went through.

Cassiopeia A (Cas A for short) was the first object IXPE observed after it began collecting data. One of the reasons Cas A was selected is that its shock waves – like a sonic boom generated by a jet – are some of the fastest in the Milky Way. The shock waves were generated by the supernova explosion that destroyed a massive star after it collapsed. Light from the blast swept past Earth more than three hundred years ago.

“Without IXPE, we have been missing crucial information about objects like Cas A,” said Pat Slane at the Center for Astrophysics | Harvard & Smithsonian, who leads the IXPE investigations of supernova remnants. “This result is teaching us about a fundamental aspect of the debris from this exploded star – the behavior of its magnetic fields.”
IXPE in Earth Orbit

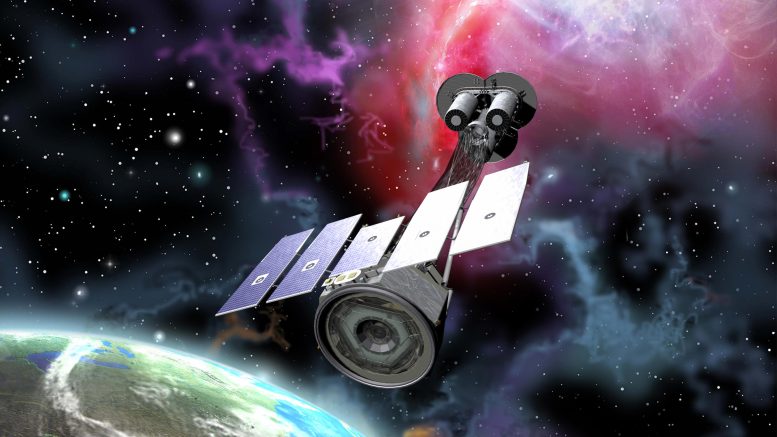
Artist’s representation of IXPE in Earth orbit. Credit: NASA

Magnetic fields, which are invisible, push and pull on moving charged particles like protons and electrons. Closer to home, they are responsible for keeping magnets stuck to a kitchen fridge. Under extreme conditions, such as an exploded star, magnetic fields can boost these particles to near-light-speed.

Despite their super-fast speeds, particles swept up by shock waves in Cas A do not fly away from the supernova remnant because they are trapped by magnetic fields in the wake of the shocks. The particles are forced to spiral around the magnetic field lines, and the electrons give off an intense kind of light called “synchrotron radiation,” which is polarized.

By studying the polarization of this light, scientists can “reverse engineer” what’s happening inside Cas A at very small scales – details that are difficult or impossible to observe in other ways. The angle of polarization tells us about the direction of these magnetic fields. If the magnetic fields close to the shock fronts are very tangled, the chaotic mix of radiation from regions with different magnetic field directions will give off a smaller amount of polarization.

Cassiopeia A (Cas A) Supernova Remnant Graphic

This graphic combines data from NASA’s Imaging X-ray Polarimetry Explorer (IXPE) with an X-ray image from Chandra (blue) and a view in optical light from Hubble (gold) of the Cassiopeia A (Cas A) supernova remnant. The lines in this graphic come from IXPE measurements that show the direction of the magnetic field across regions of the remnant. Green lines indicate regions where the measurements are most highly significant. These results indicate that the magnetic field lines near the outskirts of Cas A are largely oriented radially, i.e., in a direction from the center of the remnant outwards. The IXPE observations also reveal that the magnetic field over small regions is highly tangled, without a dominant preferred direction. Credit: X-ray: Chandra: NASA/CXC/SAO; IXPE: NASA/MSFC/J. Vink et al.

Previous studies of Cas A with radio telescopes have shown that the radio synchrotron radiation is produced in regions across almost the entire supernova remnant. Astronomers found that only a small amount of the radio waves were polarized – about 5%. They also determined that the magnetic field is oriented radially, like the spokes of a wheel, spreading out from near the center of the remnant towards the edge.

Data from NASA’s Chandra X-ray Observatory, on the other hand, show that the X-ray synchrotron radiation mainly comes from thin regions along the shocks, near the circular outer rim of the remnant, where the magnetic fields were predicted to align with the shocks. Chandra and IXPE use different kinds of detectors and have different levels of angular resolution, or sharpness. Launched in 1999, Chandra’s first science image was also of Cas A.

Cassiopeia A (Cas A) is the remnant of a supernova explosion that appeared in our sky more than 300 years ago. It is located a distance of approximately 11,000 light years from Earth. Its name is taken from the constellation in which it is seen: Cassiopeia, the Queen.

A supernova is the cataclysmic explosion that occurs at the end of a massive star’s life. Cas A is the expanding shell of material that remains from such an explosion.

Before IXPE, scientists predicted X-ray polarization would be produced by magnetic fields that are perpendicular to magnetic fields observed by radio telescopes.

Instead, IXPE data show that the magnetic fields in X-rays tend to be aligned in radial directions even very close to the shock fronts. The X-rays also reveal a lower amount of polarization than radio observations showed, which suggests that the X-rays come from turbulent regions with a mix of many different magnetic field directions.

“These IXPE results were not what we expected, but as scientists we love being surprised,” says Dr. Jacco Vink of the University of Amsterdam and lead author of the paper describing the IXPE results on Cas A. “The fact that a smaller percentage of the X-ray light is polarized is a very interesting – and previously undetected – property of Cas A.”

The IXPE result for Cas A is whetting the appetite for more observations of supernova remnants that are currently underway. Scientists expect each new observed object will reveal new answers – and pose even more questions – about these important objects that seed the Universe with critical elements.

“This study enshrines all the novelties that IXPE brings to astrophysics,” said Dr. Riccardo Ferrazzoli with the Italian National Institute for Astrophysics/Institute for Space Astrophysics and Planetology in Rome. “Not only did we obtain information on X-ray polarization properties for the first time for these sources, but we also know how these change in different regions of the supernova. As the first target of the IXPE observation campaign, Cas A provided an astrophysical ‘laboratory’ to test all the techniques and analysis tools that the team has developed in recent years.”

“These results provide a unique view of the environment necessary to accelerate electrons to incredibly high energies,” said co-author Dmitry Prokhorov, also of the University of Amsterdam. “We are just at the beginning of this detective story, but so far the IXPE data are providing new leads for us to track down.”

IXPE is a collaboration between NASA and the Italian Space Agency with partners and science collaborators in 12 countries. Ball Aerospace, headquartered in Broomfield, Colorado, manages spacecraft operations together with the University of Colorado’s Laboratory for Atmospheric and Space sciences, which operates IXPE for NASA’s Marshall Space Flight Center in Huntsville, Alabama.

NASA’s EMIT: Dust Detective Delivers First Maps From Space for Climate Science

NASA's EMIT Measures Surface Dust in North Africa, Europe, the Middle East, Central Asia

Installed on the space station in July 2022, EMIT orbits Earth about once every 90 minutes, to map the world’s mineral-dust sources. This includes the Sahara, where it recently gathered data in an area of southwest Libya marked by the red box. Credit: NASA/JPL-Caltech


Measurements from EMIT, the Earth Surface Mineral Dust Source Investigation, will improve computer simulations scientists use to understand climate change.

NASA’s Earth Surface Mineral Dust Source Investigation (EMIT) mission aboard the International Space Station (ISS) has produced its first mineral maps, providing detailed images that show the composition of the surface in regions of northwest Nevada and Libya in the Sahara Desert. EMIT was launched to the ISS aboard a SpaceX Dragon Spacecraft on July 14, 2022.

Windy desert areas such as these are the sources of fine dust particles that, when lifted by wind into the atmosphere, can heat or cool the surrounding air. But researchers haven’t been able to assess whether mineral dust in the atmosphere has overall heating or cooling effects at local, regional, and global scales. EMIT’s measurements will help them to advance computer models and improve our understanding of dust’s impacts on climate.

EMIT scientists at NASA’s Jet Propulsion Laboratory (JPL) in Southern California and the U.S. Geological Survey (USGS) created the maps to test the accuracy of the instrument’s measurements, a crucial first step in preparing for full science operations.

EMIT Northwest Nevada

This image cube shows the true-color view of an area in northwest Nevada observed by NASA’s EMIT imaging spectrometer. The side panels depict the spectral fingerprint for each point in the image. The cube shows the presence of kaolinite, a light-colored clay mineral that reflects sunlight. Credit: NASA/JPL-Caltech/USGS

Installed on the space station in July, EMIT is the first of a new class of high-fidelity imaging spectrometers that collect data from space and produce better-quality data at greater volumes than previous instruments.

“Decades ago, when I was in graduate school, it took 10 minutes to collect a single spectrum from a geological sample in the laboratory. EMIT’s imaging spectrometer measures 300,000 spectra per second, with superior quality,” said Robert Green, EMIT’s principal investigator and senior research scientist at JPL.

“The data we’re getting from EMIT will give us more insight into the heating and cooling of Earth, and the role mineral dust plays in that cycle. It’s promising to see the amount of data we’re getting from the mission in such a short time,” said Kate Calvin, NASA’s chief scientist and senior climate advisor. “EMIT is one of seven Earth science instruments on the International Space Station giving us more information about how our planet is affected by climate change.”

EMIT analyzes light reflected from Earth, measuring it at hundreds of wavelengths, from the visible to the infrared range of the spectrum. Different materials reflect light in different wavelengths. Scientists use these patterns, called spectral fingerprints, to identify surface minerals and pinpoint their location

EMIT Mineral Spectra Northwest Nevada

NASA’s EMIT mission recently gathered mineral spectra in northwest Nevada that match what the agency’s AVIRIS instrument found in 2018, helping to confirm EMIT’s accuracy. Both instruments found areas dominated by kaolinite, a reflective clay mineral whose particles can cool the air when airborne. Credit: NASA/JPL-Caltech/USGS

Mapping Minerals

The Nevada map focuses on a mountainous area about 130 miles (209 kilometers) northeast of Lake Tahoe, revealing locations dominated by kaolinite, a light-colored mineral whose particles scatter light upward and cool the air as they move through the atmosphere. The map and spectral fingerprint closely match those collected from aircraft in 2018 by the Airborne Visible/Infrared Imaging Spectrometer (AVIRIS), data that was verified at the time by geologists. Researchers are using this and other comparisons to confirm the accuracy of EMIT’s measurements.

The other mineral map shows substantial amounts of kaolinite as well as two iron oxides, hematite, and goethite, in a sparsely populated section of the Sahara about 500 miles (800 kilometers) south of Tripoli. Darker-colored dust particles from iron-oxide-rich areas strongly absorb energy from the Sun and heat the atmosphere, potentially affecting the climate

Currently, there is little or no information on the composition of dust originating in parts of the Sahara. In fact, researchers have detailed mineral information of only about 5,000 soil samples from around the world, requiring that they make inferences about the composition of dust.

EMIT Southwestern Libya

The image cube’s front panel is a true-color view of part of southwestern Libya observed by NASA’s EMIT mission. The side panels depict the spectral fingerprints for every point in the image, showing kaolinite, a reflective clay mineral, and goethite and hematite, iron oxides that absorb heat. Credit: NASA/JPL-Caltech

EMIT will gather billions of new spectroscopic measurements across six continents, closing this gap in knowledge and advancing climate science. “With this exceptional performance, we are on track to comprehensively map the minerals of Earth’s arid regions – about 25% of the Earth’s land surface – in less than a year and achieve our climate science objectives,” Green said.

EMIT’s data also will be freely available for a wide range of investigations, including, for example, the search for strategically important minerals such as lithium and rare-earth elements. What’s more, the instrument’s technology is laying the groundwork for the future Surface Biology and Geology (SBG) satellite mission, which is part of NASA’s Earth System Observatory, a set of missions aimed at addressing climate change.

Pioneering Technology

EMIT traces its roots to imaging spectrometer technology that NASA’s Airborne Imaging Spectrometer (AIS) first demonstrated in 1982. Designed to identify minerals on Earth’s surface from a low-altitude research aircraft, the instrument delivered surprising results almost immediately. During early test flights near Cuprite, Nevada, AIS detected the unique spectral signature of buddingtonite, a mineral not seen on any previous geological maps of the area.

EMIT Mineral Map Southwestern Libya

The mineral map shows a part of southwestern Libya, in the Sahara, observed by NASA’s EMIT mission. It depicts areas dominated by kaolinite, a reflective clay mineral that scatters light, and goethite and hematite, iron oxides that absorb heat and warm the surrounding air. Credit: NASA/JPL-Caltech

Paving the way for future spectrometers when it was introduced in 1986, AVIRIS – the airborne instrument that succeeded AIS – has studied geology, plant function, and alpine snowmelt, among other natural phenomena. It has also mapped chemical pollution at Superfund sites and studied oil spills, including the massive Deepwater Horizon leak in 2010. And it flew over the World Trade Center site in Manhattan following the Sept. 11 attacks, locating uncontrolled fires and mapping debris composition in the wreckage.

Over the years, as optics, detector arrays, and computing capabilities have progressed, imaging spectrometers capable of resolving smaller targets and subtler differences have flown with missions across the solar system.

A JPL-built imaging spectrometer on the Indian Space Research Organization’s Chandrayaan-1 probe measured signs of water on the Moon in 2009. NASA’s Europa Clipper, which launches in 2024, will rely on an imaging spectrometer to help scientists assess if the icy Jovian moon has conditions that could support life.

Highly advanced JPL-developed spectrometers will be part of NASA’s forthcoming Lunar Trailblazer – which will determine the form, abundance, and distribution of water on the Moon and the nature of the lunar water cycle – and on satellites to be launched by the nonprofit Carbon Mapper, aimed at spotting greenhouse gas point-sources from space.

“The technology took directions that I would never have imagined,” said Gregg Vane, the JPL researcher whose graduate studies in geology helped inspire the idea for the original imaging spectrometer. “Now with EMIT, we’re using it to look back at our own planet from space for important climate research.”

More About the Mission

EMIT was selected from the Earth Venture Instrument-4 solicitation under the Earth Science Division of NASA Science Mission Directorate and was developed at NASA’s Jet Propulsion Laboratory (JPL), which is managed for the agency by the California Institute of Technology (Caltech) in Pasadena, California. It launched aboard a SpaceX Dragon resupply spacecraft from NASA’s Kennedy Space Center in Florida on July 14, 2022. The instrument’s data will be delivered to the NASA Land Processes Distributed Active Archive Center (DAAC) for use by other researchers and the public.


https://scitechdaily.com/tag/international-space-station/
Using image spectrometer technology developed at JPL, EMIT will map the surface composition of minerals in Earth’s dust-producing regions, helping climate scientists better understand the impact of airborne dust particles in heating and cooling Earth’s atmosphere. Credit: NASA/JPL-Caltech

Milky Way’s Graveyard of Dead Stars Found – First Map of the “Galactic Underworld”


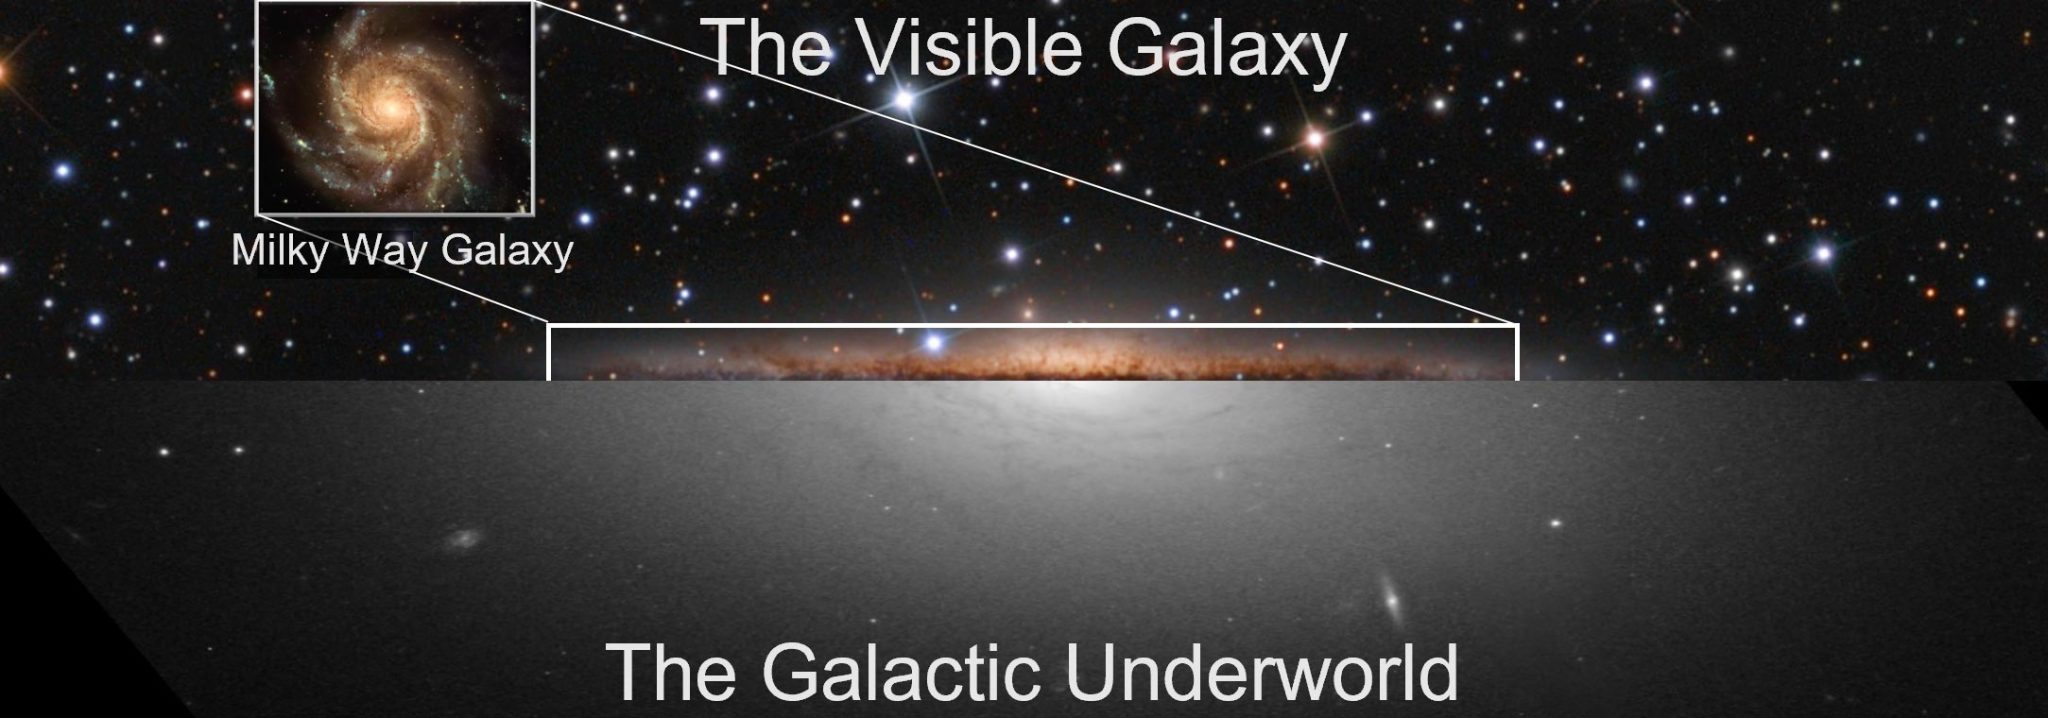
Visible Milky Way Galaxy Versus Its Galactic Underworld

Split view of the visible Milky Way galaxy versus its galactic underworld. Credit: University of Sydney

A new study creates the first map of our galaxy’s ancient dead stars.

In the first map of the ‘galactic underworld’, a study from the University of Sydney has revealed a vast graveyard that stretches three times the height of the Milky Way. It has also indicated where the dead stars lie.

A graveyard that stretches three times the height of the Milky Way has been revealed in the first map of the ‘galactic underworld’ – a chart of the corpses of once massive suns that have since collapsed into black holes and neutron stars. It also shows that almost a third of the objects have been flung out from the galaxy altogether.

“These compact remnants of dead stars show a fundamentally different distribution and structure to the visible galaxy,” said David Sweeney, a PhD student at the Sydney Institute for Astronomy at the University of Sydney. He is the lead author of the paper “The Galactic underworld: the spatial distribution of compact remnants” which was published in the latest issue of Monthly Notices of the Royal Astronomical Society.

“The ‘height’ of the galactic underworld is over three times larger in the Milky Way itself,” Sweeney added. “And an amazing 30 percent of objects have been completely ejected from the galaxy.”

Visible Milky Way Galaxy

Colour top-down and side-view of the visible Milky Way galaxy. Credit: University of Sydney

Black holes and neutron stars are formed when massive stars – more than eight times larger than our Sun – exhaust their fuel and suddenly collapse. This collapse triggers a runaway reaction that blows the outer portions of the star apart in a titanic supernova explosion. At the same time, the core keeps compressing in on itself until – depending on its starting mass – it becomes either a neutron star or a black hole.

In neutron stars, the core is so dense that electrons and protons are forced to combine at the subatomic level into neutrons. This squeezes its total mass into an incredibly dense sphere smaller than a city. If the mass of the original star is greater than 25 times our Sun’s, that gravity-driven collapse continues, until the core is so dense that not even light can escape. It has become a black hole. Both types of stellar corpses warp space, time, and matter around them.

Milky Way’s Galactic Underworld

Color top-down and side-view of the Milky Way’s galactic underworld. Credit: University of Sydney

Although billions of these exotic carcasses must have been formed since the galaxy was young, they were flung out into the darkness of interstellar space by the supernovas that created them. Therefore, they have slipped beyond the sight and knowledge of astronomers – until now.

By carefully recreating the full lifecycle of the ancient dead stars, the investigators have constructed the first detailed map showing where their corpses lie.

“One of the problems for finding these ancient objects is that, until now, we had no idea where to look,” said co-author on the paper Professor Peter Tuthill, of Sydney Institute for Astronomy. “The oldest neutron stars and black holes were created when the galaxy was younger and shaped differently, and then subjected to complex changes spanning billions of years. It has been a major task to model all of this to find them.”

Newly-formed neutron stars and black holes conform to today’s galaxy, so astronomers know where to look. But the oldest neutron stars and black holes are like ghosts still haunting a house demolished long ago, so they are harder to find.

Milky Way Galactic Underworld

Point cloud image of a Milky Way, top-down and sideways view. Credit: University of Sydney

“It was like trying to find the mythical elephant’s graveyard,” said Professor Tuthill, referring to a place where, according to legend, old elephants go to die alone, far from their group. “The bones of these rare massive stars had to be out there, but they seemed to shroud themselves in mystery.”

Added Sweeney: “The hardest problem I had to solve in hunting down their true distribution was to account for the ‘kicks’ they receive in the violent moments of their creation. Supernova explosions are asymmetric, and the remnants are ejected at high speed – up to millions of kilometers per hour – and, even worse, this happens in an unknown and random direction for every object.”

Milky Way Galactic Underworld Point Cloud

Point cloud top-down and side-view of the galactic underworld of the Milky Way. Credit: University of Sydney

But nothing in the universe sits still for long, so even knowing the likely magnitudes of the explosive kicks was not enough: the researchers had to delve into the depths of cosmic time and reconstruct how they behaved over billions of years.

“It’s a little like in snooker,” said Sweeney. “If you know which direction the ball is hit, and how hard, then you can work out where it will end up. But in space, the objects and speeds are just vastly bigger. Plus, the table’s not flat, so the stellar remnants go on complex orbits threading through the galaxy.

“Finally, unlike a snooker table, there is no friction – so they never slow down. Almost all the remnants ever formed are still out there, sliding like ghosts through interstellar space.”

The intricate models they built – together with University of Sydney Research Fellow Dr. Sanjib Sharma and Dr. Ryosuke Hirai of Monash University – encoded where the stars were born, where they met their fiery end, and their eventual dispersal as the galaxy evolved.

The final outcome is a distribution map of the Milky Way’s stellar necropolis.

“It was a bit of a shock,” said Dr. Sharma. “I work every day with images of the visible galaxy we know today, and I expected that the galactic underworld would be subtly different, but similar in broad strokes. I was not expecting such a radical change in form.”

In the maps generated, the characteristic spiral arms of the Milky Way vanish in the ‘galactic underworld’ version. These are entirely washed out because of the age of most of the remnants, and the blurring effects of the energetic kicks from the supernovae which created them.

Even more intriguing, the side-on view shows that the galactic underworld is much more ‘puffed up’ than the Milky Way – a result of kinetic energy injected by supernovae elevating them into a halo around the visible Milky Way.

“Perhaps the most surprising finding from our study is that the kicks are so strong that the Milky Way will lose some of these remnants entirely,” said Dr. Hirai. “They are kicked so hard that about 30 percent of the neutron stars are flung out into intergalactic space, never to return.”

Added Tuthill: “For me, one of the coolest things we found in this work is that even the local stellar neighborhood around our Sun is likely to have these ghostly visitors passing through. Statistically, our nearest remnant should be only 65 light years away: more or less in our backyard, in galactic terms.”

“The most exciting part of this research is still ahead of us,” said Sweeney. “Now that we know where to look, we’re developing technologies to go hunting for them. I’m betting that the ‘galactic underworld’ won’t stay shrouded in mystery for very much longer.”

Reference: “The Galactic underworld: the spatial distribution of compact remnants” by David Sweeney, Peter Tuthill, Sanjib Sharma and Ryosuke Hirai, 25 August 2022, Monthly Notices of the Royal Astronomical Society.
DOI: 10.1093/mnras/stac2092

Hubble Captures Incredible Multiwavelength View of a Turbulent Stellar Nursery


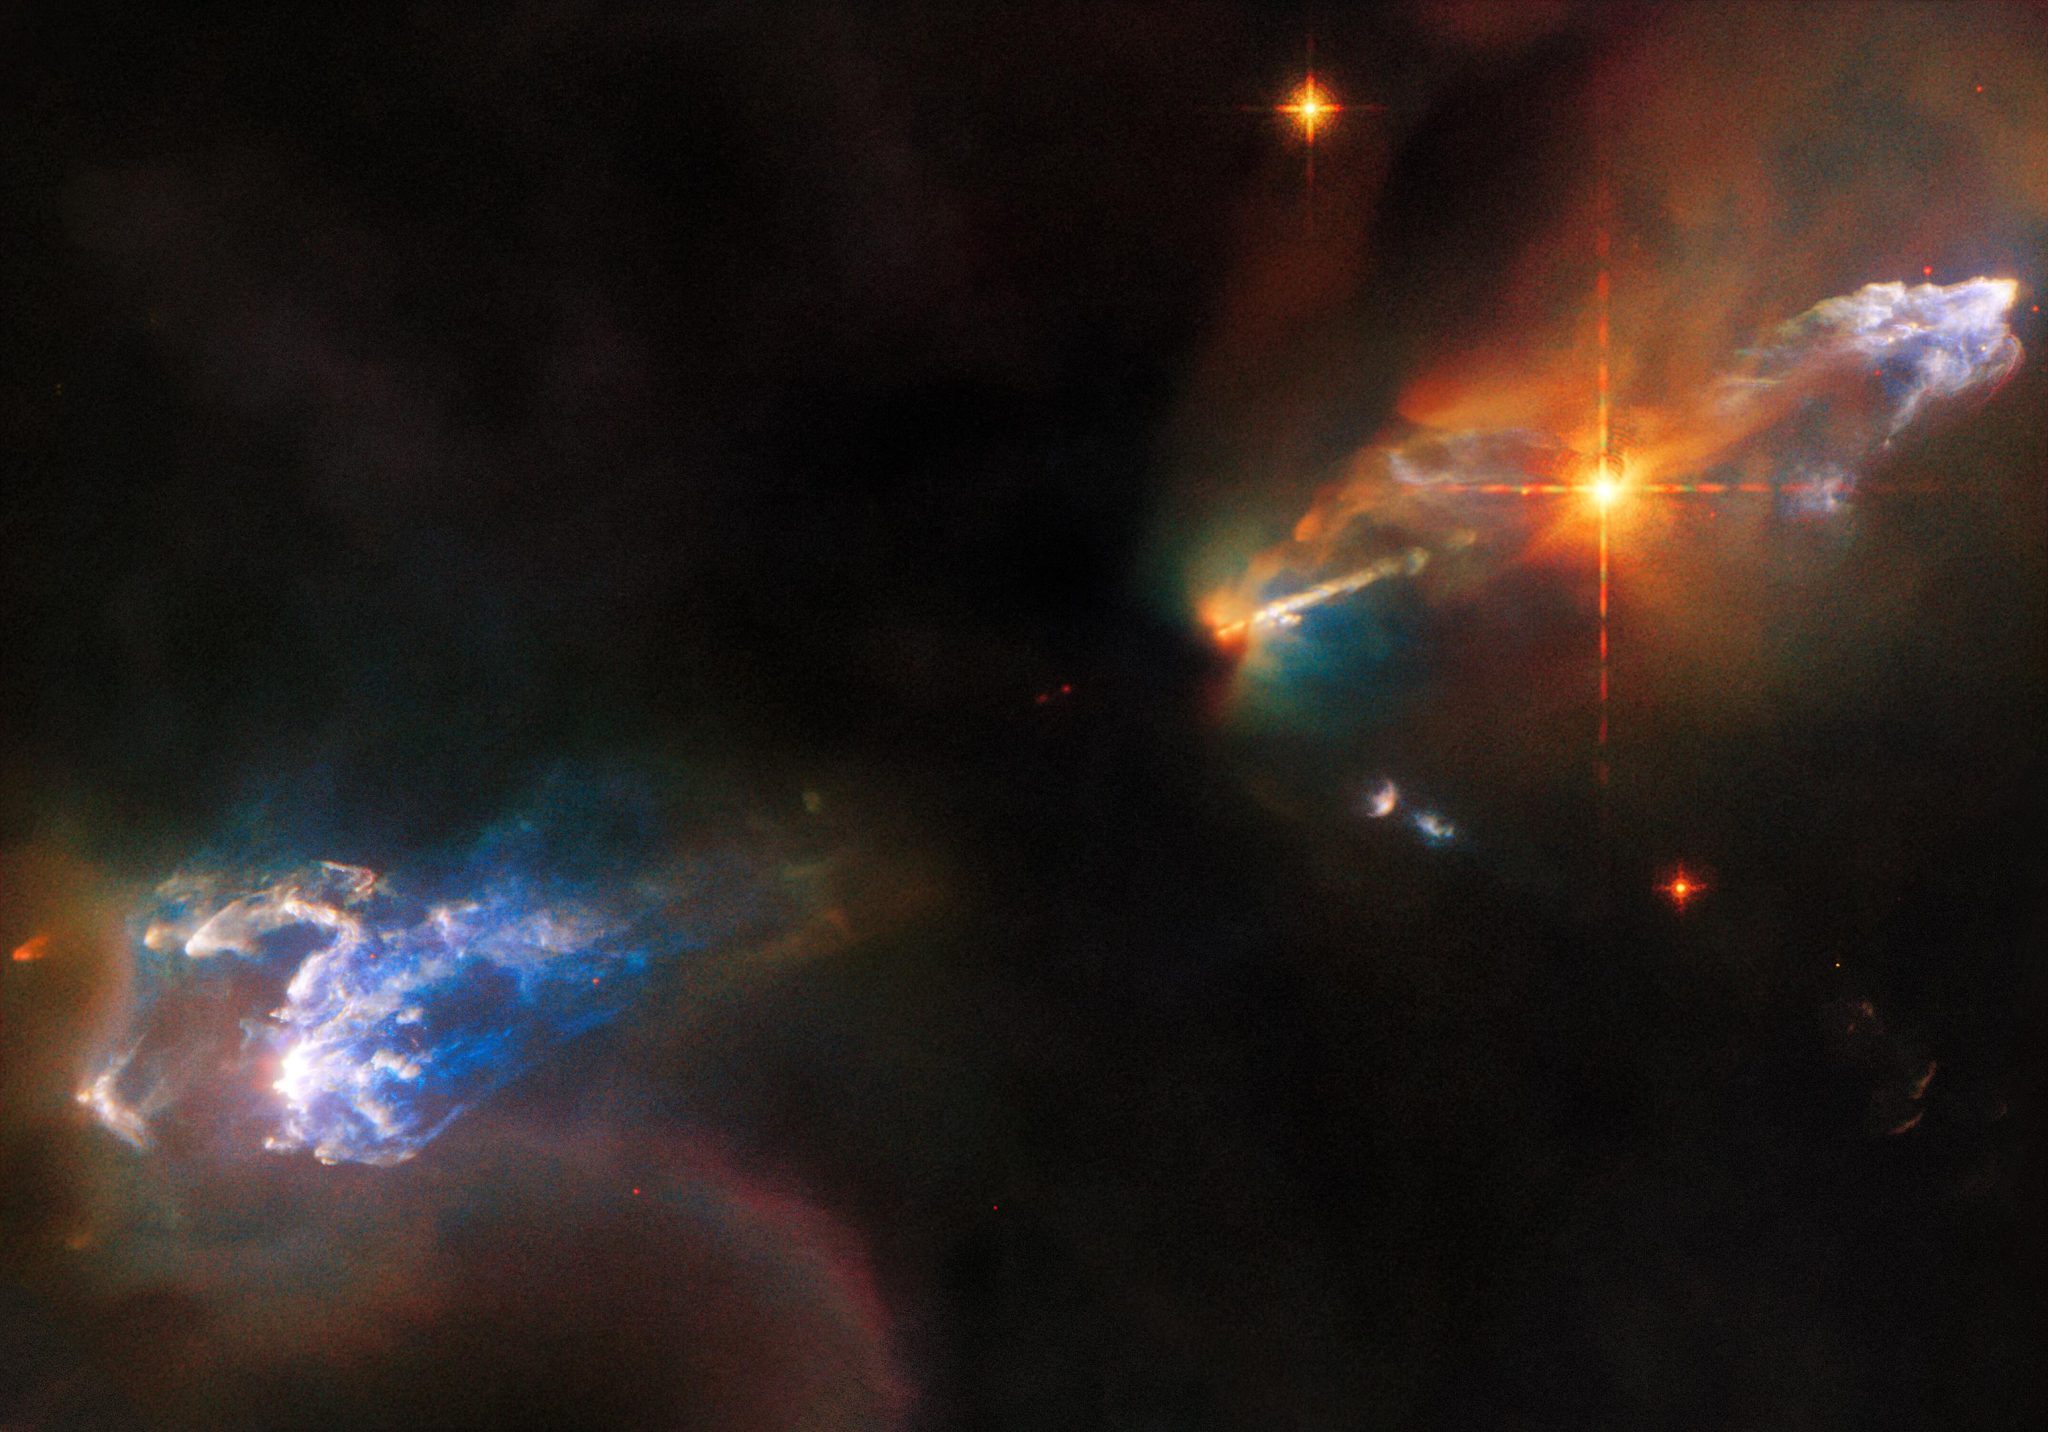
Hubble Herbig-Haro Objects HH 1 and HH 2

Two wispy, gaseous clouds occupy the corners of this image, HH 1 in the upper right, and HH 2 in the lower left. Both are light blue and surrounded by dimmer multi-colored clouds, while the background is dark black due to dense gas. A very bright orange star lies just to the lower left of HH 1, and beyond that star is a narrow jet, emerging from the dark center of the field. Credit: ESA/Hubble & NASA, B. Reipurth, B. Nisini

The lives of newborn stars are tempestuous, as this stunning image of the Herbig–Haro objects HH 1 and HH 2 from the Hubble Space Telescope depicts. Both of these objects lie approximately 1250 light-years from Earth in the constellation Orion. HH 1 is the luminous cloud above the bright star in the upper right of this image, while HH 2 is the cloud in the bottom left.

Although both Herbig–Haro objects are visible in this image, the young star system responsible for their creation is lurking out of sight. It is swaddled in the thick clouds of dust at the center of this image. However, an outflow of gas from one of these stars can be seen streaming out from the central dark cloud as a bright jet. Meanwhile, the bright star between that jet and the HH 1 cloud was once thought to be the source of these jets, but it is now known to be an unrelated double star that formed nearby.

Herbig–Haro objects are glowing clumps found around some newborn stars, and are created when jets of gas thrown outwards from these young stars collide with surrounding gas and dust at incredibly high speeds. In 2002, NASA/ESA Hubble Space Telescope observations revealed that parts of HH 1 are moving at more than 400 kilometers per second (250 miles per second) or 1,400,000 km per hour (900,000 mph)!

This scene from a turbulent stellar nursery was captured with Hubble’s Wide Field Camera 3 (WFC3) using 11 different filters at infraredvisible, and ultraviolet wavelengths. Each of these filters is sensitive to just a small slice of the electromagnetic spectrum, and they allow astronomers to pinpoint interesting processes that emit light at specific wavelengths.

In the case of HH 1/2, two groups of astronomers requested Hubble observations for two different studies. The first delved into the structure and motion of the Herbig–Haro objects visible in this image, giving astronomers a better understanding of the physical processes occurring when outflows from young stars collide with surrounding gas and dust. The second study instead investigated the outflows themselves to lay the groundwork for future observations with the NASA/ESA/CSA James Webb Space Telescope. Webb, with its ability to peer past the clouds of dust enveloping young stars, will revolutionize the study of outflows from young stars.

Strange Long-Lasting Pulse of High-Energy Radiation Swept Over Earth

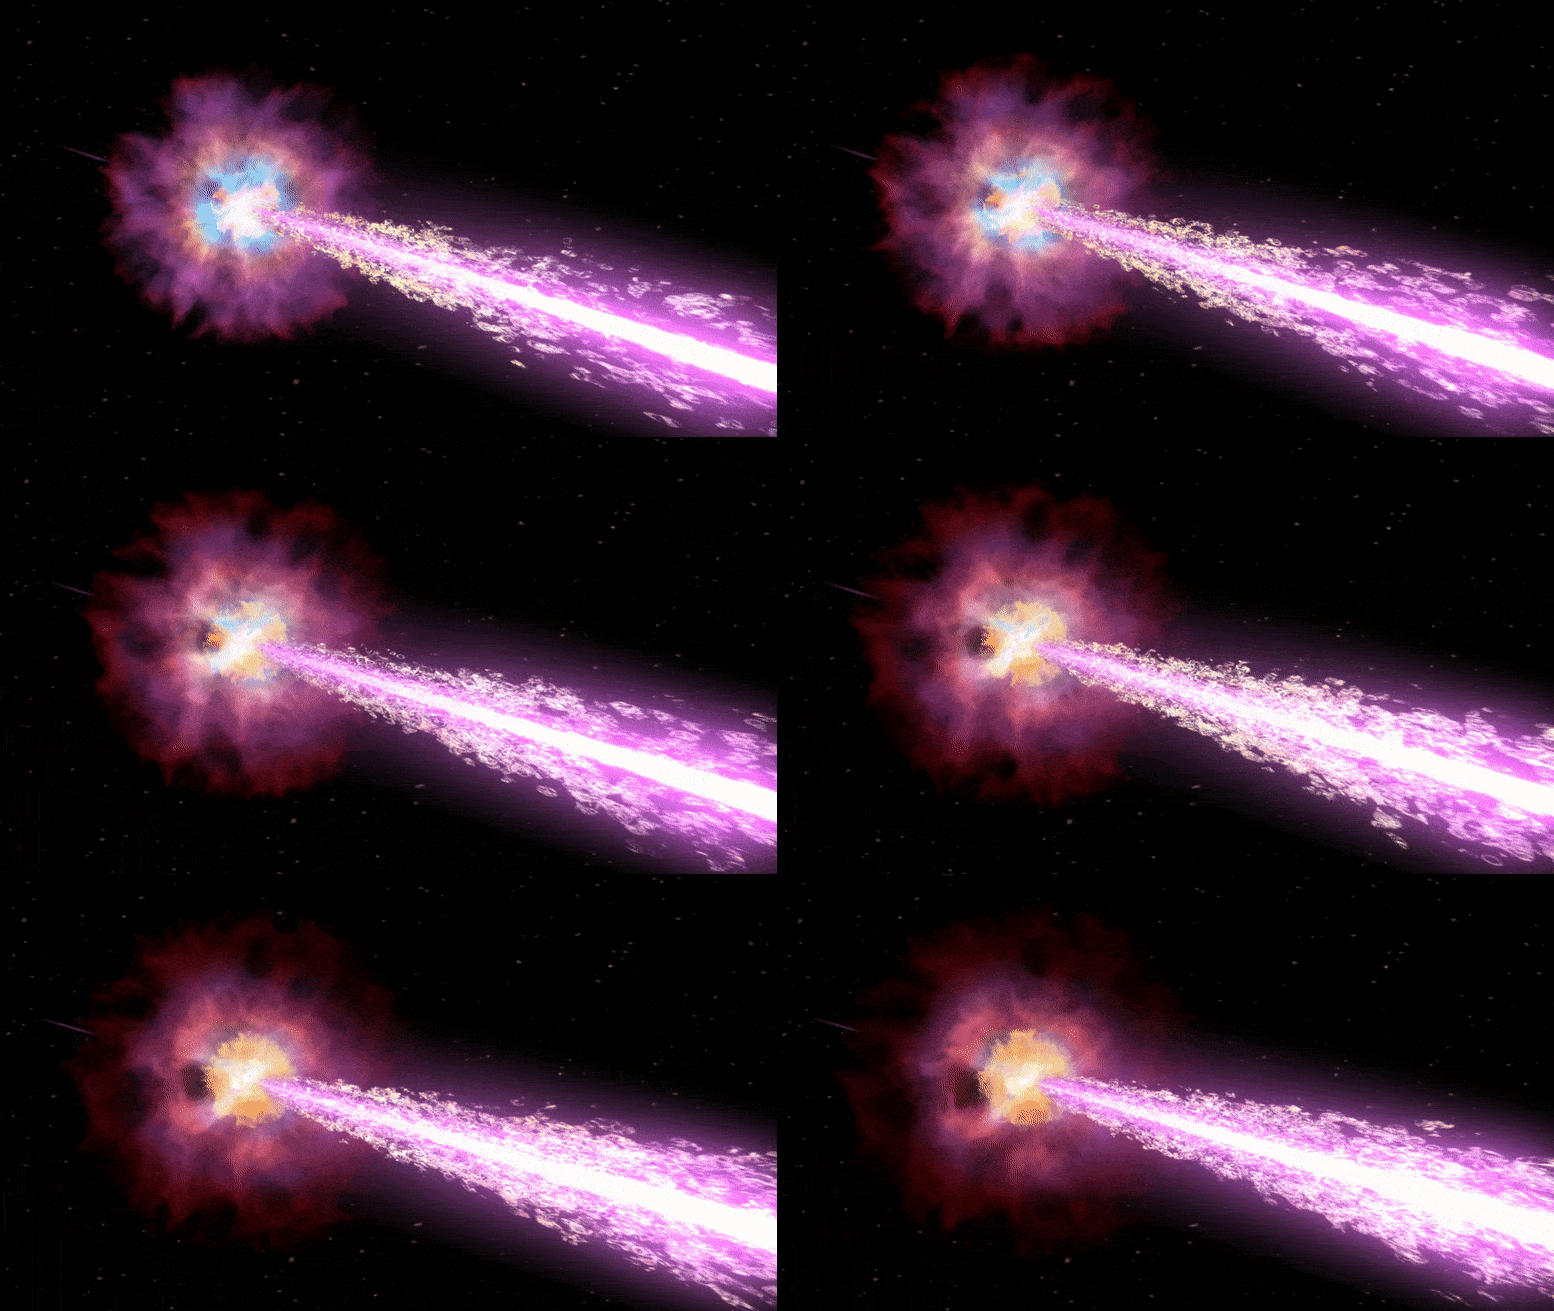
Record Breaking Gamma Ray Burst

Astronomers think GRB 221009A represents the birth of a new black hole formed within the heart of a collapsing star. In this illustration, the black hole drives powerful jets of particles traveling near the speed of light. The jets pierce through the star, emitting X-rays and gamma rays as they stream into space. Credit: NASA/Swift/Cruz deWilde

NASA’s Swift and Fermi Missions Detect Exceptional Cosmic Blast

An unusually bright and long-lasting pulse of high-energy radiation swept over Earth Sunday, October 9, captivating astronomers around the world. The intense emission came from a gamma-ray burst (GRB) – the most powerful class of explosions in the universe – that ranks among the most luminous events known.

A week ago, on Sunday morning Eastern time, a wave of X-rays and gamma rays passed through the solar system. It triggered detectors aboard NASA’s Fermi Gamma-ray Space TelescopeNeil Gehrels Swift Observatory, and Wind spacecraft, as well as others. Around the world, telescopes were turned to the site to study the aftermath, and new observations continueGRB 221009A Afterglow

Swift’s X-Ray Telescope captured the afterglow of GRB 221009A about an hour after it was first detected. The bright rings form as a result of X-rays scattered from otherwise unobservable dust layers within our galaxy that lie in the direction of the burst. Credit: Credit: NASA/Swift/A. Beardmore (University of Leicester)

Called GRB 221009A, the explosion provided an unexpectedly exciting start to the 10th Fermi Symposium, a gathering of gamma-ray astronomers now underway in Johannesburg, South Africa. “It’s safe to say this meeting really kicked off with a bang – everyone’s talking about this,” said Judy Racusin, a Fermi deputy project scientist at NASA’s Goddard Space Flight Center in Greenbelt, Maryland, who is attending the conference

Astronomers think GRB 221009A represents the birth of a new black hole formed within the heart of a collapsing star. As illustrated here, the black hole drives powerful jets of particles traveling near the speed of light. The jets pierce through the star, emitting X-rays and gamma rays as they stream into space. Credit: NASA/Swift/Cruz deWilde

Originating from the direction of the constellation Sagitta, the signal traveled an estimated 1.9 billion years to reach Earth. Many astronomers believe it represents the birth cry of a new black hole, one that formed in the heart of a massive star collapsing under its own weight. In these circumstances, a developing black hole drives powerful jets of particles traveling near the speed of light. The energetic jets pierce through the star, emitting X-rays and gamma rays as they stream into space.

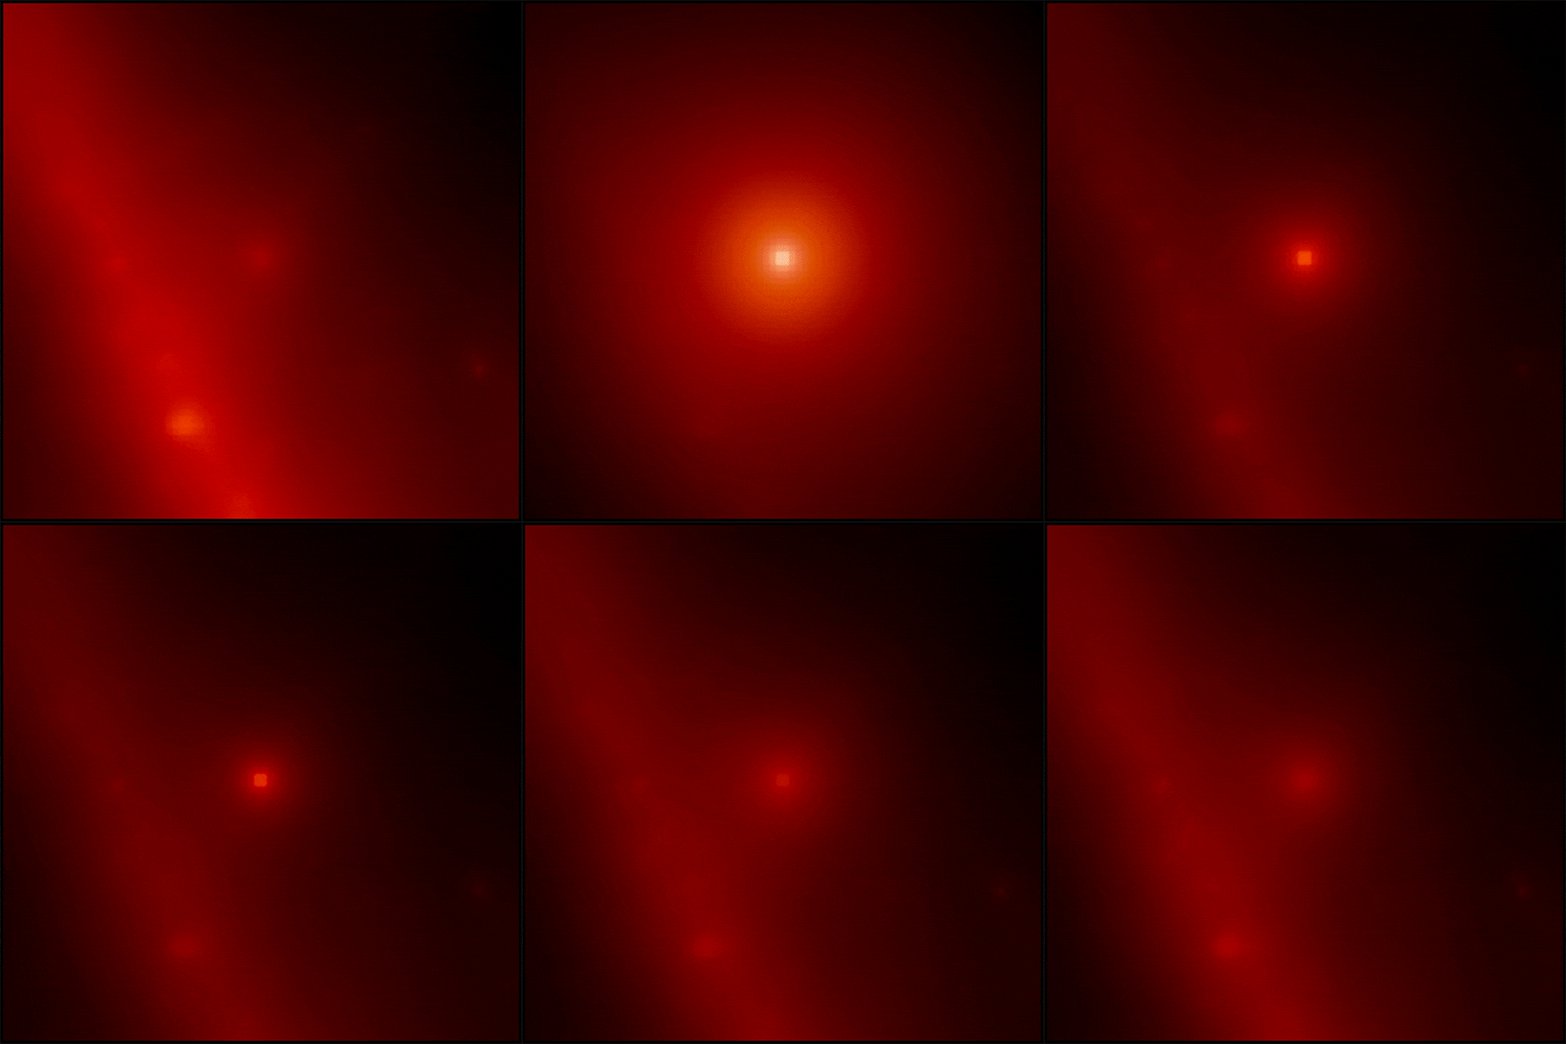
GRB 221009A Gamma Ray Burst

This sequence constructed from Fermi Large Area Telescope data reveals the sky in gamma rays centered on the location of GRB 221009A. Each frame shows gamma rays with energies greater than 100 million electron volts (MeV), where brighter colors indicate a stronger gamma-ray signal. In total, they represent more than 10 hours of observations. The glow from the midplane of our Milky Way galaxy appears as a wide diagonal band. The image is about 20 degrees across. Credit: NASA/DOE/Fermi LAT Collaboration

The burst also provided a long-awaited inaugural observing opportunity for a link between two experiments on the International Space Station (ISS) – NASA’s NICER X-ray telescope and a Japanese detector called the Monitor of All-sky X-ray Image (MAXI). Activated in April, the connection is dubbed the Orbiting High-energy Monitor Alert Network (OHMAN). It allows NICER to rapidly turn to outbursts detected by MAXI, actions that previously required intervention by scientists on the ground.

“OHMAN provided an automated alert that enabled NICER to follow up within three hours, as soon as the source became visible to the telescope,” said Zaven Arzoumanian, the NICER science lead at Goddard. “Future opportunities could result in response times of a few minutes.”

GRB 221009A Afterglow

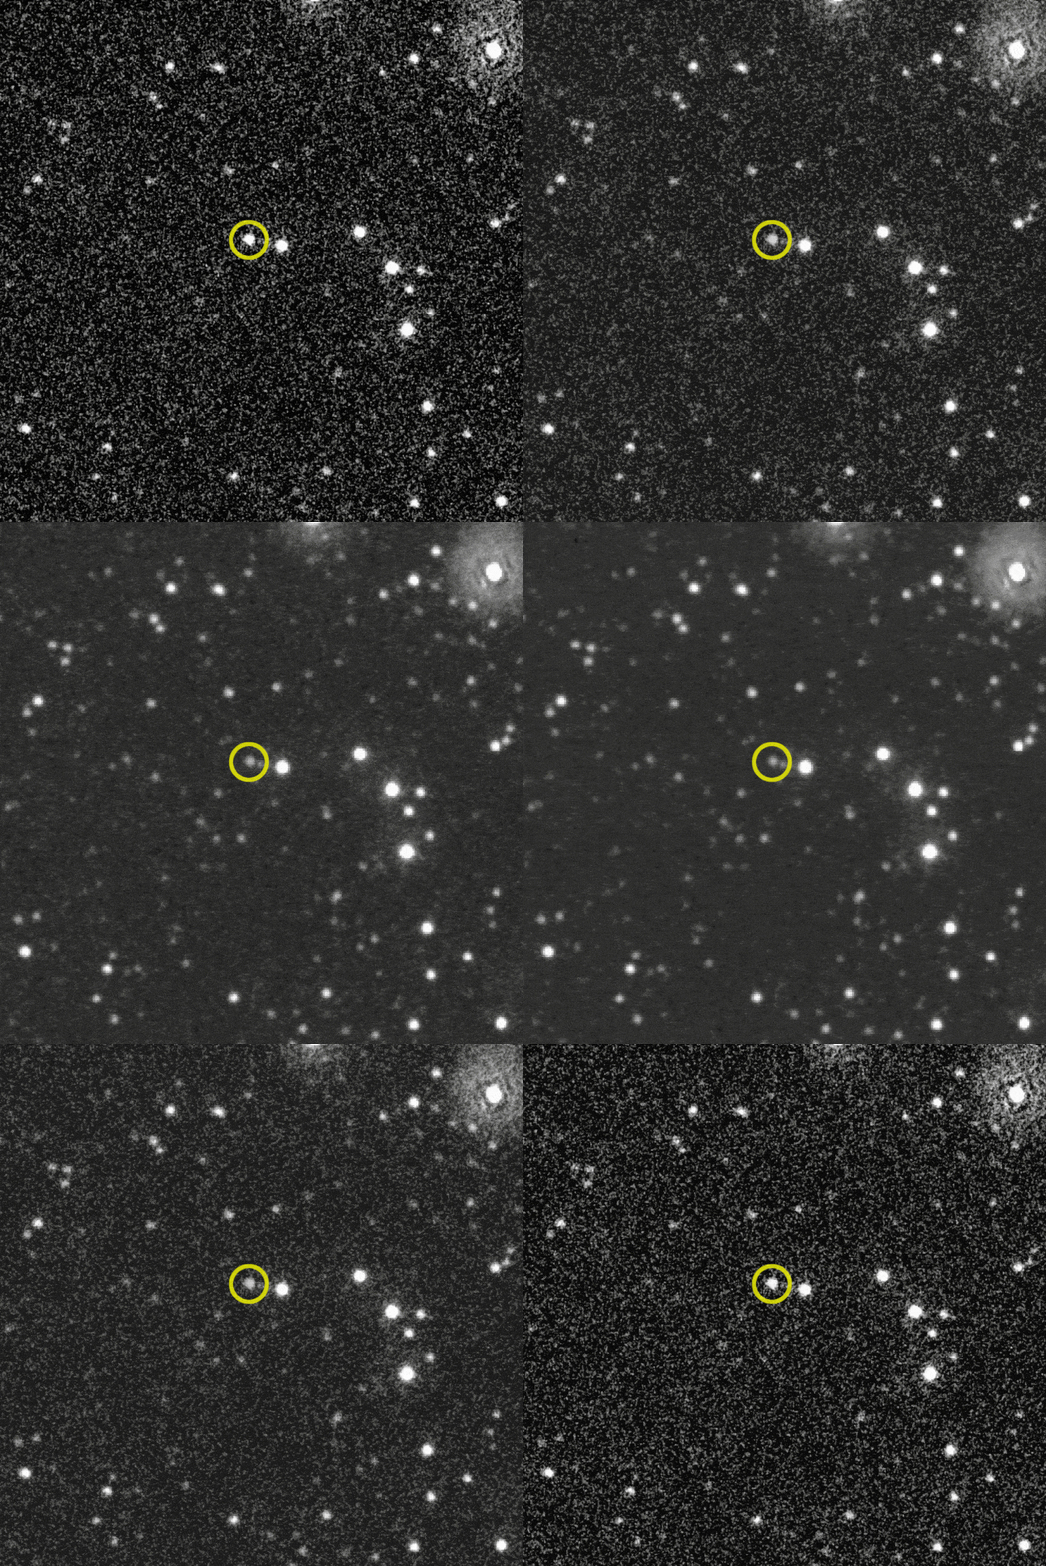
Images taken in visible light by Swift’s Ultraviolet/Optical Telescope show how the afterglow of GRB 221009A (circled) faded over the course of about 10 hours. The explosion appeared in the constellation Sagitta and occurred 1.9 billion years ago. The image is about 4 arcminutes across. Credit: NASA/Swift/B. Cenko

The light from this ancient explosion brings with it valuable new insights into stellar collapse, the birth of a black hole, the behavior and interaction of matter near the speed of light, the conditions in a distant galaxy – and much more. Astronomers may not detect another GRB this bright for decades.

Fermi’s Large Area Telescope (LAT) detected the burst for more than 10 hours, according to a preliminary analysis. One reason for the burst’s exceptional brightness and longevity is that, for a GRB, it lies relatively close to us.

“This burst is much closer than typical GRBs, which is exciting because it allows us to detect many details that otherwise would be too faint to see,” said Roberta Pillera, a Fermi LAT Collaboration member who led initial communications about the burst and a doctoral student at the Polytechnic University of Bari, Italy. “But it’s also among the most energetic and luminous bursts ever seen regardless of distance, making it doubly exciting.”