Tuesday, January 03, 2023

Italy's pasta row: A scientist reveals how to cook spaghetti properly and save money

Italy's pasta row: a scientist on how to cook spaghetti properly and save money
Credit: Nitr via Shutterstock

Italians are notoriously—and understandably—protective of their cuisine, as regular arguments about the correct toppings for pizza or the appropriate pasta to use with a Bolognese ragu will attest.

So it was hardly surprising that, when a Nobel Prize-winning Italian physicist weighed in with advice about how to cook pasta perfectly which seemed to upend everything the countries' cooks had been doing in the kitchen for centuries, it caused an almighty row.

Professor Giorgio Parisi—who won the 2021 physics Nobel for "the discovery of the interplay of disorder and fluctuations in  from atomic to planetary scales"—suggested that turning off the heat midway through cooking pasta, then covering with a lid and waiting for the residual heat in the  to finish the job, can help reduce the cost of cooking pasta.

In response, Michelin-starred chef Antonello Colonna claimed this method makes the pasta rubbery, and that it could never be served in a high-quality restaurant such as his own. The controversy quickly spilled over into the media, with several food and science heavyweights contributing.

But for those of us at home trying to save our pennies while cooking pasta, is Parisi's method really cost effective? And does it really taste that bad? Inspired by the thought of saving some money, students Mia and Ross at Nottingham Trent University took to the kitchen to cook pasta in different ways, helping to pick apart the tangled strands of this question.

What happens when you cook pasta?

The first thing to ask is what actually happens when we cook pasta. In the case of dried pasta, there are actually two processes which typically take place in parallel. First, water penetrates the pasta, rehydrating and softening it within ten minutes in boiling water. Second, the pasta heats up, causing the proteins to expand and become edible.

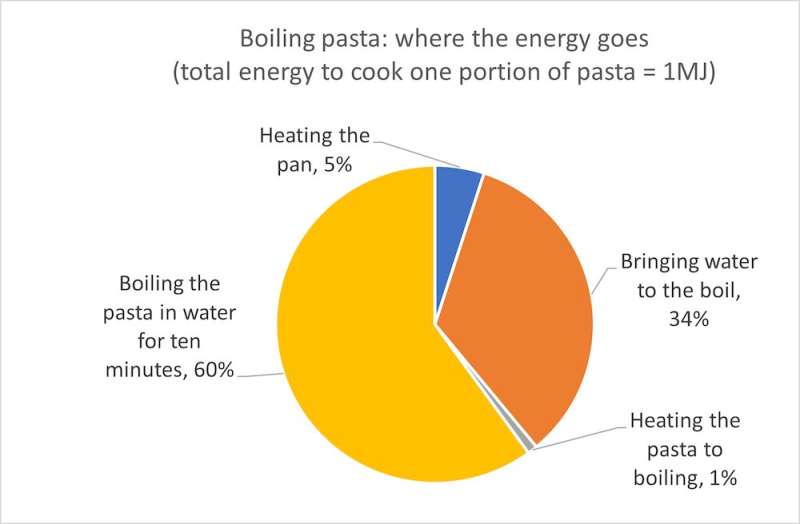
The standard cooking method plunges 100g pasta into 1 liter of boiling water for 10 to 12 minutes, depending on its thickness. The breakdown of energy use is depicted in the graphic below, which can be converted into a total cost using information on the price of energy and the efficiency of the stove.
Italy's pasta row: a scientist on how to cook spaghetti properly and save money
Cooking pasta: the energy lowdown. Credit: David Fairhurst, Mia London and Ross
 Broadhurst/Nottingham Tent University, Author provided

At today's prices, the cost of cooking dried pasta on a ceramic hob comes in at 12.7p per serving, an induction hob at 10.6p, and a gas hob at 7p. So given the UK's love of pasta, with on average everyone eating one portion per week, we are spending £4,690,000 a week on cooking pasta.

It is clear from the graphic that around 60% of the energy is used to keep the water boiling. So anything that can be done to reduce the cooking time would have a significant impact on the overall cost. Parisi's method of turning off the hob midway and allowing the pasta to cook in the residual heat will halve the cooking cost, a saving of around 3p. This method will be even more effective on ceramic hobs as unlike gas and induction, they are slow to cool down.

However, by separating the processes of rehydration and heating, it is possible to reduce the cost even further. Dried pasta can be fully rehydrated by pre-soaking it in cold water for two hours. This is a process that requires no energy at all and saves an additional 3p.

The pasta then needs to be dropped into boiling water to heat it through—and there are further savings to be made here too. Chefsbloggers and scientists report that the quality of the cooked pasta is unaffected by significantly reducing the amount of water. We found that halving the water resulted in perfect pasta, but reducing to one-third was unsatisfactory. Starch is released during cooking and if there is insufficient water the concentration builds up, leaving clumps of unevenly cooked pasta—although regular stirring of the pot may well improve matters.

The graphic shows that the second-largest energy requirement is from bringing the water to the boil. Again, there is another saving to be made here.

It turns out that the granules of protein in pasta dissolve above 80ºC, so there is no need to bring the pan to a "rolling boil" at 100ºC, as is often advised. Gentle simmering is sufficient to cook the pasta completely, providing an additional saving of around 0.5p.

We also investigated using a microwave to heat the pre-soaked pasta. Microwaves are very efficient at heating water, but in our experiments this produced the worst pasta of all. Definitely not one to try at home.

How to do it, and save money

The prize for the most efficient method of cooking dried  is to pre-soak it in cold water before adding it to a pan of simmering water or sauce for one to two minutes. Keeping a lid on the pan is another simple thing you can do. Adding salt, while making minimal difference to the boiling point, does significantly improve the taste.

We aren't all Michelin-starred chefs or Nobel Prize-winning physicists, but we can all make a difference in the way we  to reduce energy bills while still producing great-tasting food. Now it's up to you to experiment with these methods until you find a combination that makes your cooking more economical while also saving your pennies.

Provided by The Conversation 

This article is republished from The Conversation under a Creative Commons license. Read the original article.The Conversation


In defense of rodents: Why healthy ecosystems need them

In defence of rodents—why healthy ecosystems need them
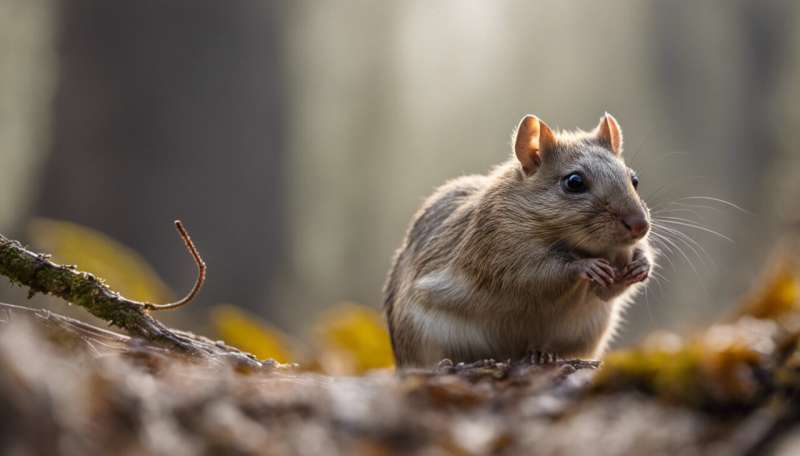
A grizzled giant squirrel, native to Sri Lanka. Credit: Martin Mecnarowski/Shutterstock

You might think you have the measure of the rodent family. Perhaps just the word "rodent" conjures images of invasive rats, those urban denizens accused of spreading pathogens and parasites, chewing through wires and spoiling food.Most rodents are, in fact, more elusive and inhabit quiet corners of rainforests, mountains, deserts and rivers. These small mammals have filled a niche in nature for at least the last 56 million years, and from shrew-rats to true rats and hamsters to beavers, rodents play an important role in ecosystems worldwide.

Yet, a huge number of  species are on the brink of extinction. Eking out an existence in shrinking habitats and under threat from persecution, pollution and , rodents are overwhelmingly neglected by research and funding that might help to protect them. We are three conservation scientists determined to show that this is a mistake—and change your mind about these misunderstood creatures.

More than vermin

Roughly 40% of all  are rodents. There are around 2,375 living species, spanning mice, rats, squirrels, hamsters, voles, porcupines, lemmings, beavers, chinchillas, chipmunks and more. The number of recognized rodent species is still growing and at a seemingly faster rate than other mammal groups including bats, primates and carnivores. Between two comprehensive checklists of global mammal species produced in 2005 and 2018, an additional 371 rodents were officially recognized.

New discoveries are often the result of genetic work that has identified multiple similar-looking species previously described as one. Nonetheless, from the 3g desert-dwelling jerboa to the 50kg semiaquatic capybara, rodents are a remarkably diverse bunch.

In defence of rodents—why healthy ecosystems need them
Dormice can hibernate for six months or longer. Credit: Slowmotiongli/Shutterstock

This diversity allows rodents to play numerous roles in Earth's ecosystems. Rodents have a hand (or rather, paw) in determining which plants propagate and where by eating and dispersing their seeds. Beavers engineer entire ecosystems with their dams which help to purify  and moderate floods and droughts, while burrowing  create subterranean habitats used by other wildlife. Rodents are also an invaluable link in the food chain, sustaining predators which include birds of prey, wolves, snakes and even spiders.

We shouldn't forget that humans have long benefited from relationships with rodents. Agoutis in South America are one of the few animal groups capable of cracking open the capsules of the Brazil nut fruit. By hoarding excess seeds, agoutis help disperse their trees throughout the Amazon rainforest and support the global production of Brazil nuts, which is almost entirely dependent on wild harvests. African giant pouched rats can detect tuberculosis in saliva, hidden land mines, survivors trapped under rubble and pangolins smuggled in shipping containers. By studying the resistance of naked mole-rats to cancer, scientists hope to improve our understanding of the disease and its potential treatment. It's clear that the loss of a rodent species—even the smallest—can have cascading consequences for humans and the environment.

Underfunded, understudied and disappearing

Worryingly, at least 15% of  are threatened with extinction. More than 100 are among the top 560-ranked Evolutionarily Distinct and Globally Endangered (EDGE) mammals, meaning that while they are threatened, they also have few or no close relatives. If an EDGE species were to disappear, there would be nothing really like them left.

For many more species, scientists simply don't know enough to understand how they are faring: the population trend (whether they are stable, declining or increasing) of at least a thousand rodents is unknown. Even when it comes to zoonotic disease, there are substantial gaps in our knowledge of viruses in rodents and how outbreaks might be influenced by their ecology or population dynamics. The reality is that rodents receive very little scientific attention beyond their discovery and naming.

Rodents are a hard sell outside science too. Studies on the public perception of wildlife demonstrate that rodents are generally the least favored group. Compared to larger-bodied mammals, rodents and  are referred to on Twitter substantially less, not considered as interesting by zoo visitors and inspire fewer donations to conservation schemes. Even the bigger rodents such as beavers are outranked by large carnivores, birds, moths and bees in public preference surveys.

It is no surprise then that some species have already fallen through the cracks. The little Swan Island hutia, a rodent once endemic to Caribbean islands of the same name, was driven to extinction in 1960 by introduced cats. The Candango mouse disappeared during a similar period in central Brazil, where its forest habitat was almost entirely paved over. Australia's Bramble Cay melomys was declared extinct as recently as 2016 after rising sea levels gradually degraded the tiny coral island on which it lived. The loss of this rodent is thought to be the first modern mammal extinction caused by climate change.

Some rodents remain unstudied for so long that it's not known whether they still exist. Gould's mouse, a species also native to Australia, was thought to be extinct for 150 years before it was recently rediscovered surviving on islands off of western Australia. Another, the Namdapha flying squirrel, was thought to be extinct in the wild until a single specimen was collected in 1981 from northeast India. The species is now listed as critically endangered and is currently known only from informal sightings dated decades ago. Of the world's rediscovered species, the data shows that rodents remain missing for the longest time, probably because there are not enough people looking for them.

Even well-monitored or well-known rodents aren't safe. The common hamster is listed as critically endangered, and could die out in coming decades unless its decline is reversed. Its popular pet cousin, the golden (or Syrian) hamster, is also endangered in the wild, clinging on to its last fragment of habitat.

Many rodents can adapt well to landscapes altered by people, but others cannot adjust to this rat race and exist only in dwindling and deteriorating wildernesses. It is likely that we have already lost many species which we never even knew existed.

The first step towards recovering many threatened yet overlooked species may be to alter our own perceptions and behavior. For the little guys like rodents, this means appreciating that even though they are perhaps not as glamorous or mighty as many flagship conservation , we are far more dependent on their biodiversity than we might imagine.

Provided by The Conversation 

This article is republished from The Conversation under a Creative Commons license. Read the original article.The Conversation


DNA in the water shows South African scientists where to find a rare pipefish

DNA in the water shows South African scientists where to find a rare pipefish
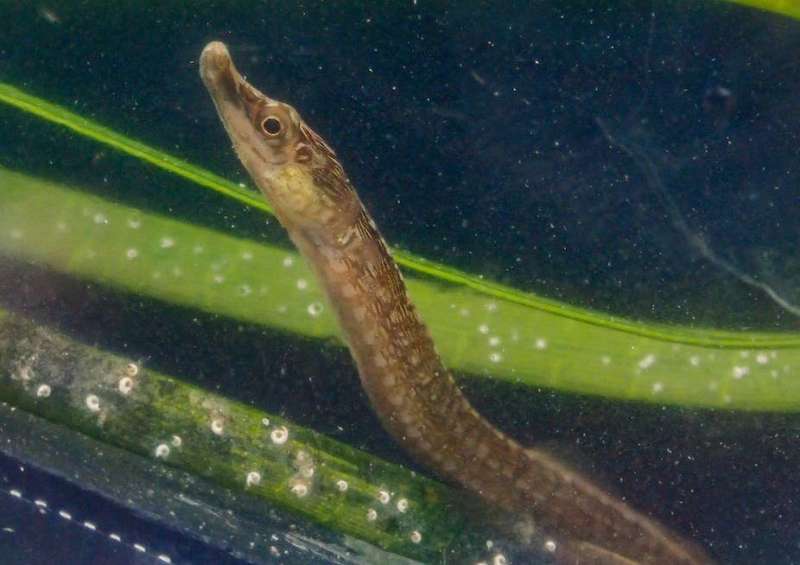
The estuarine pipefish is not easy to find - it camouflages itself amid seagrass. 
Credit: Louw Claassens

Keeping track of the world's wildlife populations is fundamental to conservation efforts in the face of the continued deterioration of global biodiversity.

But some species are harder to study than others. Some , for instance, elude detection because they are extremely rare and sparsely distributed.

One especially elusive example is the estuarine  (Syngnathus watermeyeri). It is the only critically endangered syngnathid (the family of fishes that includes seahorses, pipefishes and seadragons) in the world. It is only found on the African continent and is endemic to just a few estuaries on the Eastern Cape of South Africa.

It has long been apparent that the estuarine pipefish is threatened. The species was classified as extinct in 1994 before being rediscovered in 1996. There are an estimated 100–250 remaining globally, but not much more is known.

The biggest challenge is keeping count. Population survey methods that work for other species—such as netting, counting and tagging—are simply not as effective for the elusive S. watermeyeri. They are just too small: adults reach between 10cm and 15cm and they are experts at camouflaging amid seagrass to avoid detection.

New technologies may solve the problem. One is environmental DNA (or eDNA). This refers to  derived from organisms—skin cells, blood, feces and so on—that can be extracted from  such as water, soil, ice or air. Since it degrades within days or weeks in aquatic environments, eDNA can provide an up-to-date snapshot of the biodiversity within a region. Analyzing this material can reveal the presence of rare species that may have otherwise remained hidden.

Our recent study set out to determine whether eDNA is a good tool for monitoring estuarine pipefish. The answer is a resounding "yes." It is far more successful at detection than the conventional method of seine netting.

We argue that eDNA holds great value as a complementary approach or a method for investigating species' presence in a particular environment.

Our research was about testing eDNA as a monitoring method, not about updating the estimates on pipefish. But it will help identify priority areas for their conservation, and which habitat characteristics are important for supporting this species.

This knowledge represents a crucial first step to establishing a long-term monitoring and recovery plan for the estuarine pipefish. Now that we know where it is and what habitat it needs, we can identify possible locations to reintroduce the species and then use eDNA to monitor the success of these programs.

DNA in the water shows South African scientists where to find a rare pipefish
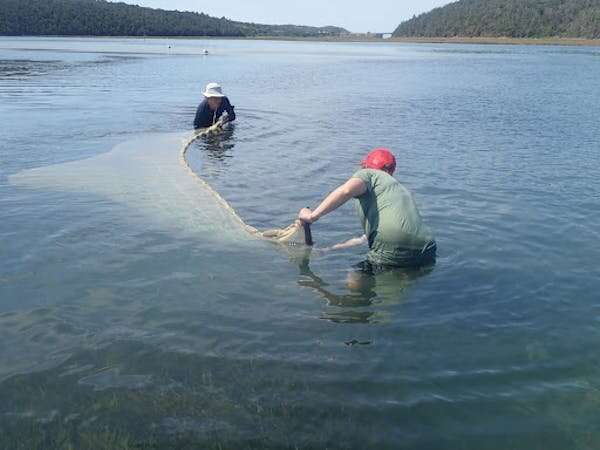
Researchers at work in an estuary, trying to net pipefish. Credit: Nina de Villiers

The search

In the spring of 2019, we set out to look for the pipefish and test the use of eDNA as a monitoring tool for this rare species. We conducted seine netting surveys simultaneously to compare the sensitivity of both methods for estuarine pipefish detection.

We sampled all estuaries in South Africa's Eastern Cape province where the species had been recorded historically: the Kariega, Bushmans, Kasouga, and East and West Kleinemonde estuaries. A total of 39 sites were visited across these five estuaries. At each site, water samples were collected for eDNA, and seine net sweeps were carried out.

It proved to be a laborious task to sweep the seine net through thick beds of seagrass and seaweed while sinking into the muddy  banks, but the method was successful. With this method alone, the estuarine pipefish was found at five sites—four within the Bushmans Estuary and one site in the Kariega Estuary.

We didn't immediately know what the  would reveal—they had to be processed. The samples were filtered shortly after collection and taken to the TrEnD laboratory at Curtin University in Perth, Western Australia, which has been specially set up for trace and environmental DNA work like this.

A species-specific assay developed for this study was used to detect the estuarine pipefish in our samples. Following extensive laboratory work and data analysis, this approach proved to be a success: we successfully detected S. watermeyeri using eDNA at 20 out of 30 sites within the Kariega and Bushmans estuaries.

Some populations already lost

Our eDNA findings held some bad news about the estuarine pipefish. The study reinforced several others that have suggested S. watermeyeri is extinct at the Kasouga and East and West Kleinemonde estuaries. This highlights the importance of conserving the Kariega and Bushmans estuaries as a sanctuary for the Critically Endangered syngnathid.

We also confirmed a detail noted in previous surveys: the pipefish is far more likely to be found where there are dense beds of Zostera capensis (a seagrass endemic to southern African estuaries). And we identified Codium seaweed, which formed large free-floating beds among the Zostera seagrass, as an important pipefish habitat.

These findings point to the delicate ecosystems in estuaries—coastal waterbodies found where rivers meet the sea. It underscores how estuaries provide crucial habitats for plants and creatures. Unfortunately, estuaries are under great pressure, particularly from pollution.

This research now means that scientists have a much better picture of the estuarine pipefish's status. This provides a foundation for developing a long-term monitoring program for the . It also exemplifies how new technologies, like eDNA, will be the key to guiding the conservation of the world's biodiversity.

Provided by The Conversation 

This article is republished from The Conversation under a Creative Commons license. Read the original article.The Conversation


Green streets: Why protecting urban parks and bush is vital as our cities grow and become denser

walk in the park
Credit: Unsplash/CC0 Public Domain

More than half of the world's population lives in cities. In Aotearoa New Zealand, the proportion of people who live in towns or cities exceeds 86%. With our lives increasingly lived in urban environments, it's vital for our personal well-being—and the planet's—that city planners find ways to foster a connection with nature.

The evidence is clear—people need direct,  with nature to care enough to protect it. As evolutionary biologist Stephen Jay Gould argued, "We cannot win this battle to save species and environments without forging an emotional bond between ourselves and nature as well—for we will not fight to save what we do not love. "

In our recently published study, we explored the perceptions and experiences of nature that Hamilton residents had in their city.

Hamilton City Council is responsible for 1,142 hectares of open space, including more than 200 parks and reserves. In 2019, the council outlined its goal to have 80% of households with access to a park or  within 500 meters of home.

Green spaces are any areas of unsealed  with some form of vegetation cover. We focused on three types—, parks dominated by native vegetation ("bush parks"), and parks dominated by introduced vegetation ("lawn parks," large expanses of mown lawn scattered with individual trees).

Residents took us on tours of different  around the city. During these visits, we asked them about the importance of these places, how they engaged with them and about their plant and animal encounters. We interviewed 21 residents—seven restoration volunteers, seven people who frequently visited bush parks, and seven who visited lawn parks.

We were particularly interested in how people perceived urban green spaces and the benefits they got from them. We also looked at the experiences and connection gained from different natural environments.

Ringing with birdsong

Kaelin was one of the Hamilton residents who took us on a tour of her garden and local , one of Hamilton's many branching gullies.

The gully was cool and quiet, the only sounds the murmurs of the tiny stream at its center and the occasional indignant cheeps of our fellow fantail. As bell-like flutes punctuated by rude coughs and gurgles announced the presence of a tui, Kaelin turned to me with a delighted smile and said,

"You can be down here in the right time of the year and you think, where am I? It's not the city, it's just ringing with birdsong."

Our interviewees described native bush parks as special places that provided a relaxing and restorative escape from city life. These green spaces, dominated by , were the ones respondents commonly identified as places to sit peacefully and observe nature.

Lawn parks, on the other hand, acted more as "backdrops" for other activities—picnics, sports or farmers' markets. Residential gardens, like bush parks, allowed for deeper observation and engagement with nature, but as private spaces, they didn't provide the social benefits that parks do.

The value of diversity

Lawn parks are the most common type of green space in cities. Yet our study highlights that participants valued a diversity of green spaces that would meet a range of needs—their own, those of their community and those of other creatures such as birds, bats and weta.

Interviewees voiced a desire to have spaces in cities where unique New Zealand plants and animals could thrive. Respondents enjoyed sharing their parks and gardens with birds, bats and insects, recognizing these animals contributed to the meaning of the place.

Creating habitat in cities for wildlife, however, was only one of the multiple purposes of green spaces that respondents believed were important. They wanted to see a variety of parks that meet a range of community needs.

Just as respondents held multiple priorities for their own gardens, not always just as habitats for native flora and fauna, interviewees also wanted urban green spaces to support multiple uses and not serve exclusively as wildlife habitat.

The threat of densification

But the benefits of green spaces are threatened by the loss of parks and gardens to redevelopment and densification.

New Zealand's ongoing housing crisis has intensified political debates about , and Hamilton is no different.

The council recently completed consultation on significant changes to density rules in Hamilton's central city and surrounding areas. The plan will allow three homes of up to three storeys to be developed on most properties, though the council says it is committed to maintaining its public green spaces.

As urban populations continue to rise, our research supports a renewed call for the importance of reserving space for parks and nature in cities. Instead of being a dispensable luxury, green  is crucial for the health and well-being of both people and native species.

Finding ways to foster personal experiences of green spaces, and the plants, animals, people and stories that provide meaning, is one way to increase  dwellers' emotional involvement with local nature. Such subjective bonds can spur the motivation required for people's everyday actions to nurture and protect what they love.

Provided by The Conversation 

This article is republished from The Conversation under a Creative Commons license. Read the original article.The Conversation


Scientists dig deep and find a way to accurately predict snowmelt after droughts


Scientists dig deep and find a way to accurately predict snowmelt after droughts
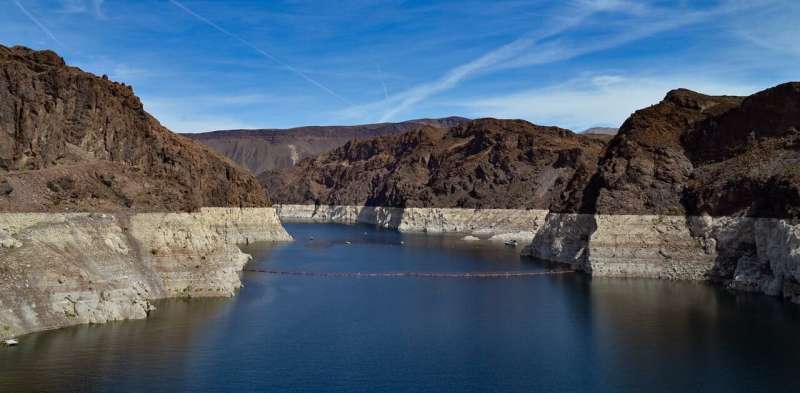
Following historic drought in 2021, reservoir levels dropped down in the Hoover Dam on the
 Colorado River, which gets its waters from the melting snowpack from the Rocky
 Mountains of Colorado and Wyoming. Credit: pxhere.comCC BY-SA

Where does your water supply come from?

If you live near mountains, for instance in British Columbia, a lot of your water probably comes from mountain snowpack. Over 1.9 billion people globally rely on the snow melting and running off from these mountain snowpacks for their water supply.

Accurate predictions of this annual trend is critical for water supply planning. And forecasting models often rely on the historical relationship between mountain snowpack and the subsequent water supply.

However, in times of unprecedented drought and a changing climate, these forecasting models seem to no longer be reliable. Following an intense drought in California in 2021, snowmelt from mountain snowpack delivered significantly less water than historical models predicted, meaning that reservoirs remained drier than anticipated. For the first time in 100 years, water supply models were wrong.

In an attempt to address the gaps in the , we recently developed an updated water supply forecasting model that considers additional factors, like  deficits in the soil and bedrock. This new  significantly improves the accuracy of water supply forecasts following drought.

What are existing water supply models missing?

Models used for forecasting snowmelt typically consider winter rain and snowpack. But it turns out that water absorbed by the ground matters too. The amount of water absorbed into the soil and bedrock varies from year to year and is especially impacted by drought.

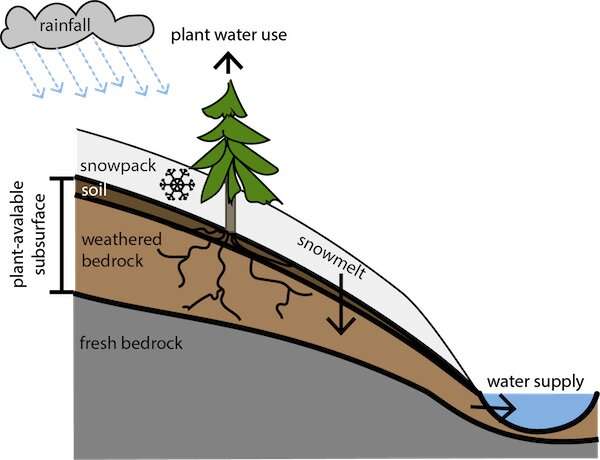
When  or rain falls, almost all of it goes underground first before heading downstream to water supply systems . The water storage processes below the surface of the ground are key to understanding the ultimate fate of rain and snow in the mountains.

The below ground environment is made up of complex layers of soil, fractures and weathered bedrock that can store, detain and transport water. The details of these processes are complicated, but the overall effect can be likened to a giant sponge.

Scientists dig deep and find a way to accurately predict snowmelt after droughts
A diagram showing how water gets from snowpack or rain to water supply systems. Rain
and snowmelt seep into the ground. Plants draw water from this region. Once the 
subsurface is wet, the water flows downstream to water supply systems. 
Credit: Dana Lapides

Over the summer, the ground dries out and it gets wet again with the arrival of rain and snowmelt in winter and spring. Once the ground is wet enough, it starts to drip. This dripping water enters the groundwater and streams and eventually goes into the water supply systems.

How much water drips depends on how much snowmelt and rain is received, which is included in forecasting models. It also depends on how dry the subsurface was to begin with, which is not traditionally included in forecasting models.

Plants use a lot of water

How dry the subsurface is this year can depend on how much water the plants used last year (or even over the last few years). In hotter, drier years, plants can use more water from underground, causing the subsurface to dry out more.

Recent studies show us that trees routinely dry up not just soils but also weathered bedrock meters below the surface.

Scientists are still struggling to identify how dry these mountain environments can get and how far below the surface they dry. With a drier subsurface at the start of the year, more snowmelt is needed before water starts to flow downstream to water supply systems.

As droughts become more frequent and intense with , this process could become more important even in regions that historically haven't faced much drought.

Measuring the moisture underground

Directly observing the moisture levels of the ground's subsurface is difficult, especially when it's stored in weathered bedrock, which can extend many meters below the ground surface and be challenging to observe.

Scientists dig deep and find a way to accurately predict snowmelt after droughts
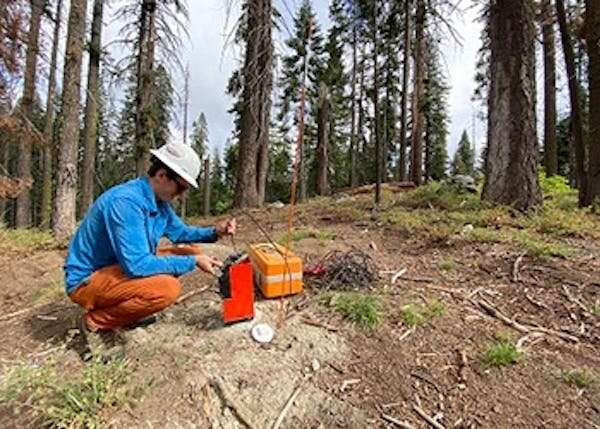
A USDA Forest Service employee uses an instrument to measure the moisture conditions
 deep underground. Credit: Jamie Hinrichs/USDA Forest Service

In our research, we found the most accurate measurements by lowering geophysical instruments down boreholes and taking water content readings at different depths. By comparing these readings over time, we observe how the subsurface dries out and gets wet again.

However, this intensive monitoring is nearly impossible to do over large areas.

While we can't look directly underground everywhere, we can track how much water enters (rain and snowmelt) and leaves (plant water use) the ground using satellite-derived data.

By taking a running account of water going in and out of the ground, we can estimate how dry the subsurface is—a metric we call the water storage deficit.

Water supply models must dig deeper

Our newly-developed water supply forecasting model accounts for water storage deficits in both soil and bedrock. This has improved post-drought forecast accuracy substantially, taking the probability of error in the calculation of predictions from 60% to about 20%.

Since we can calculate deficits before spring snowmelts, they serve as an early warning sign and can aid water management strategies.

As the climate changes, the  supply challenges in California foreshadow issues that will become increasingly prevalent in British Columbia and other regions reliant on mountain snowpack. Using updated forecasting models in the future can help these regions better prepare for continued water shortages even when snowpack seems normal.

Provided by The Conversation 

This article is republished from The Conversation under a Creative Commons license. Read the original article.The Conversation


Europe's 'pyroregions': Summer 2022 saw 20-year freak fires in regions that are historically immune

by Luiz Felipe Galizia, François Pimont, Julien Ruffault, Renaud Barbero and Thomas Curt, The Conversation

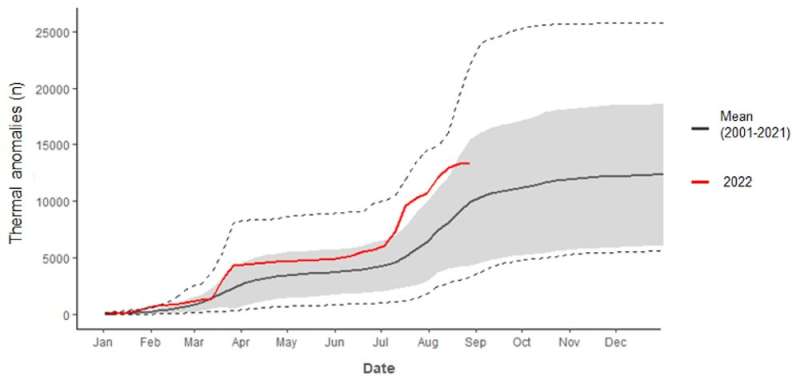
Daily cumulative thermal anomalies across Europe, derived from MODIS Terra/Aqua sensors over the period 2001–2022 (last updated on 31 August 2022). The grey zone corresponds to the standard deviation (the dispersion of the data with respect to the mean) and the dotted lines indicate the maximum and minimum values over the historical period. Credit: Luiz Felipe Galizia, François Pimont, Julien Ruffault, Renaud Barbero and Thomas Curt

Over the summer of 2022, the European "fire season" made headlines, and the burned area was said to be "unprecedented" in many countries. However, an examination of historical climate and fire data provides some important context.

Several conclusions were drawn from the European Forest Fire Information System (EFFIS), but this dataset is probably not the most appropriate given that its methodologies are constantly being updated. This hampers the analysis of trends over the historical period or the focus on a specific year.

Satellite images have been used for global and regional analysis due to their spatial and temporal consistency, but they may underestimate fires, especially small ones (less than 100 ha). However, the data is homogeneous in time, which is important for comparing fire seasons over long periods. In our research, we used thermal anomalies from satellites, a near-real-time proxy of fire activity, widely used in previous studies.

The 2022 European fire season

Overall, when aggregating European data (see below) and cumulating the number of thermal anomalies from the beginning of the year, 2022 lies above the long-term average but did not exceed the maximum value observed over the last 20 years. For example, cumulative thermal anomalies were much higher in 2003, 2007, 2012 and 2017, indicating that the 2022 fire season lies within the range of the historical period. This suggests that last summer's fire season was not unprecedented, contrary to the impression conveyed by the media.

What is causing extreme fire seasons?

Fire is a complex phenomenon that occurs when three conditions are met: there is an ignition source, fuel is available, and the fuel has low moisture. While the influence of the first two ingredients does not change much from one year to another, fuel moisture explains most of the variations in fire activity.
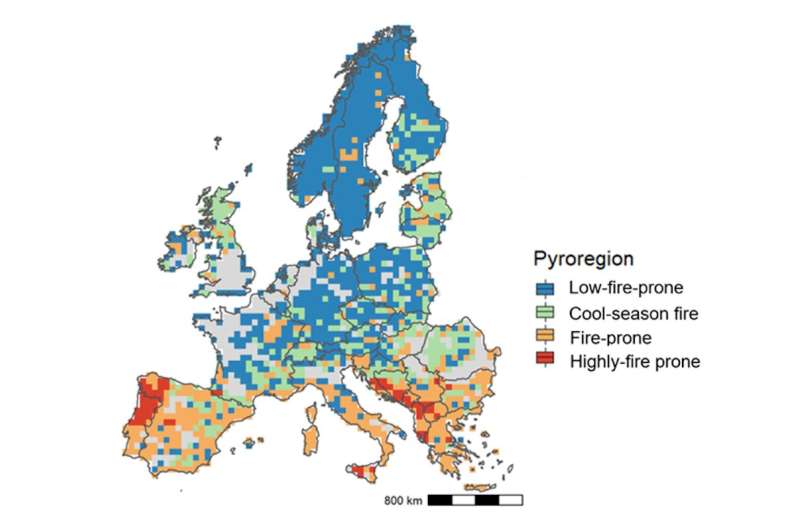
Distribution of ‘pyro-regions’ representing different fire characteristics across the continent. Regions with more than 80% non-combustible surface (urban and agricultural surface) are shown in grey. Credit: Luiz Felipe Galizia, François Pimont, Julien Ruffault, Renaud Barbero and Thomas Curt

Indeed, extreme fire seasons are usually associated with warm climate conditions that dry out the vegetation and create flammable landscapes. Conditions with strong wind may amplify the fire potential, which can be synthesized in the so-called fire-weather index.

Locally, fires depend on many unpredictable factors. To iron out these uncertainties and capture overall trends, the data has to be aggregated over larger areas, such as continents or countries. However, aggregating fires within geopolitical borders is rarely the most relevant method to assess natural risks. This is particularly true in Europe, which is very diverse in terms of climate, vegetation, and human activities.

Beyond political classifications, the concept of 'pyroregions'—covering areas with specific fire regimes—provides us with a better lens through which to apprehend fire's spatial heterogeneity. Pyroregions share similar characteristics, such as fire size, frequency, seasonality, and intensity, which ultimately determine fire impacts.

In a recent study, we presented a pan-European pyrogeography featuring four distinctive pyroregions across the continent. For instance, the southern Iberian peninsula experiences large but less frequent fires than northern Portugal featuring the highest fire frequency and burned area in Europe. In mountainous and traditionally pastoral regions, such as the Pyrenees, parts of the Alps, and Scotland, burned area can be substantial but originates mostly from winter or spring fires ("cool season" fires) due to pastoral and agricultural activities and normally do not put ecosystems at risk.

These pyroregions do not follow administrative, ecological or climate borders, and can be seen as a practical and straightforward way of describing fire patterns across Europe. Understanding similarities and differences among fire regimes are important to inform fire management and prevention.

Europe's 2022 saw freak fires in cooler regions

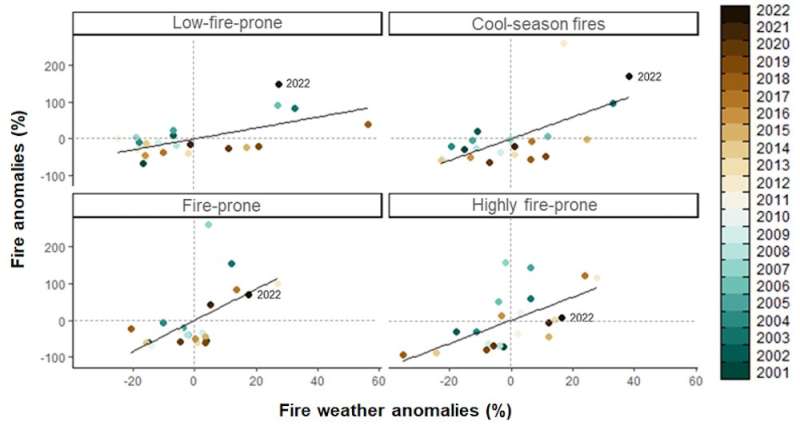
From June to August 2022, persistent heatwaves unfurled across parts of northwestern and central Europe, breaking temperature records and fanning flames. This is evident when aggregating fire weather conditions and fire activity in terms of anomalies—deviation from the mean—over the historical period and across pyroregions (see below).
Climate and fire anomalies for each pyroregion. Relative difference in the number of active fires from MODIS Terra/Aqua sensors and fire weather index (FWI) with respect to the historical mean (2001-2021) from June to August. The lines indicate the linear relationship between fire and climate anomalies; dashed lines indicate normal conditions. Credit: Luiz Felipe Galizia, François Pimont, Julien Ruffault, Renaud Barbero and Thomas Curt

In sum, the year 2022 saw "unprecedented" fires in the low-fire prone pyroregion (the least affected usually), with the highest number of fires detected in the last 20 years; 2022 comes second in the cool-season fire pyroregion, usually subject to winter fires. In contrast, fire activity is close to normal in the highly fire prone pyroregion in southern Europe, the most fire-prone region.

We think that this specificity—fire occurring mostly in regions that are historically relatively immune—helps to explain the 2022 media portrayals.

Will global heating remap pyroregions in the future?

Pyroregions also help simulate future changes of fire patterns as the planet warms. Global warming has been shown to increase the frequency and magnitude of fire weather conditions as observed during 2022.

In a new study (not yet peer reviewed), we found an increase in fire across Europe under global warming. The findings are in line with previous research that projects an increase across southern Europe. For instance, we found an increase in the burned area exceeding 50% across the northern Iberian Peninsula beyond 2°C warming above pre-industrial levels. Our analysis also showed large increases in fire frequency, intensity, fire-season length, and percentage of large fires.

Projections indicate an expansion of fire-prone pyroregions in southern Europe, ranging from 50% to 130% under 2°C and 4°C global-warming scenarios. Under the 4°C scenario, an increase in the burned area, fire intensity, and lengthening of fire period up to three months in some parts of the Balkans, northern Iberian Peninsula, Italy, and western France. In the absence of mitigation or adaptation measures, this expansion may overwhelm national fire suppression capacities and cause substantial social and ecological impacts.

Finally, the abandonment of certain traditional agricultural practices, such as extensive livestock farming, are increasing the forest area and the quantity of biomass available for fire in southern Europe. This phenomenon, combined with urban sprawl and the development of wildland-urban interfaces, will inevitably increase our exposure to fire.

Provided by The Conversation

This article is republished from The Conversation under a Creative Commons license. Read the original article.

Explore further