Saturday, January 14, 2023

Greenhouse gas concentrations further increased in 2022, finds analysis of global satellite data

Greenhouse gas concentrations further increased in 2022
Time dependence of the concentration of carbon dioxide and methane since 2003. 
Credit: Institute for Environmental Physics at the University of Bremen

Preliminary analyses of global satellite data by environmental researchers at the University of Bremen show that atmospheric concentrations of the two important greenhouse gases carbon dioxide (CO2) and methane (CH4) continued to rise sharply in 2022. The increase in both gases is similar to that of previous years. However, the increase in methane does not reach the record levels of 2020 and 2021.

The Institute of Environmental Physics (IUP) at the University of Bremen is a world-leading institute in the field of evaluation and interpretation of global satellite measurements of the greenhouse gases  (CO2) and methane (CH4) and other atmospheric trace gases that are of great importance for climate and air quality.

The institute leads the GHG-CCI greenhouse gas project of the European Space Agency's Climate Change Initiative (ESA) and provides related data to the European Copernicus Climate Change Service C3S and the Copernicus Atmospheric Monitoring Service CAMS. The latest Copernicus communication on greenhouse gases (see link below) is based on  and analysis provided by IUP.

"The methane increase remains very high in 2022 at about 0.6%, but below the record levels of the past two years. Our guess for this is that on the one hand there have been more emissions, but at the same time the atmospheric methane sink has decreased. At just over 0.5%, the CO2 increase is similar to that of previous years," says environmental physicist Dr. Michael Buchwitz, summarizing the initial results.

Greenhouse gas measurements since 2002

Time series of greenhouse gas measurements from space begin in 2002 with the SCIAMACHY instrument on the European environmental satellite ENVISAT, proposed and scientifically leg by the University of Bremen. These measurements are currently being continued by Japanese (GOSAT and GOSAT-2) and American (OCO-2) satellites, among others.

The satellites measure the vertically averaged mixing ratio of CO2 and CH4. These measurements are referred to as XCO2 and XCH4, and they differ from the commonly reported measurements of near-ground concentrations. The data are reported in parts per million (ppm) for CO2 and parts per billion (ppb) for CH4. An XCO2 concentration of 400 ppm means the atmosphere contains 400 CO2 molecules per one million air molecules. "Methane increased by 11.8 ppb in 2022, CO2 by 2.1 ppm," Buchwitz said.

CO2 increases almost uniformly—in contrast to methane. In the years 2000 to 2006, the methane concentration was stable on average. Since 2007, however, methane has been rising (again), with particularly high rates of increase in recent years. The record levels in 2020 and 2021 are likely associated with a COVID-19-induced increase in the methane sink, but also with an increase in .

"Unfortunately, there are still many gaps in our knowledge of the diverse natural and anthropogenic sources and sinks of  and other ," Buchwitz says. "It is therefore still necessary to make optimal use of and further improve the existing system for global monitoring of climate-relevant parameters."

Provided by Universität BremenNASA cancels greenhouse gas monitoring satellite due to cost

Feds release bleak 2022 climate change data: Oceans warm, global temps among hottest on record

global warming
Credit: Pixabay/CC0 Public Domain

In one announcement after another this week, a grim accounting emerged of the world's extreme weather and climate disasters in 2022

The science leaves "no doubt" about the impacts of the warming climate, Bill Nelson, administrator of the National Aeronautics and Space Administration, said during a briefing Thursday. "Sea levels are rising. Extreme weather patterns threaten our well-being across this planet."

The nation's two  charged with weather and climate observations said in 2022:

  • Ocean heat reached a new high
  • Arctic sea ice was second lowest level ever recorded
  • Europe saw its second warmest year on record, but much of western Europe was the warmest ever

But when it comes to  and the impacts of climate change, there's no place like home. The U.S. led the world again last year in extreme weather events and disasters, the National Oceanic and Atmospheric Administration said on Tuesday.

Oceans get even warmer and saltier

The world's oceans—which absorb more than 90% of the world's excess heat—were again the hottest on record last year.

"Year after year we are breaking records for ocean heat content," Michael Mann, a climate scientist at the University of Pennsylvania, tweeted Wednesday. Mann was one of a team of 16 international researchers who published a paper Wednesday detailing last year's record  heat.

The hotter and saltier oceans are critical indicators of "profound alterations" taking place in energy and water cycles, the scientists wrote. "The inexorable climb in  is the inevitable outcome of Earth's energy imbalance, primarily associated with increasing concentrations of greenhouse gases."

If not for the large storage capacity of the oceans, the world would have warmed a lot more already, said Russell Vose, chief of the analysis and synthesis branch for NOAA's National Centers of Environmental Information.

World temperatures again among warmest on record

NASA and NOAA agreed global average temperatures in 2022 were among the warmest on record, with their data and calculations coming to slightly different conclusions.

Temperatures would have been even higher last year without La Nina keeping things cooler in the Pacific, said Gavin Schmidt, director of NASA's Goddard Institute for Space Studies.

  • It's been 46 years since the Earth had a colder-than-average year.
  • NASA put the global average temperature at 1.6 degrees above the baseline for 1951-1980 or fifth warmest, tied with 2015.
  • The European Commission's Copernicus website also ranked the year 5th warmest.
  • NOAA ranked 2022 the sixth warmest at 1.55 degrees above a baseline set between 1901-2000. It does not yet include the Arctic in its calculations.
  • La Nina likely contributed a .06 degree Celsius cooling effect on global average temperatures, Schmidt said.

There's almost a 100% chance that 2023 will also be among the top 10 warmest years on record, Schmidt said. And with conditions in the central Pacific Ocean potentially flipping to an El Nino, he and Vose said 2024 could be a contender for warmest year on record.

If the warming continues, the average temperature in a single year could soon top the 1.5 degree Celsius level the world hoped to avoid with the Paris Agreement, Vose said. "There's actually a 50-50% chance that we have one year in the 2020s that maybe jumps above 1.5."

Schmidt guessed the first year with 1.5 degrees warming will be an El Nino year, probably in the early 2030s, but, he said, the world may still be two decades away from sustained warming above 1.5 degrees.

18 billion-dollar disasters in US

"In the U.S. we have consistently had the highest count and the largest diversity of different types of weather and climate extremes that lead to billion dollar disasters," said Sarah Kapnick, NOAA'S chief scientist said Thursday.

The 18 billion-dollar disasters last year were the third most on record, behind 2020 and 2021. They included Hurricane Ian, the mega-drought in the west and a massive snowstorm across much of the country in December.

With a total cost of $165 billion, the 18 disasters made it the third most costly year on record behind 2017 and 2005, the years when Hurricane Harvey and Hurricane Katrina made landfall in the U.S.

At least 474 deaths were reported last year as a result of the billion-dollar disasters.

Hurricane Ian was the costliest disaster of 2022, with estimated damages so far at $112.9 billion.

How did US weather in 2022 compare to previous years?

It was:

  • The 27th driest year on record overall.
  • The fourth driest year on record in Nebraska.
  • The ninth driest in California, thanks to wetter than average conditions during the past two months.
  • Alaska's 16th warmest year and fourth wettest year.
  • An above average year for tornadoes, with 1,331.

(c)2023 USA Today

Distributed by Tribune Content Agency, LLC.

Changes in the approximation of snow for climate models using typical vegetation in the Northern Hemisphere

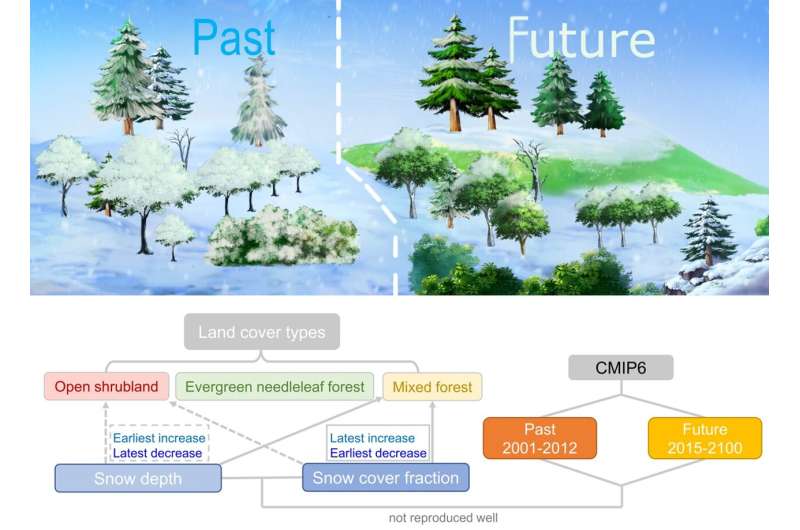
Changes in the approximation of snow by climate models over typical vegetation in the Northern Hemisphere
Schematic illustration of the study. Credit: Xiaodan Guan

Seasonal snow is sensitive to climate change, and is always taken as a signal of local climate changes. Against the background of global warming, the annual snow cover in the Northern Hemisphere is following an overall decreasing trend.

Since snow plays an important role in the  and has significant effects on atmospheric circulation, it is important to be able to simulate it well in climate models. However, as a process that operates on a small scale, snow needs to be approximated (or "parameterized"), and so many studies have attempted to improve the schemes that perform this parametrization of snow in climate models.

In the mid-to-high latitudes of the Northern Hemisphere, the impacts of  dynamics on vegetation show large differences among boreal biomes. Researchers from Lanzhou University, China, selected open shrubland, mixed forest, and evergreen needle leaf forest in the mid-to-high latitudes (45°–70°N), which are highly sensitive to snow changes.

Then, over a selected area of North America, Europe, Central Asia, and East Asia, they addressed the unique relationships between snow cover and snow depth for typical vegetation cover types and explored the reproduction of snow accumulation processes by model parameterization. The results have recently been published in Atmospheric and Oceanic Science Letters.

According to the findings of this study, there are different relationships between snow cover and snow depth for these three typical land cover types, and the relationships not only represent the characteristic changes in the processes of snow accumulation and snow melt, but can also be used in the model for predicting snow accumulation.

"However, partly because the influence of different land cover types is not fully considered, it was found that state-of-the-art  are unable to reproduce the relationships between snow cover and snow depth in both historical and future simulations, which will affect our understanding of the ecological impacts of snowmelt in spring," says Prof. Xiaodan Guan, the first and corresponding author of this paper.

Therefore, it is important to improve simulation results by considering the interaction between land cover types and snow processes in snow parameterization schemes.

More information: Xiaodan Guan et al, Changes in snow parameterization over typical vegetation in the Northern Hemisphere, Atmospheric and Oceanic Science Letters (2023). DOI: 10.1016/j.aosl.2022.100325

Provided by Chinese Academy of Sciences Snow depth trends revealed from CMIP6 models conflict with observations

New study explores the integration of wildlife and denser populations in urban planning

Research: Wildlife, Dense Populations Merged in Urban Planning
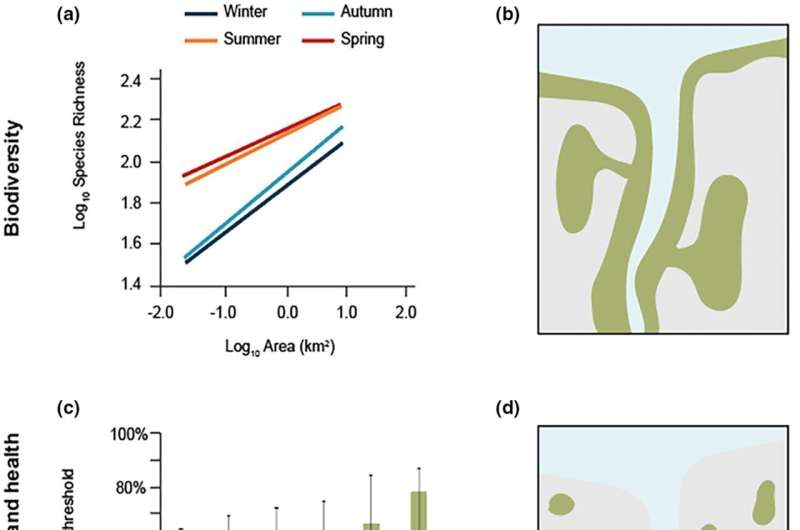
Relationship between nature, biodiversity, and ecosystem provision. (a) The relationship
 between habitat area and avian species richness in New York City (La Sorte et al., 2020).
(b) Conceptual drawing of urban development (gray) near a waterbody (blue) in a matrix of
 remnant habitat (green), with important biodiversity areas protected with corridors between
 them (McDonald, 2015). Note that small green spaces within the urban area (not shown) 
can improve matrix quality and help maintain biodiversity as well (Forman, 2008).
 (c) Neighborhood vegetation cover and the odds of having depression, from a study in
 southern England. Shown is the reduction in the odds of having depression, relative to 
the base case, if a vegetative cover threshold is exceeded (Cox et al., 2017). 
(d) Conceptual drawing of urban development (gray) near a waterbody (blue) in a matrix 
of green spaces (green), where each urban neighborhood is surrounded by green spaces
 that can provide benefits to residents (McDonald, 2015). Credit: People and Nature (2023)
. DOI: 10.1002/pan3.10423

A new study from The Nature Conservancy (TNC) explores how we can make our cities work better for people and wildlife, challenging longstanding assumptions about the merit of green spaces in our communities

Urban planners have long debated the value of building more  such as parks and gardens—amenities that benefit both humans and —into city plans, versus the creation of denser urban developments that allow the  to thrive beyond city limits.

However, a recent study published in the open-access journal People and Nature explores a new option of urban planning that allows the accommodation of dense populations common in cities, whilst simultaneously meeting the needs of the natural world more effectively.

The study, conducted by TNC, challenged established assumptions within the scientific and planning community. For example, tree cover percentage declining as cities become more densely populated, was proven to be less pronounced than previously thought.

By analyzing existing approaches, as well as highlighting cities already creating the right balance of people and wildlife, the study pioneers an alternative method of city design that allows for the accommodation of both denser populations as well as wildlife.

"This needn't be a zero-sum game," explains senior author and TNC lead scientist for nature-based solutions, Rob Mcdonald. "Having denser cities doesn't automatically mean less space for nature."

Elaborating on the study's recommendations, senior co-author Erica Spotswood describes the creation of the paper's "nine green interventions", inspired by cities like Singapore and Curibita in Brazil, that act as guidelines for " to balance denser development with the needs of nature. Encompassing everything from  to 'green' roofs."

More information: Robert I. McDonald et al, Denser and greener cities: Green interventions to achieve both urban density and nature, People and Nature (2023). DOI: 10.1002/pan3.10423


Provided by British Ecological Society Green streets: Why protecting urban parks and bush is vital as our cities grow and become denser

Madagascar mouse lemur retroviruses are diverse, similar to ones found in polar bears or domestic sheep

Madagascar mouse lemur retroviruses are diverse, similar to ones found in polar bears or domestic sheep
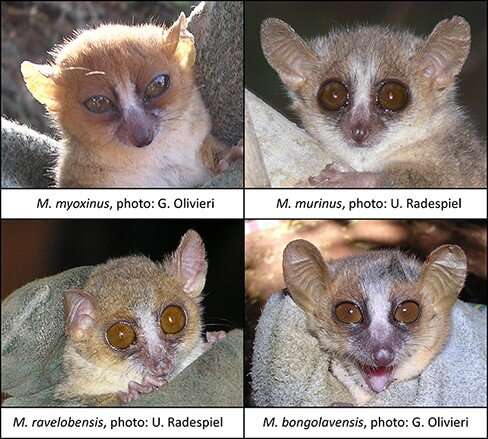
Photos of the four studied mouse lemur species: M. myoxinus, photo: G. Olivieri, 2003; 
M. murinus, photo: U. Radespiel, 2013; M. ravelobensis, photo: U. Radespiel, 2004;
 M. bongolavensis, photo: G. Olivieri, 2003. 
Credit: Virus Evolution (2022). DOI: 10.1093/ve/veac117

Madagascar is home to a unique biodiversity with a large number of endemic species, among those many lemur species, including the mouse lemurs. This diversity is also found in their retroviruses, a team led by scientists from the Leibniz Institute of Zoo and Wildlife Research (Leibniz-IZW) and the University of Stirling reports in the journal Virus Evolution.

They analyzed the mouse lemur genome and identified  of two classes that represent ancient infections of the mouse lemur germline. The viruses now behave similarly to lemur genes and are thus called  (ERVs). It was surprising that some of the identified  are closely related to viruses found in other, very different mammals such as  or . This suggests an intriguing and complex pattern of host switching of retroviruses, much more complex than previously thought.

For their analysis, the team collected  from four species of Malagasy mouse lemurs and screened them using high throughput sequencing. The scientists identified two gamma and three beta retrovirus sequences in the lemurs' genomes, representing ancient infections of the mouse lemur germlines. Since then, the virus DNA has been incorporated in the host genomes and the viruses are no longer active or infectious.

"We were surprised to find that one of the two identified gamma retroviruses was related to an ERV described in polar bears," states Dr. Sharon Kessler, a German Academic Exchange Service (DAAD) supported scientist and Assistant Professor at the University of Stirling. The polar bear virus is young from an evolutionary point of view whereas the lemur virus is old. "How these related viruses infected such geographically separated species is unclear," Kessler says.

There were further surprises among the beta retroviruses. A virulent retrovirus that infects domestic sheep called Jaagsiekte sheep retrovirus (JSRV), which also forms ERVs in domestic sheep, is thought to be a virus confined to domestic sheep, goats and their relatives—the first cloned sheep "Dolly" had to be euthanized after a JSRV infection and subsequent illness. The mouse lemurs have a closely related JSRV-like virus in their genome.

"This suggests that JSRV-like viruses have been more widespread among mammals and are considerably older than previously thought. Why they only show up in such disparate species and in such a punctuated way is curious," says Prof Alex Greenwood, head of the Leibniz-IZW Department of Wildlife Diseases, where the sample screening was conducted. Similarly, the team also identified a virus in the  related to retroviruses found in squirrel monkeys, vampire bats and marsupials.

"This group of viruses is becoming more interesting over time as more and more examples of similar viruses are being found in many places including very young ones that may still have currently infectious exogenous counterparts in nature," says Greenwood.

Much of the mouse lemur retroviral diversity observed is associated with non-primate viruses, suggesting a complex pattern of viral host switching around the time the ancestors of lemurs colonized Madagascar. Further studies of viral diversity will help to clarify the complex history of retroviral transmission among mammals.

Retroviruses are viruses that replicate by incorporating their genetic material into the genome of a host cell. If the  is a germ cell, the retrovirus can subsequently be passed on as an "endogenous" retrovirus and spread throughout a population as part of the host genome.

Repeated infections have resulted in endogenous retroviruses being ubiquitous in mammalian genomes, sometimes making up significant portions of the host genome. However, most  integrations are very old and already degraded and therefore inactive—their initial impact on host health reduced by millions of years of evolution.

More information: Sharon E Kessler et al, Long-term host–pathogen evolution of endogenous beta- and gammaretroviruses in mouse lemurs with little evidence of recent retroviral introgression, Virus Evolution (2022). DOI: 10.1093/ve/veac117

NASA is continuing to build the Titan Dragonfly helicopter, with a focus on its rotors

NASA is Continuing to Build the Titan Dragonfly Helicopter. Here are its Rotors
Researchers looking at the rotors under test at TDT. Credit: NASA / Harlen Caplen

Ingenuity, the helicopter assisting NASA's Mars Perseverance rover on its mission, has been a huge success. It gathered the achievement of the first controlled flight on another heavenly body, has performed spectacularly over its 28 flights and holds records for both speed and distance. But it might not for long, as a much bigger, more capable helicopter is currently under development. And when it eventually explores Titan in the next decade, it has an excellent chance to smash many of Ingenuity's records

That helicopter, known as Dragonfly, is currently still in development on Earth. But, it achieved a  recently by completing the testing of its rotor blades at a unique testing chamber located at NASA's Langley Research Center.

The Transonic Dynamics Tunnel (TDT) differs from a standard wind tunnel in several ways. Most helpful in this case is its ability to use gases other than just Earth-normal air. In the case of Dragonfly's test, the TDT filled itself with a heavy gas meant to mimic Titan's nitrogen-heavy atmosphere.

UT Video describing the Dragonfly mission.

In that environment, the  were twisted, turned, sped up, and slowed down. In some tests, one of the two rotors that make up one of Dragonfly's four coaxial pairs (for eight rotors in total). This was meant to mimic a potential failure scenario where one (or more) of the rotors don't work.

Dragonfly should be able to get along without several of its rotor blades being operational, making it much more robust than its smaller predecessor. In fact, the issue that will eventually kill Ingenuity (lack of electrical power) won't be as much of a problem for Dragonfly, as it uses a radioisotope thermal generator rather than a set of solar panels on its smaller predecessor.

In order to fulfill that promise, though, the rotors have to work well enough to allow Dragonfly to fly on another world, which is what the testing at the TDT is for. In the chamber, sensors, such as accelerometers and , were added to the rotors under test. Their data was used to validate computational fluid dynamic (CFD) models of how the rotors would perform.

UT makes the case for Titan.

Some of the CFD models used to simulate the stresses and strains on the rotors were initially developed to work with wind turbine farms. However, the data from the TDT matched those models used to design Dragonfly well, which suggests that the rotors should be able to withstand the challenging environment on Titan's surface.

It's a good thing, too, because the craft they have to hold up is massive. Sizing up to be about 12 ft long and 12 ft wide, Dragonfly looks like a typical terrestrial drone on steroids. Its eight rotors will allow it to hop from one place to another on the planet's surface, allowing it to collect data at various sites on the shrouded moon.

That  goal is still a long way off, though, as rotor testing is a very early step in the overall test program that the project will undergo. But the designers and engineers still have some time until the launch window of 2027. And even more time until the craft finally arrives at its destination in 2034. Until then, there is plenty more testing to do.

Provided by Universe Today 

Improving drone performance in headwinds


Enzymes from bacteria and fungi break down plastic

Enzymes from bacteria and fungi break down plastic
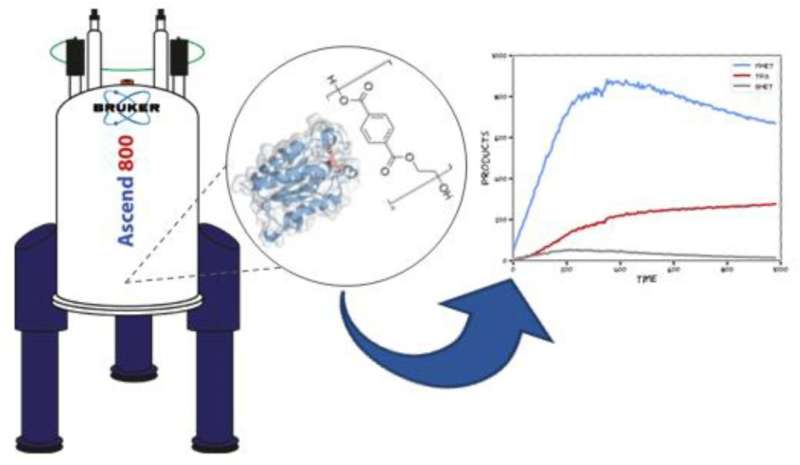
Graphical abstract. Credit: bioRxiv (2022). DOI: 10.1101/2022.11.01.514593

Every year, the world produces 380 million tons of plastic. A lot of it ends up in nature and stays there for a long time. It can take 450 years to break down a plastic bottle.

"Plastic is a  that is challenging to break down," says Gaston Courtade, an associate professor at NTNU's Department of Biotechnology and Food Science.

Plastic is found in packaging, toys, decorative items—well, in most categories of products.

"We need technology that enables plastics to be broken down more efficiently to achieve a more sustainable future," says Courtade.

Finding enzymes that break down plastic

The researchers and students in biotechnology at NTNU have now come a few steps closer to producing enzymes that can break down plastic in an .

Enzymes are substances that speed up  without breaking down themselves—like is being done to break down plastic. Courtade is heading the study, and the research team has already come a long way.

"We want to understand the reactions behind the enzymes that can break down plastic," says Courtade.

The aim is to use enzymes from bacteria and fungi and improve their ability to break down plastic faster.

One challenge is how well these enzymes can bind to plastic. The researchers are therefore looking at ways to use proteins with special binding properties to regulate how the enzymes attach to plastic.

Enzymes only part of the solution

However, the danger in this is that more people might then think that it's no problem to use plastic.

"We hope this doesn't lead to more people thinking it's okay to produce more plastic simply because we now have a better way to break down the  with the enzymes," says Courtade.

"We'd rather have our research contribute to producing more sustainable by-products," he says. "We need to become less dependent on plastics from fossil sources and get better at investing in biotechnological solutions."

The findings are published on the bioRxiv preprint server.

More information: Kristina Naasen Hellesnes et al, Biochemical characterization and NMR study of a PET-hydrolyzing cutinase fromFusarium solani pisi, bioRxiv (2022). DOI: 10.1101/2022.11.01.514593


Provided by Norwegian University of Science and Technology New enzyme discovery is another leap towards beating plastic waste

Images capture 850-year-old aftermath of stellar collision

Images capture 850-year-old aftermath of stellar collision
The unusual fireworks-like structure of nebula Pa 30 may result from the merger of two
 dying stars. Credit: Robert Fesen

A Dartmouth professor's images of the explosive aftermath from the collision of two dying stars could help scientists better understand this rare type of astronomical event—and may finally confirm the identity of a brilliant but short-lived star observed nearly 850 years ago.

Robert Fesen, a professor of physics and astronomy, captured telescopic images that show a fireworks-like burst of thin filaments radiating from a highly unusual star at the center of an object called Pa 30, according to findings he announced Jan. 12 at the 241st Meeting of the American Astronomical Society. Fesen is lead author of a paper reporting the findings that has been submitted to the The Astrophysical Journal Letters for publication.

Pa 30 is a dense region of illuminated gas, dust and other matter known as a nebula. Fesen and his co-authors report that Pa 30 appears to contain little to no hydrogen and helium but is instead rich in the elements of sulfur and argon.

The nebula's unusual structure and characteristics match the predicted result of a collision between end-stage stars known as , Fesen said. White dwarfs are faint, extremely dense stars about the size of Earth that contain the mass of the Sun. The merger of two white dwarfs is one proposed explanation for a subclass of supernovae—or star explosions—called Iax events, in which the star is not completely destroyed, Fesen said.

"I have never seen any object—and certainly no supernova remnant in the Milky Way galaxy—that looks quite like this, and neither have any of my colleagues," Fesen said. "This remnant will allow astronomers to study a particularly interesting type of supernova that up to now they could only investigate from  and examples in distant galaxies."

The size of Pa 30 and the speed at which it is expanding—about 2.4 million miles per hour—suggest the explosive collision occurred around the year 1181, the researchers report. That coincides with observations by Chinese and Japanese astronomers at the time of a very bright star that suddenly appeared in the constellation Cassiopeia and was visible for about six months as it slowly faded. These fleeting stars are known as "guest stars."

The images Fesen captured of the nebula's structure and luminosity not only provide the most accurate estimate yet of its age, but also could allow astronomers to refine existing models of white dwarf mergers. Pa 30 was discovered in 2013 by co-author and amateur astronomer Dana Patchick, but up until now, images of the nebula had shown only an extremely faint and diffuse object, Fesen said.

"Our deeper images show that Pa 30 is not only beautiful, but now that we can see the nebula's true structure, we can investigate its chemical makeup and how the  generated its remarkable appearance, then compare these properties to predictions from specific models of rare white dwarf mergers," Fesen said.

Fesen took the images of Pa 30 in late 2022 using the 2.4-meter Hiltner Telescope at the MDM Observatory—which Dartmouth owns and operates with four other universities—adjacent to Kitt Peak National Observatory in Arizona. Fesen equipped the telescope with an optical filter sensitive to a particular emission line of sulfur. He captured Pa 30 in three 2,000-second exposures under very clear skies and took additional data on the nebula's structure, size and velocity.

The study by Fesen and his co-authors built upon work published in 2019 by Russian researchers who found an extremely unusual star nearly in the dead center of Pa 30. That star exhibited several properties suggesting the collision of two white dwarfs, and it had a surface temperature of nearly 400,000 degrees Fahrenheit with an astounding outflowing wind velocity of about 35 million miles per hour.

In 2021, astronomers from the University of Hong Kong that had revisited the Russian team's results reported that Pa 30 was roughly 1,000 years old and in nearly the same sky location as the guest star recorded in 1181. These researchers proposed that Pa 30 is the aftermath of a white dwarf collision that lit up the night sky nearly a millennium ago, though their margin of error on its age was 300 years.

"Our new observations put a much tighter constraint on the object as having an expansion age of around 850 years, which is perfect for it to be the remains of the 1181 guest star," Fesen said. To the ancient , the new star would have been nearly as bright as, or brighter than, Vega, the fifth-brightest star in the sky as seen from Earth.

"The guest star was bright enough that three separate groups in China observed it within a couple of days of each other and it also was seen in Japan," Fesen said. "A new star as bright as Vega would've been quite noticeable. To the ancients, their TV set was the sky, so they would've easily noticed and certainly recorded the sudden appearance of a bright new star in the heavens."


Research improves ability to identify and study algae species

OU-led group improves ability to identify and study algae species
Summer Microcystis bloom in Castle Rock Pond, Norman, Oklahoma.
 Credit: Haiyuan Cai

Harmful algal blooms create challenges around the globe for water quality and health risk management for humans, wildlife and pets. A team of researchers from the University of Oklahoma is leading an effort toward better management of Microcystis blooms and toxins through a new genome-based taxonomy.

OU Regents' Professor of Biology Dave Hambright and members of his Plankton Ecology and Limnology Lab, in conjunction with OU microbiology professor Lee Krumholz, collaborated on this project with  at the University of North Carolina, James Madison University and Auburn University. The results of their work were published in Science Advances.

Through the development of a new genome-based taxonomy, researchers for the first time will be able to characterize ecological niches of Microcystis, including nutrient requirements and seasonality, and ultimately, control harmful Microcystis blooms. The team has developed  that will allow researchers to identify Microcystis species present in . In their paper, the researchers have identified 16 unique species, with as many as 30 or more likely, that are genetically distinct, but that do not correspond to current morphologically defined species.

"This new genome-based taxonomy lays the basis for researchers to formulate science-based proactive management programs to rid our waters of harmful Microcystis blooms," Hambright said. "Our improved ability to identify and study species of this algae will aid our ability to reduce health risks, as well as manage and protect our increasingly vulnerable water resources."

Understanding Microcystis ecology and evolution is foundational to lake and  management aimed toward preventing and reducing harmful Microcystis blooms. While traditional Microcystis taxonomy (classification into species) recognizes multiple species, these classifications are controversial as they are based on morphology and not ecological features. Additionally, they conflict with standard DNA-sequence-based classifications, which suggest one species with complex and variable ecologies.

Based on the work of OU biology doctoral student Katherine Cook, which was published in 2020 in Limnology & Oceanography, the group hypothesized Microcystis and its microbiome were a coevolved community of complementary interacting bacteria  (an interactome), with each necessary for the success of the others.

Their goal was to examine the genetic makeup of Microcystis from around the world using 122 published entire genomes and make predictions of potential metabolic functions that might be provided by the microbiome bacteria. Their paper represents the foundation for that goal in the form of a robust taxonomic classification, including evolutionary relationships.

The majority of the bioinformatic analyses in this paper was conducted by OU postdoctoral fellow Haiyuan Cai, with assistance from OU doctoral student Chris McLimans. Additional data analysis was supported by OU research assistant professor Jessica Beyer.

More information: Haiyuan Cai et al, Microcystis pangenome reveals cryptic diversity within and across morphospecies, Science Advances (2023). DOI: 10.1126/sciadv.add3783www.science.org/doi/10.1126/sciadv.add3783


Journal information: Science Advances 

Provided by University of Oklahoma Are zebra mussels eating or helping toxic algae?

DNA collected from slave skeletons interred in unmarked 18th-century burial ground reveals their history

burial ground
Credit: Pixabay/CC0 Public Domain

A team of researchers affiliated with several institutions in the U.S., working with members of The Anson Street African Burial Ground Project, have discovered some of the history behind some of the enslaved people buried in 18th century Charleston, South Carolina—home to one of the busiest slave ports in American history.

In their paper published in Proceedings of the National Academy of Sciences, the group describes how they collected  from as many of the skeletons in the  as possible and what analysis of their DNA revealed about their history.

Starting in the early 1500s, as part of a larger slave trade, white Europeans brought black people living in Africa by force to work as slaves in the colonial America. They continued to do so for the following three hundred years. Many of those slaves began their life in America in Charleston South Carolina.

Approximately half of all such slaves arrived at the port there and were summarily sold. In this new effort, the researchers conducted a DNA analysis of skeletons of slaves who had been buried in an unmarked burial ground during the 18th century near the heart of the city.

The cemetery was discovered back in 2013 and since that time, efforts have been made to identify those who were buried there. In all, 36 skeletons were found in the cemetery but only 18 had tissue samples suitable for use in a genetic study. Prior work on the project showed that all of the people in the cemetery had been placed in coffins prior to burial and that most had artifacts in the coffin with them, such as pipes, beads or even coins.

In looking at the DNA, the researchers found that all but one of the slaves had come directly from Africa, or had ancestors that had. They also found that slave ancestry was not confined to the west coast of Africa—some of the slaves had been taken from parts of sub-Saharan areas. The team found that 13 of them had been born in West Africa, the rest likely in the U.S. The researchers also found that none of the people buried in the cemetery were related to any other—a sign that suggests  were separated upon arrival.

The researchers also found that one person in the cemetery had Native American maternal lineage, which they suggest highlights the multigenerational aspect of the American slave trade.

More information: Raquel E. Fleskes et al, Community-engaged ancient DNA project reveals diverse origins of 18th-century African descendants in Charleston, South Carolina, Proceedings of the National Academy of Sciences (2023). DOI: 10.1073/pnas.2201620120