Saturday, January 14, 2023

AI improves detail, estimate of urban air pollution
pollution
Credit: CC0 Public Domain

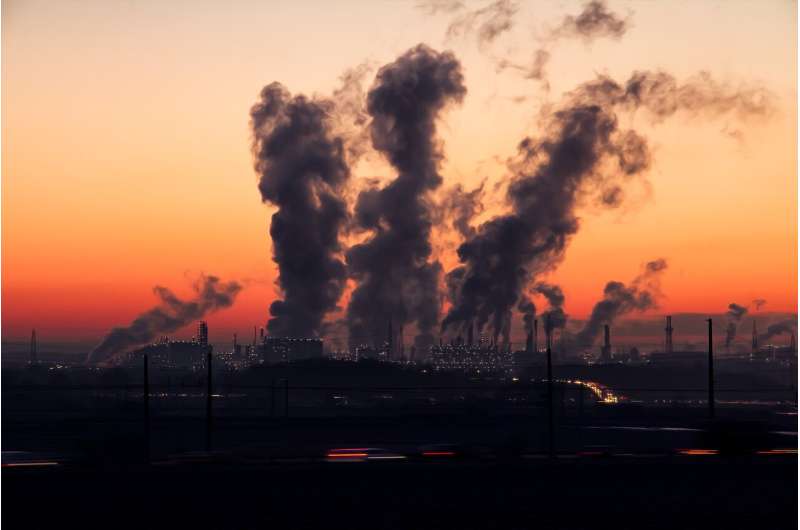
Using artificial intelligence, Cornell engineers have simplified and reinforced models that accurately calculate the fine particulate matter (PM2.5)—the soot, dust and exhaust emitted by trucks and cars that get into human lungs—contained in urban air pollution.

Now,  and government health officials can obtain a more precise accounting about the well-being of urban dwellers and the air they breathe, from new research published December 2022 in Transportation Research Part D.

"Infrastructure determines our living environment, our exposure," said senior author Oliver Gao, the Howard Simpson Professor of Civil and Environmental Engineering in the College of Engineering. "Air pollution impact due to transportation—put out as exhaust from the cars and trucks that drive on our streets—is very complicated. Our infrastructure, transportation and energy policies are going to impact air pollution and hence public health."

Previous methods to gauge air pollution were cumbersome and reliant on extraordinary amounts of data points. "Older models to calculate particulate matter were computationally and mechanically consuming and complex," said Gao, a faculty fellow at the Cornell Atkinson Center for Sustainability. "But if you develop an easily accessible data model, with the help of  filling in some of the blanks, you can have an accurate model at a local scale."

Lead author Salil Desai '20, M.Eng. '21 and visiting scientist Mohammad Tayarani, together with Gao, published "Developing Machine Learning Models for Hyperlocal Traffic Related Particulate Matter Concentration Mapping," to offer a leaner, less data-intensive method for making accurate models.

Ambient air pollution is a leading cause of premature death around the world. Globally, more than 4.2 million annual fatalities—in the form of cardiovascular disease, , stroke and —were attributed to air pollution in 2015, according to a Lancet study cited in the Cornell research.

In this work, the group developed four machine learning models for traffic-related  concentrations in data gathered in New York City's five boroughs, which have a combined population of 8.2 million people and a daily-vehicle miles traveled of 55 million miles.

The equations use few inputs such as traffic data, topology and meteorology in an AI algorithm to learn simulations for a wide range of traffic-related, air-pollution concentration scenarios.

Their best performing  was the Convolutional Long Short-term Memory, or ConvLSTM, which trained the algorithm to predict many spatially correlated observations.

"Our data-driven approach—mainly based on vehicle emission data—requires considerably fewer modeling steps," Desai said. Instead of focusing on stationary locations, the method provides a high-resolution estimation of the city street pollution surface. Higher resolution can help transportation and epidemiology studies assess health, environmental justice and air quality impacts.

More information: Salil Desai et al, Developing Machine learning models for hyperlocal traffic related particulate matter concentration mapping, Transportation Research Part D: Transport and Environment (2022). DOI: 10.1016/j.trd.2022.103505

Journal information: The Lancet 

Researchers work toward harnessing ocean energy to power devices

New generator rolls into ocean energy
A new nanogenerator that harnesses the renewable energy of open ocean waves
 could power observation platforms and more in the middle of the ocean. 
Credit: Sara Levine | Pacific Northwest National Laboratory

Tsunamis, hurricanes, and maritime weather are monitored using sensors and other devices on platforms in the ocean to help keep coastal communities safe—until the batteries on these platforms run out of juice. Without power, ocean sensors can't collect critical wave and weather data, which results in safety concerns for coastal communities that rely on accurate maritime weather information. Replacing batteries at sea is also expensive. What if this could all be avoided by powering devices indefinitely from the energy in ocean waves?

Pacific Northwest National Laboratory (PNNL) researchers are working to make this a reality with the development of a new cylindrical triboelectric nanogenerator (TENG)—a small powerhouse that converts  into electricity to  devices at sea. Larger versions of this generator could be used to power ocean observation and communications systems, including acoustic and satellite telemetry.

"TENGs are low cost, lightweight, and can efficiently convert slow, uniform or random waves into power—making them particularly well-suited to powering devices in the open ocean where monitoring and access are challenging and costly," explained Daniel Deng, a PNNL laboratory fellow and co-developer of the new TENG device.

Deng and his team took a novel approach to advance cylindrical TENGs for use on the open ocean. Their patent-pending frequency-multiplied cylindrical triboelectric nanogenerator (FMC-TENG) uses carefully placed magnets to convert energy more efficiently than other cylindrical TENGs and to better transform slow, uniform waves into electricity. So far, the prototype FMC-TENG has been able to produce enough electricity to power an acoustic transmitter—a type of sensor often included on ocean observing platforms that can be used for communications. This is about the same amount of electricity it takes to power an LED lightbulb.

"We're developing the FMC-TENG to power everything from ocean observing platforms with multiple sensors to satellite communications, all using the power of the ocean," said Deng.

A new nanogenerator, the FMC-TENG, harnesses the renewable energy of open ocean waves to generate power. Credit: Sara Levine / Pacific Northwest National Laboratory

Artificial fur, magnets, and waves for power

If you've ever been shocked by , then you've personally experienced the triboelectric effect—the same effect researchers leverage in the FMC-TENG to produce power. A cylindrical TENG is made up of two nested cylinders with the inner cylinder rotating freely. Between the two cylinders are strips of artificial fur, aluminum electrodes, and a material similar to Teflon called fluorinated ethylene propylene (FEP). As the TENG rolls along the surface of an ocean wave, the artificial fur and aluminum electrodes on one cylinder rub against the FEP material on the other cylinder, creating static electricity that can be converted into power.

The more a cylindrical TENG moves, the more energy it generates. That's why fast, frequent waves can generate more energy than the slower, more uniform waves of the open ocean. To come up with a TENG that could power electronics in the open ocean, Deng and his team set out to increase the amount of wave energy converted into electricity in the FMC-TENG. As it turned out, the key was to temporarily stop the FMC-TENG's inner cylinder from moving.

In the FMC-TENG, the team positioned magnets to stop the inner cylinder in the device from rotating until it reached the crest of a wave, allowing it to build up more and more potential energy. Nearing the crest of the wave, the magnets released and the internal cylinder started rolling down the wave very quickly. The faster movement produced electricity more efficiently, generating more energy from a slower wave.

A wave energy converter for the open ocean

Currently, the FMC-TENG prototype can produce enough power to run small electronics, like temperature sensors and acoustic transmitters. As the team iterates on their design for commercial use, the FMC-TENG is expected to produce enough power to run an entire open ocean monitoring platform including multiple sensors and satellite communications. Plus, the FMC-TENG is lightweight and can be used in both free-floating devices and moored platforms.

"The FMC-TENG is unique because there are very few wave energy converters that are efficient and able to generate significant power from low-frequency ocean waves," said Deng. "This type of generator could potentially power integrated buoys with sensor arrays to track  water, wind, and climate data entirely using renewable  energy."

The study is published in the journal Nano Energy.

More information: Hyunjun Jung et al, Frequency-multiplied cylindrical triboelectric nanogenerator for harvesting low frequency wave energy to power ocean observation system, Nano Energy (2022). DOI: 10.1016/j.nanoen.2022.107365


Journal information: Nano Energy 


Provided by Pacific Northwest National Laboratory Generating electricity from store-bought, double-sided tape

Antarctic rover performs research in the snow

Antarctic rover performs research in the snow
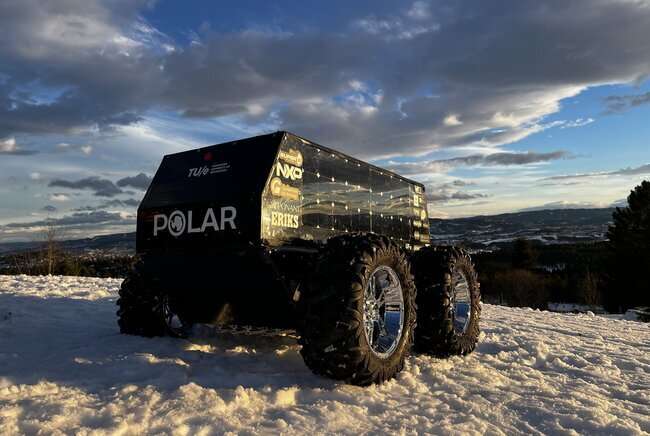
Team POLAR's rover Ice Cube in the Norwegian snow. 
Credit: Laurenz Edelmann, team POLAR

Team Polar, a student team at Eindhoven University of Technology (TU/e), took their first rover to perform research in the Norwegian snow in the first week of January. The team is dedicated to developing an independent rover that can perform Antarctic research. This is their first working prototype and the team is eager to set a benchmark for future developments. They will present their findings and the rover itself at the reveal event, January 20, 2023.

The Earth is facing its biggest problem in centuries: . To fight climate change, we need to understand better the factors behind it. However, understanding it requires gathering information about our planet in places where nature is still pristine and more or less unaffected by climate change, as well as places where the consequences of global warming and climate change can be observed first-hand. Circumstances like that are usually found in extremely cold and remote environments like the Arctics, Antarctica, and the oldest glaciers. At the moment, research is often carried out inefficiently and in very expensive and unsustainable ways.

Team Polar wants to create an alternative way to do extensive environmental research in the coldest places on our planet by developing an unmanned rover. This rover will eventually operate and perform research all by itself—similar to how the Martian rovers operate on the surface of Mars—and collect invaluable data about the effects of climate change. The team started its mission in 2018 and now presents its first working prototype: the rover "Ice Cube."

Research in the snow

Development of the rover took place at the Eindhoven University of Technology in the Netherlands, a country notoriously devoid of deep  most winters these days. That's why the team took their rover to Trondheim in Norway, to see how their first rover "Ice Cube" performs in the snow. "We can test a lot of things in our lab, but not how the rover drives in the snow, how the  handle the snow and temperatures, and how cold it will get inside the rover and how quickly it becomes very cold," explains team manager Laurenz Edelmann.

"We have built our first rover with off-the-shelf components. That may or may not present some challenges for us. And, we may find that certain components will need to be custom-made and designed for future rover models. That's why this rover will be a benchmark for us and for future teams." The rover will be remote controlled for now, allowing the team to hand-pick the locations they want to study on this trip. This allowed the team to gather essential insights that can help the team to ensure that their next rover will be fit for a mission to Antarctica.

Inspiring other teams

The team was in Norway to run their experiments from January 4 until January 8. There, they saw their rover drive through the snow naturally. They also determined which components worked fine, and discovered a handful of items that broke and needed replacing. "Overall, we were super impressed with the way Ice Cube tackled the snow and handled itself," says Edelmann. "We gathered valuable data, and great footage to present at our event." There was also time set aside on the return journey to the Netherlands to visit other universities. "We love to maintain good relations with other student teams at technical universities in Europe. That's why we made sure to present our rover at the universities of Trondheim (NTNU), Kopenhagen (DTU), and Braunschweig (NFF)," explains Edelmann.

"We hope to inspire and inform local student teams how to tackle an ambitious goal, such as building an Antarctic research  successfully. And, of course, to forge new alliances and collaborations with our colleagues at other institutions."

NASA's self-driving Perseverance Mars rover is breaking records

Olives, the source of "liquid gold," offer more riches to unlock

Olives, the source of "liquid gold," offer more riches to unlock
Only about 25% of an olive is used for the prized oil. Credit: Lucio Patone on Unsplash

Olive oil is a multibillion-euro global business and Manuel Román is determined to create an even bigger market from the sacred ancient fruit.

Román is co-founder of ISANATUR, a Spanish company that has built a refinery able to turn every part of an olive into a commercial product of some kind.

Pulp and pits

Only about 25% of an olive is used for the prized oil, with the remaining pulp, pits and water ending up in landfills or being turned into fertiliser. The pits can also be used for fuel.

'What is needed is a market willing to use the products—the olive powder, olive water, olive seed,' said Román, former coordinator of an EU-funded project developing ways to transform the entire residue into commercial goods.

Global annual production of olive oil totals about 3 million tonnes, of which 2 million tonnes are in Europe. The worldwide olive oil market is worth nearly €13 billion, according to Fortune Business Insights.

While olive oil has been called 'liquid gold' for millennia because of its many health benefits, the residue is also packed full of goodness.

Companies in Europe are developing ways to tap into this rich source of ingredients so they can be used in health and beauty products, food supplements and .

'Thousands of tonnes of natural products are not being used and we are missing out on the opportunity to eat these healthy compounds,' said Román.

He was interim coordinator of UP4HEALTH, which began in mid-2020 and is due to continue until end-May 2024. Run from Spain, Europe's top producer of olive oil, the project brings together participants determined to end olive waste.

ISANATUR is already selling powder made from olive pulp—which is rich in iron, proteins and antioxidants—for use in snack bars and food supplements.

The overall potential is enormous. Other products include soluble fibre to boost digestive health, drinks made from olive water and fats that can be used as skin moisturisers.

Although UP4HEALTH includes several small and medium-sized food and nutraceutical businesses testing the products, it wants to attract large multinational companies that could create enough demand to scale.

One of the main obstacles to turning biowaste into new products is creating the demand and building the supply chains to meet it.

Leafy promises

Olive-tree leaves, which are normally left to rot in groves or burnt for energy, also have significant commercial potential.

A second EU-funded project coordinated from Spain, OLEAF4VALUE, has brought together scientists, multinational companies and olive farmers to develop uses for leaves in a range of products.

Olive leaves contain antioxidants, anti-inflammatories and antimicrobials, which—like  residue—could be used in food supplements, pharmaceuticals, beauty products and animal feed.

Currently, only about 0.2% of the world's residual olive leaves find commercial uses, according to OLEAF4VALUE.

The project wants to increase the level to 15% with the help of Oleícola El Tejar, a Spanish farm cooperative that already handles an equivalent percentage of the world's supply of olive pulp, pits and leaves.

The project is working with Mibelle Biochemistry Switzerland, a multinational that designs ingredients for the beauty industry.

But inroads are also being made into other markets including feed, said José Maria Pinilla, coordinator of OLEAF4VALUE.

Healthier fish

Pinilla is project manager at Natac Group, which makes natural ingredients for food supplements, feed and pharmaceuticals.

Natac works with Norway-based Mowi, the world's largest producer of farmed salmon.

The two companies have already successfully tested olive pulp ingredients in feed for fish to determine whether they protect salmon from bacterial infections. Trials so far—conducted at the Institute of Agrifood Research and Technology in Spain—have found they make salmon more resilient to such contagion.

Now, as part of OLEAF4VALUE, Natac and Mowi are testing ingredients from the leaves to gauge whether they can protect fish from viral infections.

Trials are under way at the Institute of Marine Research in Bergen, Norway and should be completed by the end of 2023, according to Pinilla.

To break into the market for animal-feed additives, economic efficiency is key.

'If you want to enter that market, you need to be very, very cost competitive,' said Pinilla.

Smarter sorting

To cut production costs in general, the project is developing a new way to extract the most value from the leaves.

With this technique, known as "dynamic processing," each batch of leaves is processed differently according to its chemical content. OLEAF4VALUE researchers are creating a sensor that analyses the chemical composition of each batch.

The chemical content of leaves depends on where they grew and how they were handled before processing. The content determines the most suitable products for leaves.

For example, olive leaves contain oleuropein, which is used as a food supplement. Its content in leaves varies from 0.2% to 10%.

Currently, leaves are all processed in the same way and for the same purposes.

'But if I want to produce a very high-purity oleuropein, it's obviously much easier to do it with a high-content leaf at the beginning,' said Pinilla.

With dynamic processing, only olive leaves with high oleuropein content are used to extract this compound. The rest are processed for different chemicals.

The project is also developing treatments to modify the chemical content of leaves so they contain higher concentrations of certain chemicals before processing begins.

Plenty of research is still needed for both the processes and the products. Then the challenge will be to find major buyers.

But Pinilla is certain about the merits of the whole initiative.

'In theory we could have nothing to throw away,' he said. 'We are trying for a zero-waste approach.'

Research in this article was funded by the EU. This article was originally published in Horizon, the EU Research and Innovation Magazine.

Video: The chemistry of olive oil

Greenhouse gas concentrations further increased in 2022, finds analysis of global satellite data

Greenhouse gas concentrations further increased in 2022
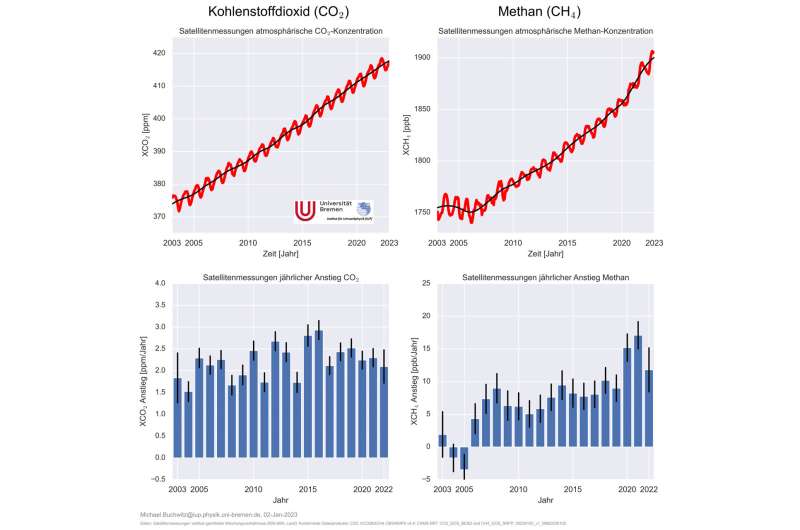
Time dependence of the concentration of carbon dioxide and methane since 2003. 
Credit: Institute for Environmental Physics at the University of Bremen

Preliminary analyses of global satellite data by environmental researchers at the University of Bremen show that atmospheric concentrations of the two important greenhouse gases carbon dioxide (CO2) and methane (CH4) continued to rise sharply in 2022. The increase in both gases is similar to that of previous years. However, the increase in methane does not reach the record levels of 2020 and 2021.

The Institute of Environmental Physics (IUP) at the University of Bremen is a world-leading institute in the field of evaluation and interpretation of global satellite measurements of the greenhouse gases  (CO2) and methane (CH4) and other atmospheric trace gases that are of great importance for climate and air quality.

The institute leads the GHG-CCI greenhouse gas project of the European Space Agency's Climate Change Initiative (ESA) and provides related data to the European Copernicus Climate Change Service C3S and the Copernicus Atmospheric Monitoring Service CAMS. The latest Copernicus communication on greenhouse gases (see link below) is based on  and analysis provided by IUP.

"The methane increase remains very high in 2022 at about 0.6%, but below the record levels of the past two years. Our guess for this is that on the one hand there have been more emissions, but at the same time the atmospheric methane sink has decreased. At just over 0.5%, the CO2 increase is similar to that of previous years," says environmental physicist Dr. Michael Buchwitz, summarizing the initial results.

Greenhouse gas measurements since 2002

Time series of greenhouse gas measurements from space begin in 2002 with the SCIAMACHY instrument on the European environmental satellite ENVISAT, proposed and scientifically leg by the University of Bremen. These measurements are currently being continued by Japanese (GOSAT and GOSAT-2) and American (OCO-2) satellites, among others.

The satellites measure the vertically averaged mixing ratio of CO2 and CH4. These measurements are referred to as XCO2 and XCH4, and they differ from the commonly reported measurements of near-ground concentrations. The data are reported in parts per million (ppm) for CO2 and parts per billion (ppb) for CH4. An XCO2 concentration of 400 ppm means the atmosphere contains 400 CO2 molecules per one million air molecules. "Methane increased by 11.8 ppb in 2022, CO2 by 2.1 ppm," Buchwitz said.

CO2 increases almost uniformly—in contrast to methane. In the years 2000 to 2006, the methane concentration was stable on average. Since 2007, however, methane has been rising (again), with particularly high rates of increase in recent years. The record levels in 2020 and 2021 are likely associated with a COVID-19-induced increase in the methane sink, but also with an increase in .

"Unfortunately, there are still many gaps in our knowledge of the diverse natural and anthropogenic sources and sinks of  and other ," Buchwitz says. "It is therefore still necessary to make optimal use of and further improve the existing system for global monitoring of climate-relevant parameters."

Provided by Universität BremenNASA cancels greenhouse gas monitoring satellite due to cost

Feds release bleak 2022 climate change data: Oceans warm, global temps among hottest on record

global warming
Credit: Pixabay/CC0 Public Domain

In one announcement after another this week, a grim accounting emerged of the world's extreme weather and climate disasters in 2022

The science leaves "no doubt" about the impacts of the warming climate, Bill Nelson, administrator of the National Aeronautics and Space Administration, said during a briefing Thursday. "Sea levels are rising. Extreme weather patterns threaten our well-being across this planet."

The nation's two  charged with weather and climate observations said in 2022:

  • Ocean heat reached a new high
  • Arctic sea ice was second lowest level ever recorded
  • Europe saw its second warmest year on record, but much of western Europe was the warmest ever

But when it comes to  and the impacts of climate change, there's no place like home. The U.S. led the world again last year in extreme weather events and disasters, the National Oceanic and Atmospheric Administration said on Tuesday.

Oceans get even warmer and saltier

The world's oceans—which absorb more than 90% of the world's excess heat—were again the hottest on record last year.

"Year after year we are breaking records for ocean heat content," Michael Mann, a climate scientist at the University of Pennsylvania, tweeted Wednesday. Mann was one of a team of 16 international researchers who published a paper Wednesday detailing last year's record  heat.

The hotter and saltier oceans are critical indicators of "profound alterations" taking place in energy and water cycles, the scientists wrote. "The inexorable climb in  is the inevitable outcome of Earth's energy imbalance, primarily associated with increasing concentrations of greenhouse gases."

If not for the large storage capacity of the oceans, the world would have warmed a lot more already, said Russell Vose, chief of the analysis and synthesis branch for NOAA's National Centers of Environmental Information.

World temperatures again among warmest on record

NASA and NOAA agreed global average temperatures in 2022 were among the warmest on record, with their data and calculations coming to slightly different conclusions.

Temperatures would have been even higher last year without La Nina keeping things cooler in the Pacific, said Gavin Schmidt, director of NASA's Goddard Institute for Space Studies.

  • It's been 46 years since the Earth had a colder-than-average year.
  • NASA put the global average temperature at 1.6 degrees above the baseline for 1951-1980 or fifth warmest, tied with 2015.
  • The European Commission's Copernicus website also ranked the year 5th warmest.
  • NOAA ranked 2022 the sixth warmest at 1.55 degrees above a baseline set between 1901-2000. It does not yet include the Arctic in its calculations.
  • La Nina likely contributed a .06 degree Celsius cooling effect on global average temperatures, Schmidt said.

There's almost a 100% chance that 2023 will also be among the top 10 warmest years on record, Schmidt said. And with conditions in the central Pacific Ocean potentially flipping to an El Nino, he and Vose said 2024 could be a contender for warmest year on record.

If the warming continues, the average temperature in a single year could soon top the 1.5 degree Celsius level the world hoped to avoid with the Paris Agreement, Vose said. "There's actually a 50-50% chance that we have one year in the 2020s that maybe jumps above 1.5."

Schmidt guessed the first year with 1.5 degrees warming will be an El Nino year, probably in the early 2030s, but, he said, the world may still be two decades away from sustained warming above 1.5 degrees.

18 billion-dollar disasters in US

"In the U.S. we have consistently had the highest count and the largest diversity of different types of weather and climate extremes that lead to billion dollar disasters," said Sarah Kapnick, NOAA'S chief scientist said Thursday.

The 18 billion-dollar disasters last year were the third most on record, behind 2020 and 2021. They included Hurricane Ian, the mega-drought in the west and a massive snowstorm across much of the country in December.

With a total cost of $165 billion, the 18 disasters made it the third most costly year on record behind 2017 and 2005, the years when Hurricane Harvey and Hurricane Katrina made landfall in the U.S.

At least 474 deaths were reported last year as a result of the billion-dollar disasters.

Hurricane Ian was the costliest disaster of 2022, with estimated damages so far at $112.9 billion.

How did US weather in 2022 compare to previous years?

It was:

  • The 27th driest year on record overall.
  • The fourth driest year on record in Nebraska.
  • The ninth driest in California, thanks to wetter than average conditions during the past two months.
  • Alaska's 16th warmest year and fourth wettest year.
  • An above average year for tornadoes, with 1,331.

(c)2023 USA Today

Distributed by Tribune Content Agency, LLC.


Changes in the approximation of snow for climate models using typical vegetation in the Northern Hemisphere

Changes in the approximation of snow by climate models over typical vegetation in the Northern Hemisphere
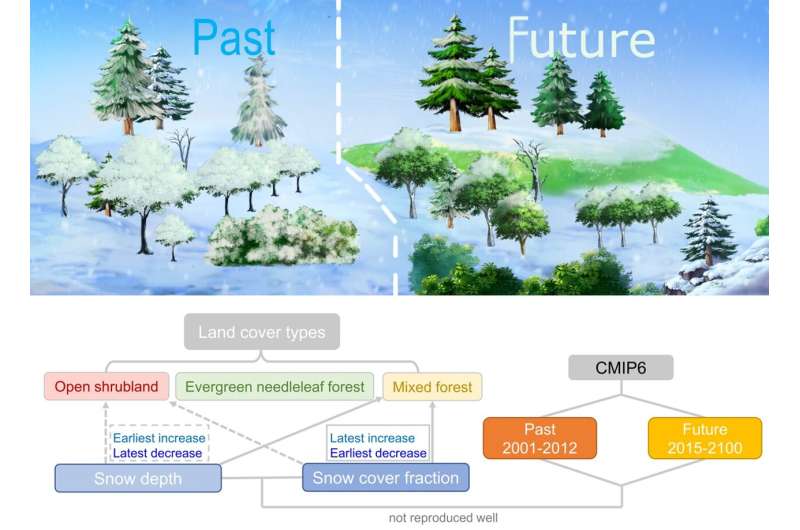
Schematic illustration of the study. Credit: Xiaodan Guan

Seasonal snow is sensitive to climate change, and is always taken as a signal of local climate changes. Against the background of global warming, the annual snow cover in the Northern Hemisphere is following an overall decreasing trend.

Since snow plays an important role in the  and has significant effects on atmospheric circulation, it is important to be able to simulate it well in climate models. However, as a process that operates on a small scale, snow needs to be approximated (or "parameterized"), and so many studies have attempted to improve the schemes that perform this parametrization of snow in climate models.

In the mid-to-high latitudes of the Northern Hemisphere, the impacts of  dynamics on vegetation show large differences among boreal biomes. Researchers from Lanzhou University, China, selected open shrubland, mixed forest, and evergreen needle leaf forest in the mid-to-high latitudes (45°–70°N), which are highly sensitive to snow changes.

Then, over a selected area of North America, Europe, Central Asia, and East Asia, they addressed the unique relationships between snow cover and snow depth for typical vegetation cover types and explored the reproduction of snow accumulation processes by model parameterization. The results have recently been published in Atmospheric and Oceanic Science Letters.

According to the findings of this study, there are different relationships between snow cover and snow depth for these three typical land cover types, and the relationships not only represent the characteristic changes in the processes of snow accumulation and snow melt, but can also be used in the model for predicting snow accumulation.

"However, partly because the influence of different land cover types is not fully considered, it was found that state-of-the-art  are unable to reproduce the relationships between snow cover and snow depth in both historical and future simulations, which will affect our understanding of the ecological impacts of snowmelt in spring," says Prof. Xiaodan Guan, the first and corresponding author of this paper.

Therefore, it is important to improve simulation results by considering the interaction between land cover types and snow processes in snow parameterization schemes.

More information: Xiaodan Guan et al, Changes in snow parameterization over typical vegetation in the Northern Hemisphere, Atmospheric and Oceanic Science Letters (2023). DOI: 10.1016/j.aosl.2022.100325

Provided by Chinese Academy of Sciences Snow depth trends revealed from CMIP6 models conflict with observations

New study explores the integration of wildlife and denser populations in urban planning

Research: Wildlife, Dense Populations Merged in Urban Planning
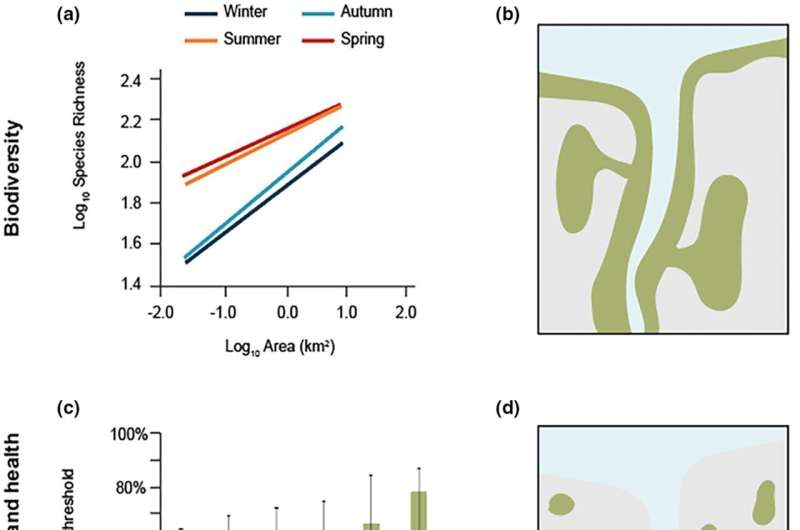
Relationship between nature, biodiversity, and ecosystem provision. (a) The relationship
 between habitat area and avian species richness in New York City (La Sorte et al., 2020).
(b) Conceptual drawing of urban development (gray) near a waterbody (blue) in a matrix of
 remnant habitat (green), with important biodiversity areas protected with corridors between
 them (McDonald, 2015). Note that small green spaces within the urban area (not shown) 
can improve matrix quality and help maintain biodiversity as well (Forman, 2008).
 (c) Neighborhood vegetation cover and the odds of having depression, from a study in
 southern England. Shown is the reduction in the odds of having depression, relative to 
the base case, if a vegetative cover threshold is exceeded (Cox et al., 2017). 
(d) Conceptual drawing of urban development (gray) near a waterbody (blue) in a matrix 
of green spaces (green), where each urban neighborhood is surrounded by green spaces
 that can provide benefits to residents (McDonald, 2015). Credit: People and Nature (2023)
. DOI: 10.1002/pan3.10423

A new study from The Nature Conservancy (TNC) explores how we can make our cities work better for people and wildlife, challenging longstanding assumptions about the merit of green spaces in our communities

Urban planners have long debated the value of building more  such as parks and gardens—amenities that benefit both humans and —into city plans, versus the creation of denser urban developments that allow the  to thrive beyond city limits.

However, a recent study published in the open-access journal People and Nature explores a new option of urban planning that allows the accommodation of dense populations common in cities, whilst simultaneously meeting the needs of the natural world more effectively.

The study, conducted by TNC, challenged established assumptions within the scientific and planning community. For example, tree cover percentage declining as cities become more densely populated, was proven to be less pronounced than previously thought.

By analyzing existing approaches, as well as highlighting cities already creating the right balance of people and wildlife, the study pioneers an alternative method of city design that allows for the accommodation of both denser populations as well as wildlife.

"This needn't be a zero-sum game," explains senior author and TNC lead scientist for nature-based solutions, Rob Mcdonald. "Having denser cities doesn't automatically mean less space for nature."

Elaborating on the study's recommendations, senior co-author Erica Spotswood describes the creation of the paper's "nine green interventions", inspired by cities like Singapore and Curibita in Brazil, that act as guidelines for " to balance denser development with the needs of nature. Encompassing everything from  to 'green' roofs."

More information: Robert I. McDonald et al, Denser and greener cities: Green interventions to achieve both urban density and nature, People and Nature (2023). DOI: 10.1002/pan3.10423


Provided by British Ecological Society Green streets: Why protecting urban parks and bush is vital as our cities grow and become denser

Madagascar mouse lemur retroviruses are diverse, similar to ones found in polar bears or domestic sheep

Madagascar mouse lemur retroviruses are diverse, similar to ones found in polar bears or domestic sheep
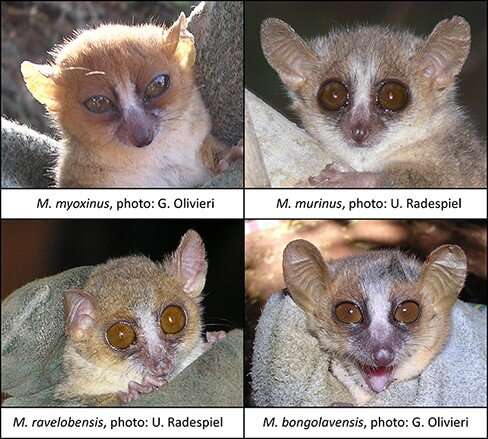
Photos of the four studied mouse lemur species: M. myoxinus, photo: G. Olivieri, 2003; 
M. murinus, photo: U. Radespiel, 2013; M. ravelobensis, photo: U. Radespiel, 2004;
 M. bongolavensis, photo: G. Olivieri, 2003. 
Credit: Virus Evolution (2022). DOI: 10.1093/ve/veac117

Madagascar is home to a unique biodiversity with a large number of endemic species, among those many lemur species, including the mouse lemurs. This diversity is also found in their retroviruses, a team led by scientists from the Leibniz Institute of Zoo and Wildlife Research (Leibniz-IZW) and the University of Stirling reports in the journal Virus Evolution.

They analyzed the mouse lemur genome and identified  of two classes that represent ancient infections of the mouse lemur germline. The viruses now behave similarly to lemur genes and are thus called  (ERVs). It was surprising that some of the identified  are closely related to viruses found in other, very different mammals such as  or . This suggests an intriguing and complex pattern of host switching of retroviruses, much more complex than previously thought.

For their analysis, the team collected  from four species of Malagasy mouse lemurs and screened them using high throughput sequencing. The scientists identified two gamma and three beta retrovirus sequences in the lemurs' genomes, representing ancient infections of the mouse lemur germlines. Since then, the virus DNA has been incorporated in the host genomes and the viruses are no longer active or infectious.

"We were surprised to find that one of the two identified gamma retroviruses was related to an ERV described in polar bears," states Dr. Sharon Kessler, a German Academic Exchange Service (DAAD) supported scientist and Assistant Professor at the University of Stirling. The polar bear virus is young from an evolutionary point of view whereas the lemur virus is old. "How these related viruses infected such geographically separated species is unclear," Kessler says.

There were further surprises among the beta retroviruses. A virulent retrovirus that infects domestic sheep called Jaagsiekte sheep retrovirus (JSRV), which also forms ERVs in domestic sheep, is thought to be a virus confined to domestic sheep, goats and their relatives—the first cloned sheep "Dolly" had to be euthanized after a JSRV infection and subsequent illness. The mouse lemurs have a closely related JSRV-like virus in their genome.

"This suggests that JSRV-like viruses have been more widespread among mammals and are considerably older than previously thought. Why they only show up in such disparate species and in such a punctuated way is curious," says Prof Alex Greenwood, head of the Leibniz-IZW Department of Wildlife Diseases, where the sample screening was conducted. Similarly, the team also identified a virus in the  related to retroviruses found in squirrel monkeys, vampire bats and marsupials.

"This group of viruses is becoming more interesting over time as more and more examples of similar viruses are being found in many places including very young ones that may still have currently infectious exogenous counterparts in nature," says Greenwood.

Much of the mouse lemur retroviral diversity observed is associated with non-primate viruses, suggesting a complex pattern of viral host switching around the time the ancestors of lemurs colonized Madagascar. Further studies of viral diversity will help to clarify the complex history of retroviral transmission among mammals.

Retroviruses are viruses that replicate by incorporating their genetic material into the genome of a host cell. If the  is a germ cell, the retrovirus can subsequently be passed on as an "endogenous" retrovirus and spread throughout a population as part of the host genome.

Repeated infections have resulted in endogenous retroviruses being ubiquitous in mammalian genomes, sometimes making up significant portions of the host genome. However, most  integrations are very old and already degraded and therefore inactive—their initial impact on host health reduced by millions of years of evolution.

More information: Sharon E Kessler et al, Long-term host–pathogen evolution of endogenous beta- and gammaretroviruses in mouse lemurs with little evidence of recent retroviral introgression, Virus Evolution (2022). DOI: 10.1093/ve/veac117