Tuesday, July 18, 2023

SPACE

Astronomers explore the chromosphere of peculiar white dwarfs
Observations explore the chromosphere of peculiar white dwarfs
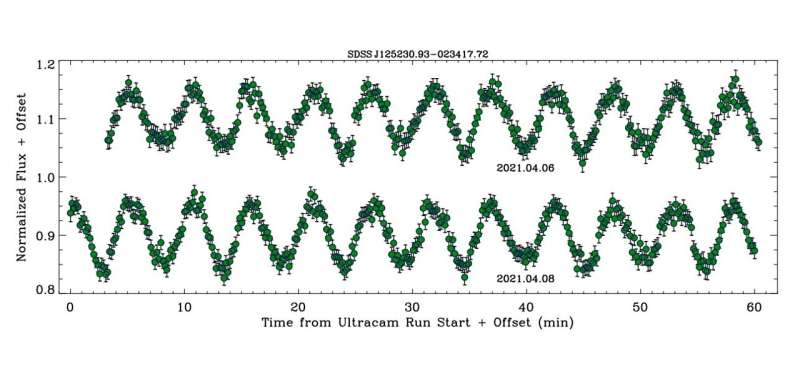
Approximately 1 h of ULTRACAM g-band light curves for SDSS J1252, each taken on a
 different night. Credit: Farihi et al, 2023

Using the 3.6-m New Technology Telescope (NTT) at the La Silla Observatory in Chile, astronomers have observed three peculiar white dwarfs of the DAHe subtype. In their results, they found dipolar chromospheres in two of these objects. The findings were reported in a paper published July 5 on the preprint server arXiv.

White dwarfs (WDs) are stellar cores left behind after a star has exhausted its nuclear fuel. Due to their high gravity, they are known to have atmospheres of either pure hydrogen or pure helium. However, a small fraction of WDs shows traces of heavier elements.

DAHe (D: degenerate, A: Balmer lines strongest, H: magnetic line splitting, e: emission) is a relatively new and small class of magnetic white dwarfs that showcase Zeeman-split Balmer emission lines. To date, only a few dozen DAHe WDs are known. The first of them was GD 356—an isolated white dwarf discovered nearly 40 years ago.

A team of astronomers led by Jay Farihi of the University College London, U.K., decided to investigate three objects of this rare class, in order to better understand the nature of the entire population. For this purpose, they employed ULTRACAM—a frame-transfer CCD imaging camera mounted on the NTT telescope. The study was complemented by data from NASA's Transiting Exoplanet Survey Satellite (TESS).

"This study focuses on light curves and the resulting periodicities of three DAHe white dwarfs, using both ground- and space-based photometric monitoring," the researchers wrote.

The three observed DAHe WDs were: SDSS J125230.93−023417.7 (or SDSS J1252 for short), LP 705-64 and WD J143019.29−562358.3 (WD J1430). It turned out that the folded ULTRACAM light curves of SDSS J1252 and LP 705-64 exhibit alternating minima that are indicative of two distinct star spots 180 degrees out-of-phase during rotation. For WD J1430, the light curves reveal a single maximum and minimum.

The astronomers found that the amplitudes of the multi-band photometric variability reported for all the three DAHe  are all several times larger than that in GD 356. They noted that all the known DAHe stars have light curve amplitudes that increase toward the blue in correlated ratios, which points to cool spots that produce higher contrasts at .

According to the authors of the paper, their findings suggest that some magnetic WDs create intrinsic chromospheres as they cool, and that no external source is responsible for the observed temperature inversion.

"Given the lack of additional periodic signals and the compelling evidence of DAHe white dwarf clustering in the HR diagram (Walters et al, 2021; Reding et al, 2023; Manser et al, 2023), an intrinsic mechanism is the most likely source for the spotted regions and chromospheric activity," the researchers concluded.

More information: J. Farihi et al, Discovery of Dipolar Chromospheres in Two White Dwarfs, arXiv (2023). DOI: 10.48550/arxiv.2307.02543


Journal information: arXiv 


© 2023 Science X Network


Astronomers discover eight new cataclysmic variables


 Two White Dwarfs


SLEEPY


XRISM mission to study ‘rainbow’ of X-rays


Business Announcement

NASA/GODDARD SPACE FLIGHT CENTER

XRISM Spacecraft 

IMAGE: XRISM, SHOWN IN THIS ARTIST’S CONCEPT, IS AN X-RAY MISSION THAT WILL STUDY SOME OF THE MOST ENERGETIC OBJECTS IN THE UNIVERSE. view more 

CREDIT: NASA'S GODDARD SPACE FLIGHT CENTER CONCEPTUAL IMAGE LAB


A new satellite called XRISM (X-ray Imaging and Spectroscopy Mission, pronounced “crism”) aims to pry apart high-energy light into the equivalent of an X-ray rainbow. The mission, led by JAXA (Japan Aerospace Exploration Agency), will do this using an instrument called Resolve.

XRISM is scheduled to launch from Japan’s Tanegashima Space Center on Aug. 25, 2023 (Aug. 26 in Japan).

“Resolve will give us a new look into some of the universe’s most energetic objects, including black holes, clusters of galaxies, and the aftermath of stellar explosions,” said Richard Kelley, NASA’s XRISM principal investigator at NASA’s Goddard Space Flight Center in Greenbelt, Maryland. “We’ll learn more about how they behave and what they’re made of using the data the mission collects after launch.”

Resolve is an X-ray microcalorimeter spectrometer instrument collaboration between NASA and JAXA. It measures tiny temperature changes created when an X-ray hits its 6-by-6-pixel detector. To measure that minuscule increase and determine the X-ray’s energy, the detector needs to cool down to around minus 460 Fahrenheit (minus 270 Celsius), just a fraction of a degree above absolute zero.

The instrument reaches its operating temperature after a multistage mechanical cooling process inside a refrigerator-sized container of liquid helium.

By collecting thousands or even millions of X-rays from a cosmic source, Resolve can measure high-resolution spectra of the object. Spectra are measurements of light’s intensity over a range of energies. Prisms spread visible light into its different energies, which we know better as the colors of the rainbow. Scientists used prisms in early spectrometers to look for spectral lines, which occur when atoms or molecules absorb or emit energy.

Now astronomers use spectrometers, tuned to all kinds of light, to learn about cosmic objects’ physical states, motions, and compositions. Resolve will do spectroscopy for X-rays with energies ranging from 400 to 12,000 electron volts by measuring the energies of individual X-rays to form a spectrum. (For comparison, visible light energies range from about 2 to 3 electron volts.)

“The spectra XRISM collects will be the most detailed we’ve ever seen for some of the phenomena we’ll observe,” said Brian Williams, NASA’s XRISM project scientist at Goddard. “The mission will provide us with insights into some of the most difficult places to study, like the internal structures of neutron stars and near-light-speed particle jets powered by black holes in active galaxies.”

The mission’s other instrument, developed by JAXA, is called Xtend. It will give XRISM one of the largest fields of view of any X-ray imaging satellite flown to date, observing an area about 60% larger than the average apparent size of the full Moon.

Resolve and Xtend rely on two identical X-ray Mirror Assemblies developed at Goddard.

XRISM is a collaborative mission between JAXA and NASA, with participation by ESA (European Space Agency). NASA’s contribution includes science participation from the Canadian Space Agency.


SwRI team identifies giant swirling waves at the edge of Jupiter’s magnetosphere


Waves produced by Kelvin-Helmholtz instabilities transfer energy in the solar system

Peer-Reviewed Publication

SOUTHWEST RESEARCH INSTITUTE

KHI at Jupiter 

IMAGE: AN SWRI-LED TEAM IDENTIFIED INTERMITTENT EVIDENCE OF KELVIN-HELMHOLTZ INSTABILITIES, GIANT SWIRLING WAVES, AT THE BOUNDARY BETWEEN JUPITER’S MAGNETOSPHERE AND THE SOLAR WIND THAT FILLS INTERPLANETARY SPACE, MODELED HERE BY UNIVERSITY CORPORATION FOR ATMOSPHERIC RESEARCH SCIENTISTS IN A 2017 GRL PAPER. view more 

CREDIT: UCAR/ZHANG, ET.AL.


SAN ANTONIO — July 17, 2023 —A team led by Southwest Research Institute (SwRI) and The University of Texas at San Antonio (UTSA) has found that NASA’s Juno spacecraft orbiting Jupiter frequently encounters giant swirling waves at the boundary between the solar wind and Jupiter’s magnetosphere. The waves are an important process for transferring energy and mass from the solar wind, a stream of charged particles emitted by the Sun, to planetary space environments.

Jake Montgomery, a doctoral student in the joint space physics program between UTSA and SwRI, noted that these phenomena occur when a large difference in velocity forms across the boundary between two regions in space. This can create a swirling wave, or vortex, at the interface that separates a planet’s magnetic field and the solar wind, known as the magnetopause. These Kelvin-Helmholtz waves are not visible to the naked eye but can be detected through instrument observations of plasma and magnetic fields in space. Plasma — a fundamental state of matter made up of charged particles, ions and electrons — is ubiquitous across the universe.

“Kelvin-Helmholtz instabilities are a fundamental physical process that occurs when solar and stellar winds interact with planetary magnetic fields across our solar system and throughout the universe,” Montgomery said. “Juno observed these waves during many of its orbits, providing conclusive evidence that Kelvin-Helmholtz instabilities play an active role in the interaction between the solar wind and Jupiter.”

Montgomery is the lead author of a study published in Geophysical Research Letters that uses data from multiple Juno instruments, including its magnetometer and the SwRI-built Jovian Auroral Distributions Experiment (JADE).

“Juno’s extensive time near Jupiter’s magnetopause has enabled detailed observations of phenomena such as Kelvin-Helmholtz instabilities in this region,” said Dr. Robert Ebert, a staff scientist at SwRI who also serves as an adjoint professor at UTSA. “This solar wind interaction is important as it can transport plasma and energy across the magnetopause, into Jupiter’s magnetosphere, driving activity within that system.”

The paper “Investigating the Occurrence of Kelvin-Helmholtz Instabilities at Jupiter’s Dawn Magnetopause” appears in Geophysical Research Letters and can be accessed at https://doi.org/10.1029/2023GL102921.

For more information, visit https://www.swri.org/planetary-science.


How fish evolved their bony, scaly armor

How fish evolved their bony, scaly armor
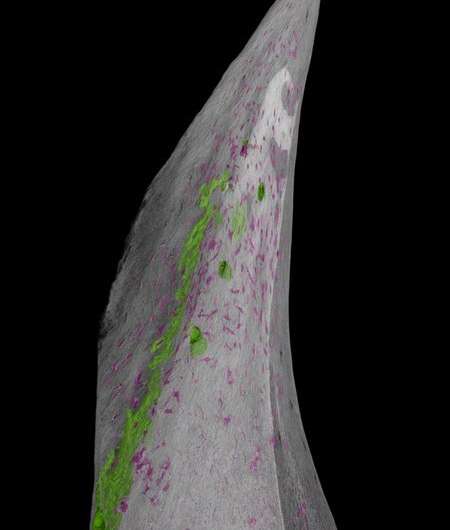
A reconstruction of a single sturgeon scute, close up. Bone-forming cells are marked in 
magenta. Credit: J. Stundl

About 350 million years ago, your evolutionary ancestors—and the ancestors of all modern vertebrates—were merely soft-bodied animals living in the oceans. In order to survive and evolve to become what we are today, these animals needed to gain some protection and advantage over the ocean's predators, which were then dominated by crustaceans.

The evolution of dermal armor, like the sharp spines found on an armored catfish or the bony diamond-shaped scales, called scutes, covering a sturgeon, was a successful strategy. Thousands of species of fish utilized varying patterns of dermal armor, composed of bone and/or a substance called dentine, an important component of modern human teeth. Protective coatings like these helped vertebrates survive and evolve further into new animals and ultimately humans.

But where did this armor come from? How did our ancient underwater ancestors evolve to grow this protective coat?

Now, using sturgeon fish, a new study finds that a specific population of stem cells, called trunk , are responsible for the development of bony scutes in fish. The work was conducted by Jan Stundl, now a Marie Sklodowska-Curie postdoctoral scholar in the laboratory of Marianne Bronner, the Edward B. Lewis Professor of Biology and director of the Beckman Institute at Caltech. A paper describing the research appears in the journal Proceedings of the National Academy of Sciences on July 17.

The Bronner laboratory has long been interested in studying neural crest cells. Found in all vertebrates including fish, chickens, and ourselves, these cells become specialized based on whether they arise from the head (cranial) or spinal cord (trunk) regions. Both cranial and trunk neural crest cells migrate from their starting points throughout the animal's developing body, giving rise to the cells that make up the jaws, heart, and other important structures.

After a 2017 study from the University of Cambridge showed that trunk neural crest cells give rise to dentine-based dermal armor in a type of fish called the little skate, Stundl and his colleagues hypothesized that the same population of cells might also give rise to bone-based armor in vertebrates broadly.

To study this, Stundl and the team turned to the sturgeon fish, specifically the sterlet sturgeon (Acipenser ruthenus). Modern sturgeons, best known for their production of the world's most expensive caviar, still have many of the same characteristics as their ancestors from millions of years ago. This makes them prime candidates for .

How fish evolved their bony, scaly armor
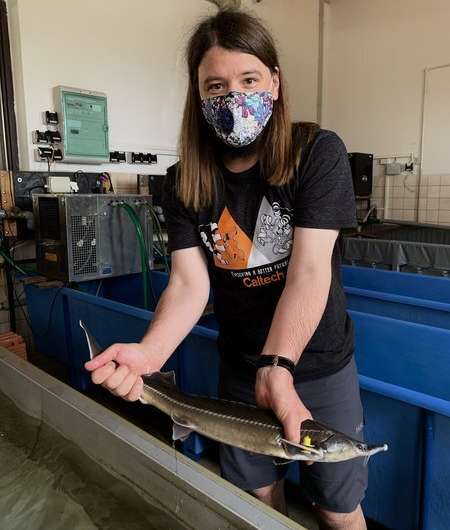
Jan Stundl holds a sturgeon fish in the laboratory. Credit: J. Stundl

Using sturgeon embryos grown at the Research Institute of Fish Culture and Hydrobiology in the Czech Republic, Stundl and his team used fluorescent dye to track how the fish's trunk neural crest cells migrated throughout its developing body. Sturgeons begin to develop their bony scutes after a couple of weeks, so the researchers kept the growing fish in a darkened lab in order to not disturb the  with light.

The team found fluorescently labeled trunk neural crest cells in the exact locations where the sturgeon's bony scutes were forming. They then used a different technique to highlight the fish's osteoblasts, a type of cell that forms bone. Genetic signatures associated with osteoblast differentiation were found in the fluorescent cells in the fish's developing scutes, providing strong evidence that the trunk neural crest cells do in fact give rise to bone-forming cells.

Combined with the 2017 findings about neural crest cells' role in forming dentine-based armor, the work shows that trunk neural crest cells are indeed responsible for giving rise to the bony dermal armor that enabled the evolutionary success of vertebrate .

"Working with non-model organisms is tricky; the tools that exist in standard lab organisms like mouse or zebrafish either do not work or need to be significantly adapted," says Stundl. "Despite these challenges, information from non-model organisms like  allows us to answer fundamental evolutionary developmental biology questions in a rigorous manner."

"By studying many animals on the tree of life, we can infer what evolutionary events have taken place," says Bronner. "This is particularly powerful if we can approach evolutionary questions from a developmental biology perspective, since many changes that led to diverse cell types occurred via small alterations in embryonic development."

The paper is titled "Ancient vertebrate dermal armor evolved from trunk neural ."

More information: Jan Stundl et al, Ancient vertebrate dermal armor evolved from trunk neural crest, Proceedings of the National Academy of Sciences (2023). DOI: 10.1073/pnas.2221120120


Droughts in Western states drive up emissions and threaten human health

hydropower
Credit: CC0 Public Domain

When drought-stricken rivers and reservoirs run low across the American West, hydropower dries up and utilities fire up hundreds of power plants that burn coal, oil, or natural gas to keep up with demand for electricity. The timing couldn't be worse, as accompanying heat waves drive up energy use, often to power air conditioners.

A new Stanford University study finds these overlooked consequences of drought dramatically increase , methane leakage, and local air pollution and deaths caused by poor air quality.

Together, the social and economic cost of these impacts have cost 11 Western states tens of billions of dollars over the past two decades, according to the study, which was published July 6 in Proceedings of the National Academy of Sciences. In California alone, the increase in fossil generation caused by drought between 2012 and 2016 led to more than $5 billion in damages, two-and-a-half times the direct economic cost of switching from cheap hydropower to pricey fossil fuels.

Because climate change is making droughts in the American West more frequent and severe, the results indicate failure to account for these effects leads governments to underestimate the social and economic costs of global warming—and the worth of investments to combat it.

"Our research suggests the impact on , air pollution, and  could represent a large and unaccounted-for cost of climate change," said lead study author Minghao Qiu, a postdoctoral scholar in the Stanford Doerr School of Sustainability and Stanford Center for Innovation in Global Health.

Not a local story

Qiu and co-authors estimate the total health and economic damages from drought-induced fossil electricity generation between 2001 and 2021 in U.S. Western states amounted to $20 billion, with the cost of carbon emissions accounting for the lion's share of that damage at $14 billion. Deaths associated with additional air pollution account for $5.1 billion and methane leakage accounts for just under $1 billion of the damage.

Like many climate impacts, these damages often bleed across borders. When hydropower runs low in Northwestern states that normally export electricity to regional neighbors, for example, communities in California and the Southwest feel the effects as fossil fuel  fire up to fill the gap.

"This is not a local story. A climate shock in one place can have serious ramifications for a totally different geographic area due to the interconnected nature of many energy systems," said Qiu, who works with senior study author Marshall Burke as part of the Environmental Change and Human Outcomes Lab at Stanford.

While the study focused on the American West, the researchers stress that many countries relying on hydropower around the world are facing greater drought risk due to . In places where high-emitting coal-fired power plants are the most likely replacement for lost hydropower, the authors write that the economic and health damages from deteriorated air quality and greenhouse gas emissions will be higher than in U.S. Western states, which more often turn to .

"Our findings have implications for many other parts of the world that depend on hydropower but could face increasing drought," said Burke, an associate professor in the global environmental policy area of the Stanford Doerr School of Sustainability's social sciences division. "In these regions, drought's interaction with the energy system can have a cascading series of negative impacts on emissions and health."

More renewable energy needed

The authors calculated damages based on widely accepted estimates for the costs of carbon and methane emissions, and the statistical value of a human life in the way that regulators calculate it, as well as the best available estimate for how much methane leaks to the atmosphere during the production, processing, and transportation of oil and gas (2.3% per unit of gas consumed).

In states that rely heavily on hydropower for , such as Washington, California, and Oregon, planet-warming emissions caused by drought-induced shifts in the energy supply could account for up to 40% of all greenhouse gas emissions from electricity in future drought years, the research shows, even as more solar, wind, and battery storage come online. The research suggests that increasingly frequent droughts will make it more challenging for the electricity sector to fully decarbonize and hydro-reliant states will need to pursue extra initiatives to achieve net-zero emission goals.

That's because when electricity demand spikes, utilities generally turn to fossil fuels to temporarily boost supply. In the coming decades, even as  and energy storage cover more of the overall average demand for electricity in the American West, fossil fuel based power plants are projected to remain the dominant energy source for these marginal energy needs.

"If we want to solve this issue, we need an even greater expansion of renewable energy alongside better energy storage, so we don't need to tap into fossil fuels as much," said Qiu. "Ultimately, to limit future warming and the drought risks that come with it, we need to reduce our emissions."

More information: Minghao Qiu et al, Drought impacts on the electricity system, emissions, and air quality in the western United States, Proceedings of the National Academy of Sciences (2023). DOI: 10.1073/pnas.2300395120

ANARCHIST GAMES NEW EVENT

Study reveals older burglars outperform younger counterparts in virtual burglaries

burglary
Credit: Pixabay/CC0 Public Domain

A new study, published in the Journal of Experimental Criminology, examined the development of offense-related expertise in a sample of convicted burglars, depending on their age.

The results revealed significant differences between the younger (under 21) and older burglars (over 21) in their virtual burglary performances. Older burglars demonstrated more developed expertise in terms of items stolen and the efficiency of their search compared to their younger counterparts. These findings suggest that expertise plays a crucial role in offense-related decision-making across the criminal career.

Researchers from the University of Portsmouth compared indicators of expertise between the two groups as they completed a simulated "virtual burglary." The findings shed new light on the role of expertise in criminal decision-making and have implications for future crime prevention strategies and targeted interventions.

A total of 68 convicted burglars participated in the research, with 36 younger burglars and 32 older burglars taking part in the virtual burglary simulation. All participants were serving sentences in adult prisons or Young Offender Institutions in the UK.

Each offender was given the same virtual environment of a street of five terraced houses. Participants had to first choose which property to burgle and whether to access it through the front door or via an alleyway from the rear. They then had to work their way through the house which included a ground floor consisting of a hallway, kitchen, living room, and dining area. A master bedroom, nursery, study, and bathroom were located on the first floor, and an attic floor consisted of a games room and a third (teenager's) bedroom.

Valuable items were distributed alongside other items (food, books) in locations consistent with a typical home. Some items were placed in clear sight, while others were hidden (for example, a tablet in a rucksack). Participants were able to "steal" anything they wanted and doors, cupboards and drawers could be opened. All participant movements and interactions (i.e., distance traveled, time spent in different areas, items stolen) were recorded by the computer simulation and then analyzed by researchers.

The research was based on the concept of "expertise" which refers to the characteristics, skills and knowledge that distinguish experts from novices. Expertise is developed through repeated practice and learning from that experience. For offenders, expertise has been shown to influence various stages of decision-making, from recognizing relevant cues to guiding actions based on past events and experiences.

Dr. Amy Meenaghan, School of Criminology and Criminal Justice at the University of Portsmouth says, "One of the major implications of this research is its potential to inform crime prevention strategies and offender rehabilitation initiatives. By understanding the  associated with expertise in offending behavior, experts can design crime prevention strategies that disrupt the offense decision chain and so deter further criminal activity."

"This is a significant step forward in applying cognitive psychology concepts to understand . By using  as a safe and effective proxy for real-life behavior, we have been able to gain unique insights into the decision-making process of burglars."

The researchers hope this study will encourage further exploration of the impact of expertise on offending behavior and contribute to evidence-based approaches to reducing criminal activity and promoting societal safety.

More information: Amy Meenaghan et al, A comparison of younger and older burglars undertaking virtual burglaries: the development of skill and automaticity, Journal of Experimental Criminology (2023). DOI: 10.1007/s11292-023-09573-x


Crime fighting just got easier as burglars reveal all


System tracks movement of food through global humanitarian supply chain

System tracks movement of food through global humanitarian supply chain
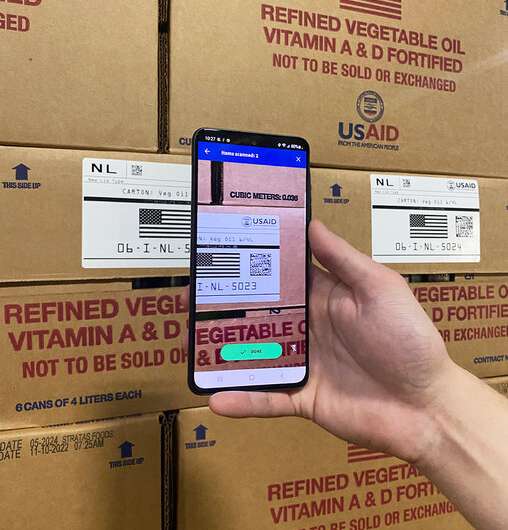
Users of a new mobile app can scan barcodes to access the history of commodities and 
report damage to individual cans with photographs of the damage and geolocation and 
timestamp data. Credit: Lincoln Laboratory researchers.

Although more than enough food is produced to feed everyone in the world, as many as 828 million people face hunger today. Poverty, social inequity, climate change, natural disasters, and political conflicts all contribute to inhibiting access to food. For decades, the U.S. Agency for International Development (USAID) Bureau for Humanitarian Assistance (BHA) has been a leader in global food assistance, supplying millions of metric tons of food to recipients worldwide. Alleviating hunger—and the conflict and instability hunger causes—is critical to U.S. national security.

But BHA is only one player within a large, complex  in which food gets handed off between more than 100 partner organizations before reaching its final destination. Traditionally, the movement of food through the supply chain has been a black-box operation, with stakeholders largely out of the loop about what happens to the food once it leaves their custody. This lack of direct visibility into operations is due to siloed data repositories, insufficient data sharing among stakeholders, and different data formats that operators must manually sort through and standardize. As a result, accurate, —such as where food shipments are at any given time, which shipments are affected by delays or food recalls, and when shipments have arrived at their final destination—is lacking. A centralized system capable of tracing food along its entire journey, from manufacture through delivery, would enable a more effective humanitarian response to food-aid needs.

In 2020, a team from MIT Lincoln Laboratory began engaging with BHA to create an intelligent dashboard for their supply-chain operations. This dashboard brings together the expansive food-aid datasets from BHA's existing systems into a single platform, with tools for visualizing and analyzing the data. When the team started developing the dashboard, they quickly realized the need for considerably more data than BHA had access to.

"That's where traceability comes in, with each handoff partner contributing key pieces of information as food moves through the supply chain," explains Megan Richardson, a researcher in the laboratory's Humanitarian Assistance and Disaster Relief Systems Group.

Richardson and the rest of the team have been working with BHA and their partners to scope, build, and implement such an end-to-end traceability system. This system consists of serialized, unique identifiers (IDs)—akin to fingerprints—that are assigned to individual food items at the time they are produced. These individual IDs remain linked to items as they are aggregated along the supply chain, first domestically and then internationally. For example, individually tagged cans of vegetable oil get packaged into cartons; cartons are placed onto pallets and transported via railway and truck to warehouses; pallets are loaded onto shipping containers at U.S. ports; and pallets are unloaded and cartons are unpackaged overseas.

With a trace

Today, visibility at the single-item level doesn't exist. Most suppliers mark pallets with a lot number (a lot is a batch of items produced in the same run), but this is for internal purposes (i.e., to track issues stemming back to their production supply, like over-enriched ingredients or machinery malfunction), not data sharing. So, organizations know which supplier lot a pallet and carton are associated with, but they can't track the unique history of an individual carton or item within that pallet. As the lots move further downstream toward their final destination, they are often mixed with lots from other productions, and possibly other  types altogether, because of space constraints. On the international side, such mixing and the lack of granularity make it difficult to quickly pull commodities out of the supply chain if food safety concerns arise. Current response times can span several months.

"Commodities are grouped differently at different stages of the supply chain, so it is logical to track them in those groupings where needed," Richardson says. "Our item-level granularity serves as a form of Rosetta Stone to enable stakeholders to efficiently communicate throughout these stages. We're trying to enable a way to track not only the movement of commodities, including through their lot information, but also any problems arising independent of lot, like exposure to high humidity levels in a warehouse. Right now, we have no way to associate commodities with histories that may have resulted in an issue."

"You can now track your checked luggage across the world and the fish on your dinner plate," adds Brice MacLaren, also a researcher in the laboratory's Humanitarian Assistance and Disaster Relief Systems Group. "So, this technology isn't new, but it's new to BHA as they evolve their methodology for commodity tracing. The traceability system needs to be versatile, working across a wide variety of operators who take custody of the commodity along the supply chain and fitting into their existing best practices."

As  make their way through the supply chain, operators at each receiving point would be able to scan these IDs via a Lincoln Laboratory-developed  (app) to indicate a product's current location and transaction status—for example, that it is en route on a particular shipping container or stored in a certain warehouse. This information would get uploaded to a secure traceability server. By scanning a product, operators would also see its history up until that point.

Hitting the mark

At the laboratory, the team tested the feasibility of their traceability technology, exploring different ways to mark and scan items. In their testing, they considered barcodes and radio-frequency identification (RFID) tags and handheld and fixed scanners. Their analysis revealed 2D barcodes (specifically data matrices) and smartphone-based scanners were the most feasible options in terms of how the technology works and how it fits into existing operations and infrastructure.

"We needed to come up with a solution that would be practical and sustainable in the field," MacLaren says. "While scanners can automatically read any RFID tags in close proximity as someone is walking by, they can't discriminate exactly where the tags are coming from. RFID is expensive, and it's hard to read commodities in bulk. On the other hand, a phone can scan a barcode on a particular box and tell you that code goes with that box. The challenge then becomes figuring out how to present the codes for people to easily scan without significantly interrupting their usual processes for handling and moving commodities."

As the team learned from partner representatives in Kenya and Djibouti, offloading at the ports is a chaotic, fast operation. At manual warehouses, porters fling bags over their shoulders or stack cartons atop their heads any which way they can and run them to a drop point; at bagging terminals, commodities come down a conveyor belt and land this way or that way. With this variability comes several questions: How many barcodes do you need on an item? Where should they be placed? What size should they be? What will they cost? The laboratory team is considering these questions, keeping in mind that the answers will vary depending on the type of commodity; vegetable oil cartons will have different specifications than, say, 50-kilogram bags of wheat or peas.

Leaving a mark

Leveraging results from their testing and insights from international partners, the team has been running a traceability pilot evaluating how their proposed system meshes with real-world domestic and international operations. The current pilot features a domestic component in Houston, Texas, and an international component in Ethiopia, and focuses on tracking individual cartons of vegetable oil and identifying damaged cans. The Ethiopian team with Catholic Relief Services recently received a container filled with pallets of uniquely barcoded cartons of vegetable oil cans (in the next pilot, the cans will be barcoded, too). They are now scanning items and collecting data on product damage by using smartphones with the laboratory-developed mobile traceability app on which they were trained.

"The partners in Ethiopia are comparing a couple lid types to determine whether some are more resilient than others," Richardson says. "With the app—which is designed to scan commodities, collect transaction data, and keep history—the partners can take pictures of damaged cans and see if a trend with the lid type emerges."

Next, the team will run a series of pilots with the World Food Program (WFP), the world's largest humanitarian organization. The first pilot will focus on data connectivity and interoperability, and the team will engage with suppliers to directly print barcodes on individual commodities instead of applying barcode labels to packaging, as they did in the initial feasibility testing. The WFP will provide input on which of their operations are best suited for testing the traceability system, considering factors like the network bandwidth of WFP staff and local partners, the commodity types being distributed, and the country context for scanning. The BHA will likely also prioritize locations for system testing.

"Our goal is to provide an infrastructure to enable as close to real-time data exchange as possible between all parties, given intermittent power and connectivity in these environments," MacLaren says.

In subsequent pilots, the team will try to integrate their approach with existing systems that partners rely on for tracking procurements, inventory, and movement of commodities under their custody so that this information is automatically pushed to the traceability server. The team also hopes to add a capability for real-time alerting of statuses, like the departure and arrival of commodities at a port or the exposure of unclaimed commodities to the elements. Real-time alerts would enable stakeholders to more efficiently respond to food-safety events. Currently, partners are forced to take a conservative approach, pulling out more commodities from the supply chain than are actually suspect, to reduce risk of harm. Both BHA and WHP are interested in testing out a food-safety event during one of the pilots to see how the traceability system works in enabling rapid communication response.

To implement this technology at scale will require some standardization for marking different commodity types as well as give and take among the partners on best practices for handling commodities. It will also require an understanding of country regulations and partner interactions with subcontractors, government entities, and other stakeholders.

"Within several years, I think it's possible for BHA to use our system to mark and trace all their food procured in the United States and sent internationally," MacLaren says.

Once collected, the trove of traceability data could be harnessed for other purposes, among them analyzing historical trends, predicting future demand, and assessing the carbon footprint of commodity transport. In the future, a similar traceability system could scale for nonfood items, including medical supplies distributed to disaster victims, resources like generators and water trucks localized in emergency-response scenarios, and vaccines administered during pandemics. Several groups at the laboratory are also interested in such a system to track items such as tools deployed in space or equipment people carry through different operational environments.

"When we first started this program, colleagues were asking why the laboratory was involved in simple tasks like making a dashboard, marking items with barcodes, and using hand scanners," MacLaren says. "Our impact here isn't about the technology; it's about providing a strategy for coordinated food-aid response and successfully implementing that strategy. Most importantly, it's about people getting fed."

This story is republished courtesy of MIT News (web.mit.edu/newsoffice/), a popular site that covers news about MIT research, innovation and teaching.


Could the blockchain restore consumer trust and food security?