Saturday, August 19, 2023


Mapping methane emissions from rivers around globe reveals surprising sources
Mapping methane emissions from rivers around globe reveals surprising sources
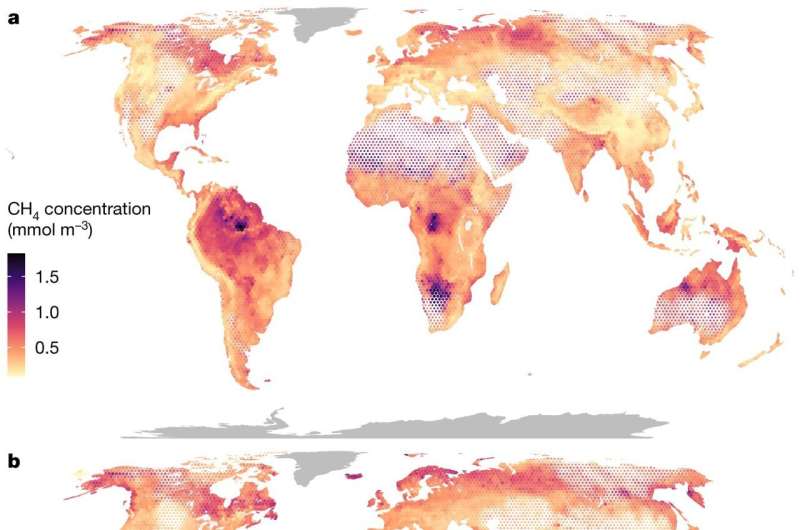
Global patterns of CH4 in rivers and streams. a,b, Modeled yearly average CH4 concentrations (a) and emissions (b) in rivers and streams. Data have been aggregated in hexagonal bins, and the size of each hexagon is rescaled with runoff, to better visualize patterns in areas with high coverage of running waters. Areas with runoff greater than 1,500 mm per year have full-sized hexagons; hexagons in areas with runoff of 500 mm per year have been reduced by 10%; and hexagons with a runoff less than 50 mm per year have been reduced by 50%. The model could not be applied in Greenland and Antarctica, which are shown in dark gray. Credit: Nature (2023). DOI: 10.1038/s41586-023-06344-6

Freshwater ecosystems account for half of global emissions of methane, a potent greenhouse gas that contributes to global warming. Rivers and streams, especially, are thought to emit a substantial amount of that methane, but the rates and patterns of these emissions at global scales remain largely undocumented.

An international team of researchers, including University of Wisconsin–Madison freshwater ecologists, has changed that with a new description of the global rates, patterns and drivers of  emissions from running waters. Their findings, published today in the journal Nature, will improve methane estimates and models of climate change, and point to land-management changes and restoration opportunities that can reduce the amount of methane escaping into the atmosphere.

The new study confirms that rivers and  do, indeed, produce a lot of methane and play a major role in climate change dynamics. But the study also reveals some surprising results about how—and where—that methane is produced.

"We expected to find the highest methane emissions at the tropics, because the biological production of methane is highly sensitive to temperature," says Emily Stanley, a professor at UW–Madison's Center for Limnology and co-author of the Nature report. Instead, she says, their team found that methane emissions in the tropics were comparable to those in the much colder streams and rivers of boreal forests—pine-dominant forests that stretch around the Northern Hemisphere—and Arctic tundra habitats.

Temperature, it turns out, isn't the primary variable driving aquatic methane emissions. Instead, the study found, "the amount of methane coming out of streams and rivers regardless of their latitude or temperature was primarily controlled by the surrounding habitat connected to them," Stanley says.

Rivers and streams in boreal forests and  at  are often tied to peatlands and wetlands, while the dense forests of the Amazon and Congo river basins also supply the waters running through them with soils rich in organic matter. Both systems produce substantial amounts of methane because they often result in low-oxygen conditions preferred by microbes that produce methane while breaking down all that organic matter.

However, not all high methane rivers and streams come by these emissions naturally. In parts of the world, freshwater methane emissions are primarily controlled by  in both urban and rural communities.

"Humans are actively modifying river networks worldwide and, in general, these changes seem to favor methane emissions," says Gerard Rocher, lead author of the report and a postdoctoral researcher with both the Swedish University of Agricultural Sciences and the Blanes Centre of Advanced Studies in Spain.

Habitats that have been highly modified by humans—like ditched streams draining , rivers below , or concrete stormwater canals—also often result in the organic-matter-rich, oxygen-poor conditions that promote high methane production.

The significance of human involvement can be considered good news, according to Rocher.

"One implication of this finding is that freshwater conservation and restoration efforts could lead to a reduction in ," he says.

Slowing the flow of pollutants like fertilizer, human and animal waste or excessive topsoil into rivers and streams would help limit the ingredients that lead to high methane production in freshwater systems.

"From a climate change perspective, we need to worry more about systems where humans are creating circumstances that produce methane than the natural cycles of methane production," Stanley says.

The study also demonstrates the importance of teams of scientists working to compile and examine gigantic datasets in understanding the scope of climate change. The results required a years-long collaboration between the Swedish University of Agricultural Sciences, UmeĆ„ University, UW–Madison and other institutions around the world. They collected methane measurements on rivers and streams across several countries, employed state-of-the-art computer modeling and machine learning to "massively expand" a dataset Stanley first began to compile with her graduate students back in 2015.

Now, Stanley says, "we have a lot more confidence in methane estimates." The researchers hope their results lead to better understanding of the magnitude and spatial patterns of all sources of methane into Earth's atmosphere, and that the new data improves large-scale models used to understand global climate and predict its future.

More information: Gerard Rocher-Ros et al, Global methane emissions from rivers and streams, Nature (2023). DOI: 10.1038/s41586-023-06344-6


Journal information: Nature 


Provided by University of Wisconsin-Madison Delaying methane mitigation increases risk of breaching Paris Agreement climate goal, study finds

Trees are not always a miracle cure for improving air quality

Geneva
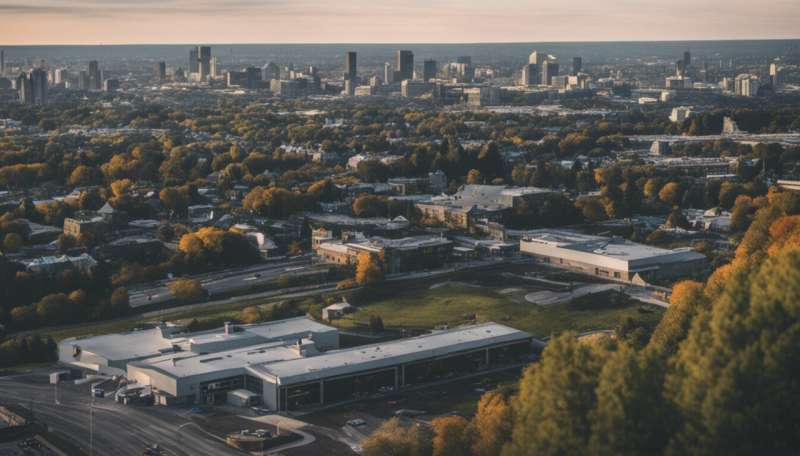
Credit: Unsplash/CC0 Public Domain

Donato Kofel has quantified the positive and negative effects of trees on outdoor air quality in Geneva Canton. His method can be used by city planners to design their large-scale planting programs more effectively.

For his EPFL Master's project in environmental sciences and engineering, Kofel delved into the world of geographic information systems (GIS), a type of advanced mapping software. "These maps convey a lot of information in a single image, in a way that lets people grasp it all immediately," he says.

For his Master's project at the end of his degree program, Kofel developed a new way to use the GIS application to study how trees in Geneva Canton are affecting the region's air quality. His work formed part of the broader URBTREES study being carried out by three labs at EPFL's School of Architecture, Civil and Environmental Engineering (ENAC): the Extreme Environments Research Laboratory, headed by Julia Schmale; the Plant Ecology Research Laboratory, headed by Charlotte Grossiord; and the Design Studio on the Conception of Space, headed jointly by Dieter Dietz and Daniel Zamarbide.

Positive and negative effects

To conduct his research, Kofel drew on a Geneva Canton tree inventory containing around 240,000 "isolated" trees, or trees located outside of a forest. These can be trees lining a boulevard, for example, or planted in a city park. The isolated trees in the Geneva inventory make up around 25% of the canton's total trees. The inventory lists several tree characteristics such as the species, location, trunk height, trunk diameter and crown diameter.

"I used these data to generate maps of the trees' total leaf area, which in turn gives an indication of their ability to filter out particulate matter from the air," says Kofel. In parallel, he also studied another important process: the trees' role in ozone formation and deposition.

Trees naturally emit biogenic volatile organic compounds (BVOCs) at a rate that depends on factors such as the tree species, air temperature and humidity, amount of sunlight and whether the trees have been damaged or stressed. These BVOCs are then converted into ozone through photochemical oxidation with other compounds in the air that are emitted by human activities—and ozone is known to negatively affect our health and the environment. He estimated the ozone forming potential of the trees' emissions: "I was surprised to find out that trees can also have a detrimental effect on air quality under certain conditions," says Kofel.

Credit: Ecole Polytechnique Federale de Lausanne

A quarter of particulate matter filtered

He began his Master's project by compiling the literature on the 51 most common tree species in Geneva Canton and using this information to calculate their hourly BVOC emission rates. He learns that some species of oak, the type of tree most often found along the canton's streets and in its parks, have some of the highest BVOC emission rates—and therefore the greatest ozone-forming potential—among all species he looked at.

Kofel worked with fellow EPFL Master's student Romana Paganini and scientist Ilann Bourgeois to run the data through the i-Tree Eco model. With this open-source application, they estimated how much particulate matter and ozone is filtered by the trees each year to emphasize the positive effect of urban trees.

Kofel's maps suggest that urban trees removed around 25% of particulate matter produced from anthropogenic activity in Geneva Canton (according to the 2014 emissions assessment for French-speaking Switzerland). He also found that the ozone-forming potential of these trees is around 10 times higher than their ozone-removing potential, and that they emit 130 metric tons of BVOCs per year—equal to around 18% of the VOCs emitted annually by .

The results show that anthropogenic activities emit enough nitrogen oxides for the right chemical reactions to happen. In other words, there is potential to reduce ozone formation coming from the trees by reducing human emissions of nitrogen oxides depending on the actual mix of BVOCs and nitrogen oxides.

No miracle cure in all conditions

So there's no clear-cut answer to just how good urban trees are for air quality when the combination with anthropogenic emissions can lead to additional air pollution. Kofel believes more in-depth studies are needed: "There are still some question marks surrounding our estimates, and I'm working to make them more robust. Also we did not take into account the formation potential of  from BVOCs," he says.

"But for now, our findings show that even though  can make a major contribution to improving urban air quality, they're not a miracle cure in all conditions. The problem of air pollution needs to be tackled at the source by addressing the issue of road traffic and other emission sources." Kofel adds that once he has finalized his calculations,  can use his maps to determine which  are best suited for public areas in order to improve air quality in neighborhoods with the highest amount of air pollution.

One thing that motivated Kofel during his Master's project was knowing that Geneva Canton officials would be interested in his method and findings—he presented them twice to the air quality and noise pollution office of the canton's environment department. He's also preparing an article based on his Master's thesis for publication in a scientific journal.


Researchers improve air pollution exposure models using artificial intelligence and mobility data

Improved air pollution exposure models using artificial intelligence and mobility data
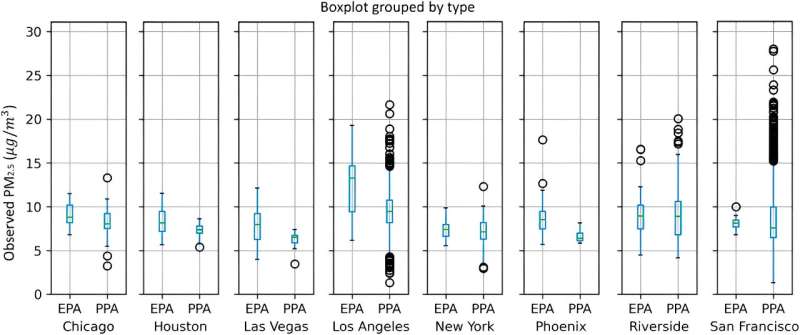
Boxplots of PM2.5 concentrations measured by EPA monitors and PurpleAir monitors in 
eight metropolitan areas. Each box extends from the first quartile (Q1) to the third quartile 
(Q3) of the data, with a line at the median. The whiskers extend from the box by 1.5x the
 interquartile range (IQR). Outlier points are those past the end of the whiskers.

Americans in the Northeast paid greater attention to air quality alerts this summer as wildfire smoke thickened skies with an orange-tinted haze. Smoke and other sources of air pollution contain tiny particles, called fine particulate matter (PM 2.5). Smaller than the width of a human hair, PM 2.5 pose health dangers when inhaled, especially to people with pre-existing heart and lung conditions.

To assess exposure to PM 2.5 and help  develop strategies, a Penn State-led research team has designed improved models using artificial intelligence and mobility data.

"Our research shows that incorporating artificial intelligence and mobility data into  models can improve the models and help  and public health officials prioritize areas that need extra monitoring or safety alerts because of unhealthy air quality or a combination of unhealthy air quality and high pedestrian traffic," said Manzhu Yu, assistant professor of geography at Penn State and first author of the study.

As reported in the journal Frontiers in Environmental Science, the researchers examined PM 2.5 measurements across eight large metropolitan areas in the continental United States. Air quality data came from Environmental Protection Agency (EPA) monitoring stations and low-cost sensors usually purchased and distributed by local community organizations. They used the data to find hourly PM 2.5 averages in each region.

The scientists input the air quality data into a land use regression model. The model uses local geographical factors like satellite-measured aerosol levels, also called aerosol optical depth; distance to nearest road or stream; elevation; vegetation; and meteorological conditions such as humidity and wind speed to examine how the factors affect air quality.

Past models have taken a linear approach to assessing air pollution, meaning that they assigned a fixed importance to each geographic factor and its impact on air quality, Yu explained. Certain factors like vegetation and meteorological conditions, however, cannot be represented this way because they change hourly or seasonally and may have  with other factors that affect air quality.

Yu and her colleagues took a nonlinear approach to better account for these changing or complex factors by incorporating automated —a type of  that automatically performs time-consuming tasks such as data preparation, parameter selection, and model selection and deployment—into the land use regression model.

The automated machine learning approach used an ensemble method, which allows the machine to run and combine multiple models, to identify the best-performing model for each region. The researchers also examined anonymized cell phone mobility data to pinpoint areas with unhealthy air quality and high visitor numbers.

The researchers found that their automated machine learning method with integrated data from low-cost sensors and EPA monitoring stations improved the accuracy of air pollution exposure models by an average of 17.5%, offering greater spatial variation than using regulatory monitors alone.

Yu credited the improved accuracy to the method's ability to better account for the dynamic variables of aerosol optical depth and meteorological factors, which consistently proved to be the most important across all study regions. The  component allowed the team to map potential hotspots within regions and times during the day and year when large numbers of people may be exposed to high PM 2.5 levels in these areas.

"Many areas may have consistently high air pollution levels, like those near factories and major transportation hubs, but that is not enough information to make a prioritized list of places needing extra monitoring or health alerts," she said.

"Our mobility-based exposure maps show public health officials and decision makers hotspots that have unhealthy air quality levels plus high visitor traffic. They can use this information to send alerts to people's mobile phones when they enter an area with really high PM 2.5 levels to reduce their exposure to unhealthy air quality."

More information: Manzhu Yu et al, Developing high-resolution PM2.5 exposure models by integrating low-cost sensors, automated machine learning, and big human mobility data, Frontiers in Environmental Science (2023). DOI: 10.3389/fenvs.2023.1223160

AI can help forecast air quality, but freak events like 2023's summer of wildfire smoke require traditional methods too


What's your masculine style: Neo-traditional, egalitarian or progressive?

gay men
Credit: Unsplash/CC0 Public Domain

Men navigate their intimate partner relationships depending on their masculine style, says new research led by UBC men's health expert John Oliffe.The study, which drew from in-depth interviews with 92 straight men ages 19 to 43 from diverse cultural backgrounds, found three types of masculinities:

  • Neo-traditionalists—Some men largely follow , such as being the provider and protector in the 
  • Egalitarian—Others seek a more equal partnership, with emphasis on mutuality and measurable give and take
  • Progressive—Other men work on building  in the partnership through regular, purposeful conversations with their partner to adjust who does what

"We set out to understand how different types of masculinities shape men's relationships and their . What we found was that these masculine types were associated with different benefits as well as challenges," noted Dr. Oliffe, the Canada Research Chair in Men's Health Promotion and a professor of nursing at UBC.

For instance, men who actively promoted  equity and  reported improved mental well-being—but Dr. Oliffe observes that men who challenged these ideals could face isolation or criticism from others, which can impact their mental . The study also found that some men with an egalitarian style still struggled to grasp the concept of achieving gender equality through splitting domestic tasks strictly 50-50.

"These shifts and stresses have implications for mental health," says Dr. Oliffe. "To promote meaningful change, we need to address the structures that influence men's behaviors."

The study is the latest from UBC's men's health research program to explore connections between masculinity and men's mental health.

"While men are becoming more involved in promoting gender equity, little is known about how younger men work to build partnerships in their ," notes Dr. Oliffe. "With this research, we hope we have helped map that uncharted space and point a way forward for healthier relationships that promote the health of men, their partners and families."

To share their findings, the team launched an online photo exhibition titled Men Building Intimate Partner Relationships featuring 120 photographs from more than 700 submitted by the study participants.

"There are photos depicting neo-traditional, egalitarian or progressive masculinity, and visitors are invited to take a quiz to decide which images fit with each masculinity. We're not only highlighting our research outcomes, we're also inviting input from visitors about how they see themselves—and how they build gender equity in their intimate partner relationships," says Dr. Nina Gao, research manager for the men's health research program.

The paper is published in the journal Social Science & Medicine.

More information: John L. Oliffe et al, Neo-traditionalist, egalitarian and progressive masculinities in Men's heterosexual intimate partner relationships, Social Science & Medicine (2023). DOI: 10.1016/j.socscimed.2023.116143


To reduce rising crime rates, Canada needs to invest more in social services

To reduce rising crime rates, Canada needs to invest more in social services
The Crime Severity Index is calculated like a crime rate, but different crimes are given a 
different weight, or importance, based on their severity. Credit: Shutterstock

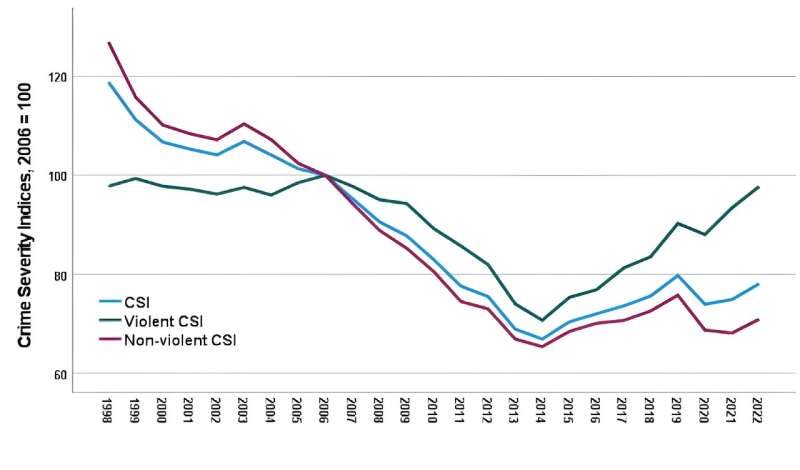
Every summer, Statistics Canada releases crime rate and crime severity data for the previous year. This year, Canada's Crime Severity Index (CSI) increased by 4.3 percent, the violent CSI increased by 4.6 percent, and the non-violent CSI increased by 4.1 percent. Moreover, aside from a drop during the COVID-19 pandemic, these indices have been on the rise since 2014.

An April 2023 poll found that 65 percent of Canadians felt crime has gotten worse compared to before the pandemic. Conservative Party leader Pierre Poilievre has criticized the Liberal government for the rising crime figures in recent months.

Canada's new justice minister, Arif Virani, said it was empirically unlikely that Canadians are less safe, but that the government would act to address feelings of growing insecurity.

But what is the CSI and what do changes in crime stats mean for Canadians?

What is the Crime Severity Index?

The CSI was introduced in 2009 and represented the first major change in measuring crime in Canada since the 1960s. Its purpose was to identify changes in the seriousness or severity of crime reported to the police.

The CSI is calculated like a but different crimes are given a different weight, or importance, based on their severity. Without this kind of system, a community that has 10 low-level assaults will have the same violent crime rate as another that has 10 homicides because each incident would be given the same weight.

The CSI accounts for this by using different weights for different crime types: approximately 80 for assault level 1, 7,000 for homicide and one for gambling. These weights are based on sentencing decisions in the court system.

Understanding the data

At first glance, the CSI is great because it allows us to determine which areas experience more violence. However, there are at least three issues when considering what changes in the CSI mean for most Canadians.

First, the CSI must be considered over longer periods of time than year-to-year fluctuations. We now have the CSI for 1998-2022, 25 years of data. Yes, the CSI has been increasing since 2014, but it is still much lower than it was 25 years ago.

Crime has been falling around the world, including Canada, since about 1990. It may be the case that 2014, for Canada, was just the low point for crime. Because of this, relatively small changes in incidents will have large percentage changes.

To reduce rising crime rates, Canada needs to invest more in social services
Police-reported crime severity indexes in Canada from 1998 to 2022. Credit: Statistics Canada

Second, because the CSI is calculated in a similar fashion to crime rates, places with lower populations will be "punished" by the CSI. For example, in a city of one million people, one homicide will lead to a homicide rate of 0.1 per 100,000 people. However, in a city of 15,000 people, one homicide will lead to a rate of 6.67 per 100,000 people.

Now if you add in the weights used in the CSI, this disparity becomes magnified. To be clear, the math is not wrong—it is just that the statistic has its limitations. The CSI is fine for Canada, its provinces and larger metropolitan centers. But, for the rest of the country, the CSI should be interpreted with caution.

Third, crime is usually concentrated in specific areas. Across the world, including Canada, one-half of crime reported to the police occurs in approximately five percent of the city. These places are, generally speaking, areas that experience more poverty, mental health and addiction problems, and other .

In short, those who are already suffering most, especially post-pandemic, are being victimized more with these increases in crime in Canada; this has been shown in Vancouver and Saskatoon.

Reducing crime

What should our takeaway be here? We need to be careful of how we interpret the CSI. Crime has been increasing the past eight years: homicide, sexual assault, assault (particularly with a weapon) and vehicle theft are all increasing more than average. So, despite my caveats, crime has been increasing of late, particularly violent crimes.

The notable common thread in all of the media coverage of these violent attacks is the presence of mental health issues, addiction, homelessness and poverty. How did we get here? Over the past 40 years, conservative governments have defunded social programs and social services.

A result of these changes has been a decrease in social welfare and increases in social ills. Where we are today is the result of a 40-year process that we cannot expect to reverse in short order. We need to reinvest in  and services, knowing it will take time to see an impact.

Putting government funding back into  is a large component of the Defund the Police movement. Rather than continuing to spend on reactive models such as policing that do little more than criminalize poverty and disadvantage, we need to reinvest in preventive strategies that actually work.

To prevent crime, governments need to invest more in existing social welfare programs and reestablish social services such as basic income.

This spending on social welfare services and basic income should be viewed positively across the political spectrum as well. The provision of basic income and social services would both support vulnerable populations and be cost-effective.

If we are concerned about  and its severity, we should support reinvesting public funds into preventative strategies such as housing,  care,  and addiction services.

Provided by The Conversation 

This article is republished from The Conversation under a Creative Commons license. Read the original article.The Conversation


Deploying a huge antenna on the moon could study its insides

Deploying a huge antenna on the moon could study its insides
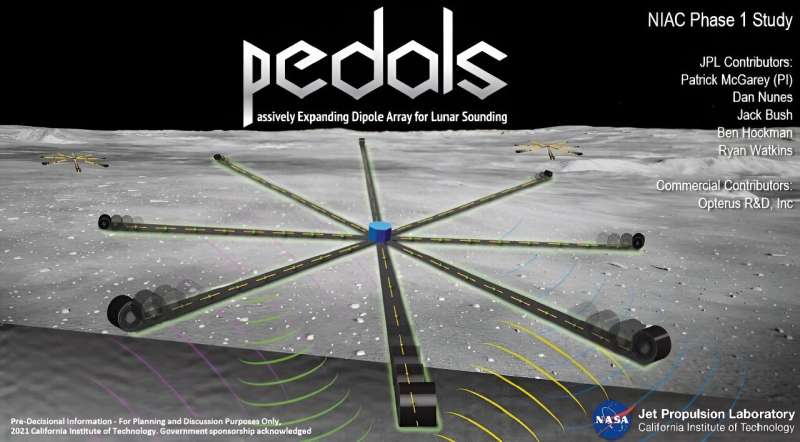
Artist’s depiction of the PEDALs antenna being unfurled & supporting info. 
Credit: McGarey et al. / NASA-JPL

Understanding what lies under the lunar surface could be critical to future exploration efforts. A series of missions have already mapped some parts of the sub-surface of the moon. Still, few have delved deep inside, where large lava caverns or potentially valuable water or mineral deposits may lie.

But that might be about to change. NASA's Institute for Advanced Concepts (NIAC) supplied funding to a novel technology developed by a team at its Jet Propulsion Laboratory (JPL) that could solve the long-standing problem of seeing what lies within the .

The project, the Passively Expanding Dipole Array for Lunar Sounding (or PEDALS), uses a self-deploying technique to position a large-scale antenna on the lunar surface. Once deployed, it can collect data on the lunar sub-surface down to a few kilometers, comparable with the deepest data we have ever collected.

Currently, the deepest data was collected by the Lunar Radar Sounder on the SELENE orbiter (better known as the Kayuga). However, it was intentionally crashed into the moon back in 2009, and, despite being able to monitor signals up to 5 km deep, it did not provide anything resembling a high-resolution image.

Other sounds, some of which date back as far as the later Apollo Missions, had a higher resolution but could reach the depth that would unlock a better understanding of the lunar surface's structure. A presentation created by the JPL team notes five scientific objectives that can be solved by PEDALS, ranging from mapping the 3D interfaces of volcanoes to understanding rock density in a particular area.

Lava tubes are especially interesting on the moon.

So just how would the system achieve those objectives? PEDALS would land using the time-honored tradition of falling to the  in an airbag. Once there, it will deploy a coilable boom, a concept that has been the focus of several years of NASA research already. In theory, there's no actual constraint to the size of the boom PEDALS deploys, but the volume of the landing airbag and the  the antenna will need to cover will have an impact.

After deployment, PEDALS collects data using its antenna. What that antenna would look like remains a point of study, as the presentation details two potential configurations—a loop antenna or a coupled dipole. Both have advantages and disadvantages, but the JPL team needs to do more research to determine which would be more useful for the lunar use case.

One obvious question is—where could you deploy this thing? Passive viewing of the Apollo missions shows that the moon isn't particularly flat, and massive boulders are randomly strewn. Calculating the large rock sizes (they estimate 50 cm max diameter) and how much room they would need to deploy to a field with many times the area of the deployed antenna as a "free path," according to the JPL report.

That's not necessarily a deal breaker, as there are areas on the moon that meet the criteria—and maybe in a best-case scenario, they could get some help from an autonomous rover to move some of the rocks out of the way. But for now, the idea appears to be on hold, as it is unclear if PEDALS received a Phase II grant after being funded in 2021. However, it's likely that deploying a large-scale  to the  will someday get its day in the sun.

More information: PEDALS: Passively Expanding Dipole Array for Lunar Sounding, hdl.handle.net/2014/55805


Provided by Universe Today 

Stuck antenna freed on Jupiter-bound spacecraft

Survival of this frog in California wildfire scar lends 'some hope' for threatened species

red-legged frog
Credit: Pixabay/CC0 Public Domain

Wildlife biologists reported finding a small population of California red-legged frogs within the burn scars of a Northern California wildfire that torched a large area of the Sierra foothills last year.

The Mosquito Fire scorched 76,778 acres of wildland east of Foresthill, burning through Tahoe and Eldorado National Forests in Placer and El Dorado counties. The devastating fire, which sparked Sept. 6 destroyed 78 structures and displaced over 11,000 residents within the first two weeks.

"The Mosquito Fire went right through one of the most robust populations of the  in the Sierra Nevada. It will take time for this area to recover, but the fact that this frog is still here shows the resiliency of ," said Rick Kuyper, Sacramento Fish and Wildlife Office's Sierra Cascades Division Supervisor in a media post.

Wildlife biologists recently visited the scarred area of land in late July, where they sighted the survival of the native  known as Rana draytonii, taking it as a sign of hope for ecology recovery in the burn areas of California's largest wildfire in 2022.

Signs of hope for wildlife in a burn-scarred land

Before the Mosquito Fire, the Big Gun Conservation Bank in Michigan Bluff "was home to one of the largest populations of red-legged frogs in the Sierra Nevada," according to the U.S. Fish & Wildlife Service.

The , including Tahoe National Forest officials, previously collaborated to conserve the threatened frog species and "expand onto nearby national forest lands." Efforts included the construction of 19 ponds within a mile radius of the conservation bank in 2021 and 2022 to encourage the expansion of the frog species.

The amphibians can grow to as large as 5½ inches in length and are characterized by their red undersides, large forelimbs and skin folds on each side that run from their eyes to hips.

When the Mosquito Fire was extinguished 46 days after its initial spark, however,  and conservationists had to wait several months before they could asses the area.

"When we got out to the ponds on the Tahoe National Forest, we could see that the area burned at a very high intensity. Almost every tree and shrub surrounding the ponds was killed, and most of the downed logs were completely consumed. We also saw that the water in the ponds was very cloudy due to the unstable soils left behind from the fire," said Ian Vogel, senior wildlife biologist with the Service's Sacramento Fish and Wildlife Office.

Several of the 19 ponds constructed in expansion efforts were damaged into "muddy puddles" in the wake of the fire. A Westervelt biologist managed to spot a red-legged frog in one of the intact ponds during the initial assessments.

Threats to the dwindling red-legged frog species

Over time, the remaining constructed ponds in the Tahoe National Forest were seen to be inhabited by the red-legged frog, a sign of the vital impact these ponds have in conservation efforts to preserve this species. The U.S. Fish & Wildlife Service reported that the group of biologists will return to the area in the spring in hopes these same ponds will also become breeding grounds.

Breeding season for this frog species begins in November and continues through April, according to the National Wildlife Federation.

The red-legged frog is described as the largest native  in the western United States and is a rare breed that resides "almost exclusively" in California. This species was first threatened in the 19th and 20th century when they were over-harvested for food.

In the , the current biggest threat to the native frog is the over usage of water resources, which they depend on for habitats and breeding grounds. Expanding farmlands and residential areas also consume valuable wetland habitats.

The National Wildlife Federation has partnered with Save the Frogs, a nonprofit conservation group, to continue to preserve threatened species such as the California red-legged frog.

2023 The Sacramento Bee. Distributed by Tribune Content Agency, LLC.


California commission lists yellow-legged frog as endangered


Risk of cancer death after exposure to low-dose ionizing radiation underestimated, suggests nuclear industry study

nuclear radiation
Credit: CC0 Public Domain

Prolonged exposure to low-dose ionizing radiation is associated with a higher risk of death from cancer than previously thought, suggests research tracking the deaths of workers in the nuclear industry, published in The BMJ.

The findings should inform current rules on workplace protection from , say the researchers.

To date, estimates of the effects of  on the risk of dying from cancer have been based primarily on studies of survivors of atomic bombs dropped on Japan at the end of the Second World War.

These estimates are used to set the level of protection required for workers regularly exposed to much lower doses of radiation in the  and other sectors such as health care.

But the latest data from the International Nuclear Workers Study (INWORKS) suggest that risk estimates, based on the acute exposures among atomic bomb survivors to an extremely high dose of radiation, may underestimate the cancer risks from exposure to much lower doses of ionizing radiation delivered over a prolonged period in the workplace.

The researchers therefore tracked and analyzed deaths among 309,932 workers in the nuclear industry in the UK, France, and the US (INWORKS) for whom individual monitoring data for external exposure to ionizing radiation were available.

During a monitoring period spanning 1944 to 2016, 103,553 workers died: 28,089 of these deaths were due to solid cancers, which include most cancers other than leukemia.

The researchers then used this information to estimate the risk of  from solid cancers based on workers' exposure to radiation 10 years previously.

They estimated that this risk increased by 52% for every unit of radiation (Gray; Gy) workers had absorbed. A dose of one Gray is equivalent to a unit of one Joule of energy deposited in a kilogram of a substance.

But when the analysis was restricted to workers who had been exposed to the lowest cumulative doses of radiation (0-100 mGy), this approximately doubled the risk of death from solid cancers per unit Gy absorbed.

Similarly, restricting the analysis only to workers hired in more recent years when estimates of occupational external penetrating radiation dose were more accurate also increased the risk of death from solid cancer per unit Gy absorbed.

Excluding deaths from cancers of the lung and lung cavity, which might be linked to smoking or  to asbestos, had little effect on the strength of the association.

The researchers acknowledge some limitations to their findings, including that exposures for workers employed in the early years of the nuclear industry may have been poorly estimated, despite their efforts to account for subsequent improvements in dosimeter technology—a device for measuring exposure to radiation.

They also point out that the separate analysis of deaths restricted to workers hired in more recent years found an even higher risk of death from solid cancer per unit Gy absorbed, meaning that the increased risk observed in the full cohort wasn't driven by workers employed in the earliest years of the industry. There were also no individual level data on several potentially influential factors, including smoking.

"People often assume that low dose rate exposures pose less carcinogenic hazard than the high dose rate exposures experienced by the Japanese atomic bomb survivors," write the researchers. "Our study does not find evidence of reduced risk per unit dose for solid  among workers typically exposed to radiation at low dose rates."

They hope that organizations such as the International Commission on Radiological Protection will use their results to inform their assessment of the risks of low dose, and low dose rate, radiation and ultimately in an update of the system of radiological protection.

More information: Cancer mortality after low dose exposure to ionising radiation in workers in France, the United Kingdom, and the United States (INWORKS): cohort study, The BMJ (2023). DOI: 10.1136/bmj-2022-074520

Journal information: British Medical Journal (BMJ)