Wednesday, August 07, 2024

Big Tech's Got a Conflict Minerals Problem

  • Big Tech companies like Amazon, Apple, Google, Meta, and Microsoft are potentially sourcing minerals from conflict-affected regions in Africa.

  • Despite regulations like the Dodd-Frank Act in the US and similar EU legislation, these companies struggle to fully trace the origins of the minerals used in their products.

  • Companies often cite the potential economic harm to local communities as a reason for continuing operations in conflict-affected and high-risk areas.


According to its conflict minerals report (CMR) for 2023Amazon cannot rule out having sourced minerals from nine of ten African countries where human rights-violating militias finance themselves through mining.

These countries are the Democratic Republic of the Congo, the Republic of the Congo, the Central African Republic, South Sudan, Uganda, Rwanda, Burundi, Tanzania, Zambia and Angola.

But, as Statista's Florian Zandt shows in the chart below, the other four members of GAMAM, a group synonymous with the moniker Big Tech, also potentially source some of the raw materials processed in contracted smelters from these regions.


You will find more infographics at Statista

Both Apple and Google’s parent company Alphabet reported that smelters integrated into their supply chains potentially processed minerals from six of the ten countries on the African continent mentioned above. Meta lists five of these countries in its report, while Microsoft claims to have reason to believe that minerals from two of the ten countries listed might end up in their products. However, the country list provided by Alphabet was last updated in 2021 and has been absent from their annual CMR since 2022. Additionally, Microsoft doesn't clarify if the countries listed in its report are merely those where smelters are located or if they are the source countries for potential conflict materials.

Contractors working for GAMAM companies are also active in extracting and processing raw materials in countries defined as CAHRAs, short for Conflict-Affected and High-Risk Areas. The extended CAHRA definition, which includes the extraction of minerals as well as other conflict resources, encompasses specific regions in Afghanistan, Mexico, Myanmar, and Yemen, among others.

According to Microsoft’s conflict minerals report, the company relies on "responsible sourcing" rather than restricting or avoiding the usage of the conflict minerals tantalum, tin, tungsten, and gold, known as 3TG, from these regions. Stopping operations in Covered Countries and CAHRAs would allegedly cause significant economic harm to the affected countries.

U.S. importers of raw materials have been required to disclose their sources for potential conflict minerals under the Dodd-Frank Act since 2010. A similar regulation has been in effect in the European Union since January 1, 2021, aimed at curbing the financing of violent militias, particularly in the Democratic Republic of Congo and surrounding countries, where said groups control the mining of tin and coltan. In the 1990s, the term "blood diamonds" gained significant attention in this context, referring to gemstones mined in Sierra Leone and Angola and sold by rebel groups to finance their operations.

By Zerohedge.com 


Is China’s Dominance in Critical Minerals Production Fading?

  • China currently accounts for two-thirds of the world's critical minerals processing capacity, but its dominance is waning.
  • The demand for critical minerals like cobalt, graphite, and lithium is expected to increase six-fold by 2050 due to the adoption of green technologies.
  • Countries like the United States, Australia, Myanmar, and Thailand are emerging as significant players in critical minerals production, challenging China's monopoly.

Demand for critical minerals such as copper, cobalt, lithium and nickel is soaring. These raw materials are used in a range of new technologies, from electric cars to wind turbines, which are becoming ever more important as the world moves towards a green transition. Experts forecast that this trend is set to accelerate, with global production of cobalt, graphite, and lithium set to increase nearly six-fold between now and 2050 (World Bank).

As Statista's Anna Fleck shows in the chart below, data recently published by the United Nations Conference on Trade and Development (UNCTAD) shows that China accounts for around two-thirds of the world's processing/refining capacity for critical minerals.

Minerals
You will find more infographics at Statista

While the extraction of these materials takes place all around the globe, China currently accounts for more than half of the world's refining of aluminum, lithium and cobalt, around 90 percent of that of rare earth metals and manganese and 100 percent of that of natural graphite. In addition, more than a third of the world's copper and nickel processing is carried out in China.

While China is in the lead for critical minerals production, the nation is losing its dominance. For example, the United States and Australia have increased their production of rare earths from 2010 onwards and most recently, Myanmar and Thailand have started to mine far more than before.

By Zerohedge.com

Global Coal Production Hits Record Highs

  • Coal consumption also hit a new high, with China remaining the largest consumer, responsible for over half of the world's coal use.

  • Coal consumption continues to decline in Western countries, reflecting ongoing transitions to cleaner energy sources.

In June, the Energy Institute released the 2024 Statistical Review of World Energy. The Review provides a comprehensive picture of supply and demand for major energy sources on a country-level basis. Each year, I do a series of articles covering the Review’s findings.

In three previous articles, I discussed:

Today I will discuss trends in coal production and consumption.

Overview

In 2023, global coal production reached a record high of 179 exajoules (EJ), surpassing the previous year’s peak. The Asia Pacific region contributed nearly 80% of the global output, primarily driven by Australia, China, India, and Indonesia, which together accounted for 97% of the region’s production.

Notably, China alone produced just over half of the world’s total coal. In contrast, coal production in North America, Southern & Central America, Europe, and the Commonwealth of Independent States declined compared to 2022.

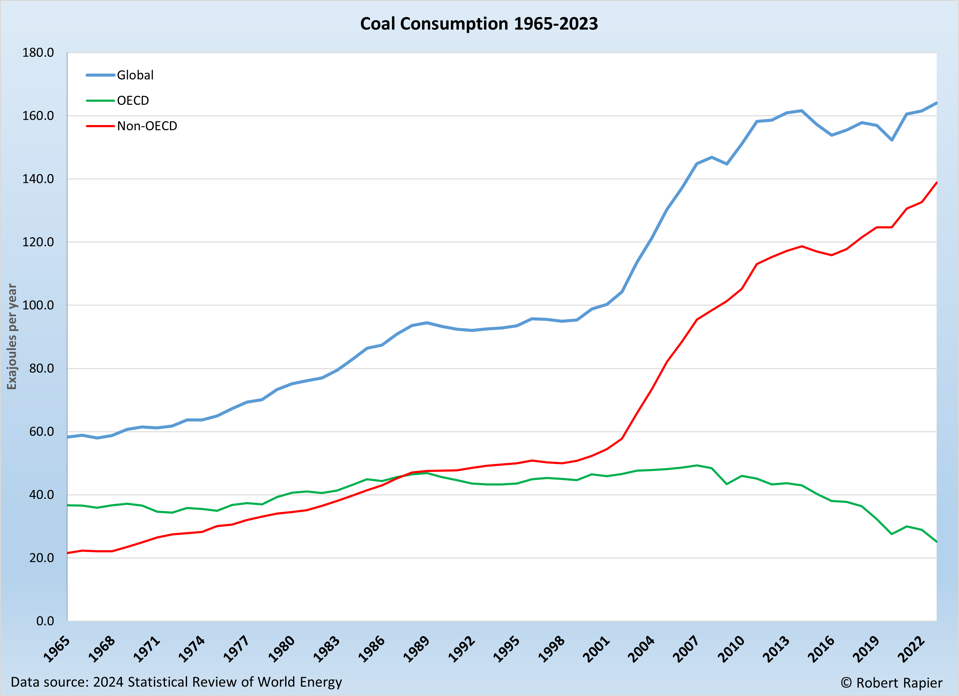
Global coal consumption also hit a new high, exceeding 164 EJ for the first time. This represented a 1.6% increase from 2022, a growth rate seven times higher than the average over the previous decade. China remained the largest consumer, responsible for 56% of global coal use. China’s coal consumption increased by 4.7% in 2023, more than four times the country’s 1.1% average coal consumption growth rate of the past decade.

For the first time, India’s coal consumption in 2023 surpassed the combined consumption of Europe and North America. Meanwhile, coal consumption in both Europe and North America dropped below 10 EJ each, marking their lowest levels since 1965.

Coal Consumption

Coal Consumption 1965-2023. ROBERT RAPIER

Additionally, coal prices fell significantly from the record highs of 2022, with an average decrease of 46%. European delivered prices settled around $130 per metric ton, while prices in Asia averaged about $125 per metric ton.

The Top Producers

China dominates the world’s coal production, and Asia Pacific countries are well-represented in the Top 10.

Top 10 Coal Producers

Top 10 Coal Producers in 2023. ROBERT RAPIER

“Change” reflects the percentage change from 2023.

The Top 10 coal producers in 2023 were the same as a year before, except Mongolia replaced Poland on the list.

The Top Consumers

The Top 10 consumers are the same names as a year ago, with some movement in the rankings of the bottom half of the list.

Top 10 Coal Consumers

Top 10 Coal Consumers in 2023. ROBERT RAPIER

Notably, the only countries in the Top 10 that increased coal consumption in 2023 were in the Asia Pacific region. Coal consumption continues to decline in western countries.

Conclusions

In conclusion, the 2024 Statistical Review of World Energy highlights the major trends and shifts in global coal production and consumption. With Asia Pacific dominating coal production, led by China, India, Australia, and Indonesia, the region remains a central player in the global coal industry.

Notably, China’s production and consumption have reached unprecedented levels, further solidifying its role as the world’s largest coal producer and consumer. India’s rising consumption, surpassing the combined totals of Europe and North America, underscores the shifting dynamics in global energy use. Meanwhile, coal consumption continues to decline in Western countries, reflecting ongoing transitions to cleaner energy sources.

These trends underscore the evolving landscape of global energy markets and have major implications on the ability of the world to control carbon emissions. Because coal is the most carbon-intensive of the fossil fuels, it is imperative to tackle rising coal consumption in order to stem the ongoing rise in carbon emissions.

By Robert Rapier

How Investors Are Capitalizing on AI’s Insatiable Appetite for Energy

  • AI data centers' rising electricity demand prompts investors to buy power utility stocks, anticipating generational demand growth.

  • Power utilities stand to benefit from the AI boom as they secure reliable electricity for consumers amid increasing demand.

  • Utility stocks offer relatively cheap exposure to the AI revolution, making them attractive to investors seeking diversification.


About a month ago, Google admitted in its annual sustainability report that its emissions had climbed by nearly 50% over the five years since 2019. The reason: data centers and artificial intelligence.

Microsoft has also seen a massive increase in its electricity consumption—it has doubled since 2020, driven by Big Tech’s AI race. Its emissions, like Google’s, also rose substantially, by 42%. But investors are watching the consumption trend and buying power utility stock. Those may be the next market darlings.

Inflows into utility funds in the United States are on the rise, adding $1.7 billion over just the two months of May and June this year, the Financial Times reported this month, citing Morningstar data. This was the highest amount of new inflows into utility funds in almost two years, the report noted. July could see fresh additions of $1.1 billion into the segment, the FT cited State Street as predicting. Utilities are hot.

Per Morningstar data again, many utility funds return double digits over a year, ranging from around 10% to over 20% for a few particularly strong performers. For context, ESG funds, for instance, are almost all the single-digit return territory, with one recently even slipping into a loss. Top Big Tech funds, on the other hand, are returning around 20% and more. Electricity is hot.

It’s also about to get hotter because no Big Tech major has signaled intentions to change their plans for artificial intelligence, which essentially comes down to a single word: growth at all costs, emissions and all. And this means that the predictions about electricity demand surging are most likely going to come true.

Back in May, Goldman Sachs forecasted that AI would drive a 160% increase in electricity demand from data centers. “At present, data centers worldwide consume 1-2% of overall power, but this percentage will likely rise to 3-4% by the end of the decade,” the bank’s analysts said. “In the US and Europe, this increased demand will help drive the kind of electricity growth that hasn’t been seen in a generation.”

No wonder investors are flocking to power utilities since those would be at the forefront of that generational demand surge. Google and Microsoft alone are already consuming more electricity than 100 countries, and not all small ones, at that. Their combined total was 48 TWh, or 24 TWh each. Both are promising to source more of those terawatt-hours from wind and solar sources, but both are failing because of the nature of wind and solar. However, utilities, whose job is to secure reliable electricity to consumers large and small, regardless of source, are thriving on the stock market.

Buying utility stocks is also a way to gain relatively cheap exposure to the whole artificial intelligence boom, according to the FT report. “Investors are looking past the Mag 7 names and waiting for the next shoe to drop,” BlackRock’s head of thematic and active ETFs, Jay Jacobs, told the publication. Indeed, Magnificent 7 stocks are expensive because the whole AI hype is already built into them, while power utilities, which are the one factor that is turning the hype into an actual revolution, are still cheap.

The change that is beginning to take shape in the electricity sector is indeed significant. As Goldman Sachs pointed out in its May report on AI and power demand, this demand in the United States has been flat for years. That’s despite a growing population and growing consumption of electricity. The reason for the flat growth: efficiencies.

These efficiencies, however, have limits, and with AI, they seem to have reached these limits, at least for the time being. AI computing simply needs a lot more energy than plain computing, plain and simple. This power has to come from somewhere and the companies that take care of that are the power utilities. It is the simplest equation for investors.

There are drawbacks, of course, and the biggest is that utilities would need to pour significant sums of money into grid upgrades to ensure supply meets demand. Total investments could come in at $50 billion as estimated by Goldman Sachs. The Biden admin has allocated $65 billion for grid upgrades and expansion, but these have yet to start pouring into grid operators’ bank accounts—and the upgrades and expansion will take time, a lot of time.

The way things stand, the balance between demand for electricity, driven higher by AI data centers, and supply, getting increasingly unreliable as more wind and solar join the grid, is going to be precarious for the observable future. Electricity is going to get more expensive, as already suggested by PJM’s latest power auction, which saw prices 800% higher than last year’s edition. The company’s CEO noted that this confirmed a tightening supply/demand balance. But what it also confirmed is that the rush into power utility stocks may be just beginning.

By Irina Slav for Oilprice.com


Startup brings fresh approach to US nuclear deployment


02 August 2024


The Nuclear Company aims to redefine how large-scale nuclear infrastructure projects are delivered in the USA using proven, licensed technology in a fleet-scale model - and is taking to the road in a campaign bus to build support for its vision.

The Nuclear Frontier bus arrived in Knoxville, Tennessee on 30 July (Image: The Nuclear Company/X)
The company, which emerged from "stealth mode" in July, says its mission is "to address surging energy demand driven by AI (artificial intelligence) data computing, onshoring manufacturing, and the electrification of everything." Global electricity demand is projected to increase nearly 30% by 2030, and nuclear can provide the reliable, around-the-clock, zero-carbon power required to meet it. But the biggest challenge facing the industry is that one-off nuclear projects almost always are over budget and behind schedule, the company said.

The Nuclear Company's fleet-scale model combines using proven, licensed technology and a design-once, build-many approach, developing coalitions across communities, regulators and financial stakeholders to catalyse rapid development. It will do this by developing standardised processes and scheduling in order to sequence work and minimise delays, including moving construction expertise from one site to the next immediately to improve efficiency.

"The Nuclear Company is working towards solving America's surging energy demand by redefining how large-scale, nuclear infrastructure projects are delivered," said Chief Development Officer Juliann Edwards. "We recognise the challenges facing our industry, where one-off nuclear projects historically go over budget and run behind schedule. Our unique approach integrates proven technology with unparalleled collaboration among diverse organisations, ensuring that fleet-scale projects are executed on-time and on-budget. The time is now given a sea change in public opinion that’s overwhelmingly supportive of nuclear power, recent bipartisan legislative action, and our business model that drives down upfront costs."

Early investors in the company include investment firm CIV, True Ventures, Wonder Ventures, Goldcrest Capital, and MCJ Collective.

Nulcear Frontier


The Nuclear Frontier bus tour began on 23 July in Pittsburgh at the annual conference held by US Women in Nuclear - Edwards is chair of the organisation. With stops in six states and Washington DC, the tour aims to engage with government and industry leaders, as well as skilled tradespeople who will rebuild America’s nuclear leadership. "The Nuclear Company’s consortium of utilities and independent power producers, hyperscalers, nuclear technology suppliers, and private equity help mitigate risk and make nuclear power an attractive investment," the company said.

Joe Klecha has recently been announced as the company's chief nuclear officer.

Researched and written by World Nuclear News

The Start of De-Dollarization: China’s Move Away From the USD

By Michael Kern - Aug 06, 2024


  • The Chinese renminbi (RMB) is growing in popularity in payments both domestically and globally. 

  • In 2023 the Renmibi overtook the US Dollar in China's cross-border payments and receipts.

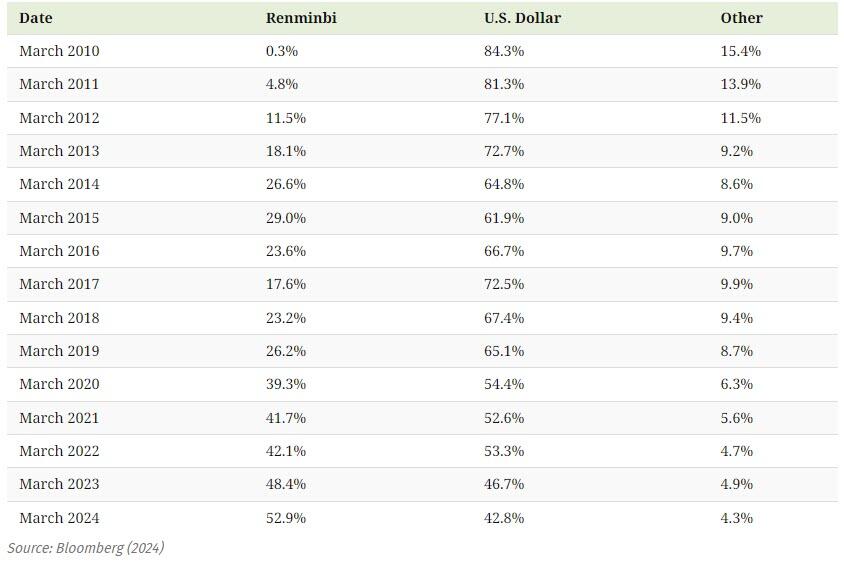
  • As of March 2024, over half (52.9%) of Chinese payments were settled in RMB while 42.8% were settled in USD.

The global financial landscape is undergoing a subtle yet significant transformation. At the heart of this change is the concept of "de-dollarization" – the gradual reduction of the US dollar's dominance in international trade and finance. While this process has been simmering for years, it has gained momentum recently, fueled by China's increasing use of its own currency, the yuan (or renminbi), for cross-border transactions.

This shift away from the dollar, while gradual, has the potential to reshape the global economic order. A less dollar-centric world could mean a redistribution of power, influence, and economic leverage. It could also lead to increased volatility and uncertainty in financial markets. As China continues to assert its economic might, the rise of the yuan represents a significant challenge to the established order.

In this article, we will delve into the factors driving China's de-dollarization efforts, the impact on the global currency landscape, and the potential implications for the future of international trade and finance. We will explore the rise of the yuan, the strategic considerations behind China's actions, and the challenges and opportunities that lie ahead.

The De-Dollarization of China’s Cross-Border Transactions

Historically, China, like many other nations, has relied heavily on the US dollar for its international trade and financial transactions. However, this dependence has been waning in recent years as China actively promotes the use of its own currency.

In 2010, less than 1% of China's cross-border payments were settled in yuan, compared to a staggering 83% in US dollars. Fast forward to March 2023, and a pivotal moment occurred: the yuan overtook the dollar for the first time. By March 2024, over half (52.9%) of Chinese payments were settled in yuan, marking a remarkable doubling of its share in just five years.

This dramatic shift can be attributed to several factors. Firstly, there is a growing willingness among foreign businesses to trade in yuan, as they seek to diversify their currency holdings and reduce their exposure to the dollar. Secondly, several countries, including Brazil and Argentina, have begun to accept yuan settlements for trade, further bolstering its international use.

The Chinese government and its central bank, the People's Bank of China (PBOC), have played a crucial role in driving this trend. They have implemented policies to facilitate the use of the yuan in cross-border trade and investment, including establishing offshore yuan clearing centers and expanding the network of bilateral currency swap agreements.

The Rise and Retreat of the Yuan

The rise of the yuan in international trade has been marked by several significant milestones. In 2016, the yuan was included in the International Monetary Fund's (IMF) Special Drawing Rights (SDR) basket, a reserve asset used by member countries. This move recognized the yuan's growing importance in the global economy and paved the way for its wider adoption.

However, the path toward a globalized yuan has not been without setbacks. In 2015-2016, China faced a speculative attack on its currency, triggered by concerns about the country's economic slowdown and capital outflows. This forced the PBOC to intervene to stabilize the yuan, highlighting the challenges of managing a currency with increasing global exposure.

Shifting Priorities and Capital Controls

The 2016 crisis prompted a reassessment of China's de-dollarization strategy. While the initial ambition was to achieve full-scale de-dollarization and expand the Belt and Road Initiative (BRI), a massive infrastructure investment project, the focus shifted towards a more cautious approach.

China began prioritizing the development of yuan-denominated trade settlement systems, allowing businesses to bypass the dollar in their transactions. The government also tightened capital controls to prevent excessive outflows and maintain financial stability. These measures, while effective in protecting the economy, also limited the yuan's global reach.

The Weaponization of the U.S. Dollar

The US dollar's dominance in international trade has long been a source of both power and vulnerability for the United States. It has allowed the US to impose economic sanctions on other countries by restricting their access to the global dollar-based financial system.

This "weaponization" of the dollar has raised concerns among many countries, particularly those that are at odds with US foreign policy. As a result, there has been a growing interest in finding alternatives to the dollar, with China's yuan emerging as a potential contender.

Most Popular Currencies in Foreign Exchange (FX) Transactions

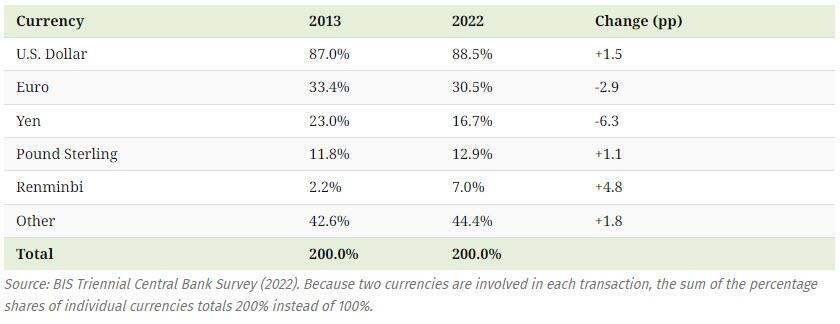
Despite the yuan's rise, the US dollar remains the undisputed king of the foreign exchange market. According to the Bank for International Settlements, in 2022, it accounted for 88.5% of all FX transactions, followed by the euro (30.5%) and the Japanese yen (16.7%). Interestingly, the dollar's share has actually grown by 1.5% since 2010, while the euro and yen have seen their shares decline.

The renminbi, while still a relatively small player with a 7% share, has been the fastest-growing currency in the FX market over the past decade. This suggests that it is gradually gaining acceptance as a viable alternative to the dollar, especially in trade with China and its partners.

De-Dollarization or Yuanization? The Future of Global Trade

While the complete de-dollarization of the global economy seems unlikely in the near future, the rise of the yuan is undeniably a significant trend. As China continues to expand its economic influence, the yuan is likely to play an increasingly important role in international trade and finance.

The Chinese government is actively promoting the use of the yuan in cross-border transactions, and it is steadily building the infrastructure needed to support this goal. This includes establishing yuan clearing banks in major financial centers, expanding the network of currency swap agreements, and developing new financial products denominated in yuan.

However, the path to yuanization is not without challenges. China's strict capital controls, while necessary for maintaining financial stability, also limit the yuan's international appeal. Additionally, the yuan's value is still tightly managed by the PBOC, which raises concerns about its long-term stability and predictability.

Despite these challenges, the yuan's rise is a trend that cannot be ignored. It represents a fundamental shift in the global financial landscape, one that could have far-reaching implications for the future of trade, investment, and geopolitical power.

By Michael Kern for Oilprice.com

How Venezuela's Election Unrest Will Impact Global Oil Markets

  • Venezuelan President Nicolás Maduro has been declared the winner of a controversial presidential election, sparking widespread protests and international condemnation.

  • Despite the re-election of Maduro, the United States has maintained sanctions on Venezuela's state-owned oil company, PDVSA, with limited exceptions for certain transactions.

  • Venezuela's oil industry continues to face significant challenges, including underinvestment, mismanagement, and a lack of skilled workers, hindering the country's economic recovery.


Last week, Venezuela’s sitting President Nicolás Maduro was declared the winner of the country’s presidential vote, plunging the country into widespread protests amid glaring election irregularities. The 61-year-old Maduro beat the elderly opposition candidate, 74-year-old Mr González Urrutia, despite exit polls showing the latter garnering 65% of the vote. The relatively unknown González was selected as a last-minute stand-in for opposition powerhouse Maria Corina Machado, who was blocked by the Maduro-controlled Supreme Tribunal of Justice from running for any office for 15 years. The charismatic 56-year-old former lawmaker swept the opposition’s October primary with more than 90% of the Unitary Platform, a coalition of Venezuela’s main opposition parties. Machado initially picked a college professor as her substitute on the ballot, but her choice was rejected after the ruling party-loyal National Electoral Council also barred her from registering.

Not surprisingly, the opposition has claimed fraud, with the U.S. and EU foreign policy chiefs and various regional neighbors expressing disapproval. As you might expect, Mr Maduro’s authoritarian allies in Russia, China, Iran, and Cuba have wasted no time congratulating him.

That said, Maduro’s latest power grab is unlikely to affect global Oil & Gas markets in any material way. Last month, The United States Office of Foreign Assets Control (OFAC) eased some sanctions on Venezuela but retained sanctions on Venezuela’s state-owned oil company, PDVSA. OFAC issued a new license allowing certain transactions related to the export or re-export of liquefied petroleum gas (LPG) to Venezuela until July 8, 2025.  However, transactions with Petróleos de Venezuela, S.A., the Venezuelan state-owned oil and natural gas company in which PdVSA has a 50 percent or greater interest, remain prohibited under the sanctions imposed by various executive orders. The previous general license permitted transactions related to oil or gas sector operations in Venezuela but expired on April 18. The United States holds that Venezuela President Nicolas Maduro and his representatives have failed to fully meet the obligations outlined in the electoral roadmap signed with the opposition in Barbados in October 2023.

The United States is now considering fresh sanctions on Venezuela following Sunday's disputed presidential election. However, U.S. officials are not currently considering any changes to Chevron Corp.’s (NYSE:CVX) license or to other individual authorizations. Chevron's license has become a flagship mechanism to recover debt by exporting Venezuelan crude, a model that is copied by other companies with operations in the country. Chevron has ramped up deliveries of Venezuelan crude to the United States since early 2023; however, its ~200,000 bpd of heavy crude arriving into the U.S. represents less than 1% of the more than 20 million barrels of crude processed by U.S. refineries every day. According to Reuters, widespread post-election protests have so far not affected Venezuela’s oil flows. Previously, PdVSA instructed joint ventures and its own operational areas to work with reduced staff and an increased level of security due to the electoral process, which typically requires the mobilization of the military. However, the company has relaxed the order in recent days, with most  PdVSA executives and staff working normal shifts. According to Reuters, Venezuela’s crude production averaged 922,000 barrels per day in June.

Venezuela's crude oil production averaged 884,000 barrels per day (bpd) in the current year, good for a 15%Y/Y increase above the same period of 2023. However, current production remains well below the 3.2 million bpd peak in 1997 before late President Hugo Chavez took office. Venezuela has lost about two-thirds of its crude production capacity over the past decade thanks to a lack of investment, exodus of skilled workers, mismanagement and corruption at PdVSA. The same problems have plagued the country's gas industry, which remains severely underdeveloped. After peaking at 1.12 trillion cubic feet (Tcf) in 2001, Venezuela's natural gas production halved to 563 billion cubic feet (Bcf). The country's gas output - which is now half of what it was in 2016 - is not enough to meet domestic demand despite Venezuela having the largest reserves in Latin America. Venezuela’s gas producers have now restored to flaring, or burning off, a large portion of production. Venezuela has 196 trillion cubic feet in proved reserves compared to 432 trillion cubic feet by the United States, despite the Latin American country having less than a tenth of the population of its much larger counterpart.

V
The National News

It’s hard to see a meaningful revival of Venezuela’s energy industry under another Maduro government. Falling oil production has had a severely adverse effect on the economy with GDP currently a third of what it was a decade ago. As Robin M Mills, chief executive of Qamar Energy, and author of The Myth of the Oil Crisis, has observed, we are more likely to see ‘‘…the combination of repression, continuing backing from the military and remaining loyal “Chavistas”, some Russian assistance, a tepid response from leftist Latin American democracies, and distribution of dwindling petrodollars, keeps Mr Maduro in power. Blaming sanctions and Washington’s meddling provides easy excuses for the country’s dysfunction.’’

By Alex Kimani for Oilprice.com