Wednesday, March 30, 2022

How the MIT Mini Cheetah Robot Learns To Run Entirely by Trial and Error
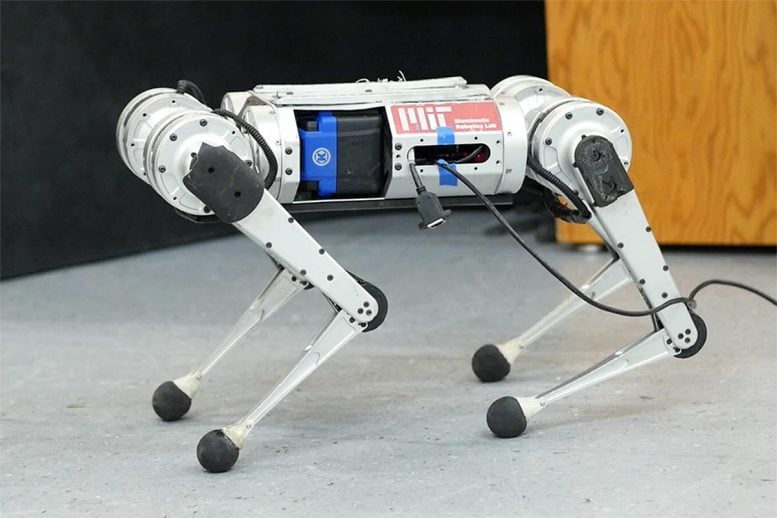
MIT Mini Cheetah

MIT’s mini cheetah, using a model-free reinforcement learning system, broke the record for the fastest run recorded. Credit: Photo courtesy of MIT CSAIL.

CSAIL scientists came up with a learning pipeline for the four-legged robot that learns to run entirely by trial and error in simulation.

It’s been roughly 23 years since one of the first robotic animals trotted on the scene, defying classical notions of our cuddly four-legged friends. Since then, a barrage of the walking, dancing, and door-opening machines have commanded their presence, a sleek mixture of batteries, sensors, metal, and motors. Missing from the list of cardio activities was one both loved and loathed by humans (depending on whom you ask), and which proved slightly trickier for the bots: learning to run.

Researchers from MIT’s Improbable AI Lab, part of the Computer Science and Artificial Intelligence Laboratory (CSAIL) and directed by MIT Assistant Professor Pulkit Agrawal, as well as the Institute of AI and Fundamental Interactions (IAIFI) have been working on fast-paced strides for a robotic mini cheetah — and their model-free reinforcement learning system broke the record for the fastest run recorded. Here, MIT PhD student Gabriel Margolis and IAIFI postdoc Ge Yang discuss just how fast the cheetah can run.

Q: We’ve seen videos of robots running before. Why is running harder than walking?

A: Achieving fast running requires pushing the hardware to its limits, for example by operating near the maximum torque output of motors. In such conditions, the robot dynamics are hard to analytically model. The robot needs to respond quickly to changes in the environment, such as the moment it encounters ice while running on grass. If the robot is walking, it is moving slowly and the presence of snow is not typically an issue. Imagine if you were walking slowly, but carefully: you can traverse almost any terrain. Today’s robots face an analogous problem. The problem is that moving on all terrains as if you were walking on ice is very inefficient, but is common among today’s robots. Humans run fast on grass and slow down on ice — we adapt. Giving robots a similar capability to adapt requires quick identification of terrain changes and quickly adapting to prevent the robot from falling over. In summary, because it’s impractical to build analytical (human-designed) models of all possible terrains in advance, and the robot’s dynamics become more complex at high-velocities, high-speed running is more challenging than walking.


The MIT mini cheetah learns to run faster than ever, using a learning pipeline that’s entirely trial and error in simulation.

Q: Previous agile running controllers for the MIT Cheetah 3 and mini cheetah, as well as for Boston Dynamics’ robots, are “analytically designed,” relying on human engineers to analyze the physics of locomotion, formulate efficient abstractions, and implement a specialized hierarchy of controllers to make the robot balance and run. You use a “learn-by-experience model” for running instead of programming it. Why?

A: Programming how a robot should act in every possible situation is simply very hard. The process is tedious, because if a robot were to fail on a particular terrain, a human engineer would need to identify the cause of failure and manually adapt the robot controller, and this process can require substantial human time. Learning by trial and error removes the need for a human to specify precisely how the robot should behave in every situation. This would work if: (1) the robot can experience an extremely wide range of terrains; and (2) the robot can automatically improve its behavior with experience.

Thanks to modern simulation tools, our robot can accumulate 100 days’ worth of experience on diverse terrains in just three hours of actual time. We developed an approach by which the robot’s behavior improves from simulated experience, and our approach critically also enables successful deployment of those learned behaviors in the real world. The intuition behind why the robot’s running skills work well in the real world is: Of all the environments it sees in this simulator, some will teach the robot skills that are useful in the real world. When operating in the real world, our controller identifies and executes the relevant skills in real-time.

Q: Can this approach be scaled beyond the mini cheetah? What excites you about its future applications?

A: At the heart of artificial intelligence research is the trade-off between what the human needs to build in (nature) and what the machine can learn on its own (nurture). The traditional paradigm in robotics is that humans tell the robot both what task to do and how to do it. The problem is that such a framework is not scalable, because it would take immense human engineering effort to manually program a robot with the skills to operate in many diverse environments. A more practical way to build a robot with many diverse skills is to tell the robot what to do and let it figure out the how. Our system is an example of this. In our lab, we’ve begun to apply this paradigm to other robotic systems, including hands that can pick up and manipulate many different objects.

This work was supported by the DARPA Machine Common Sense Program, the MIT Biomimetic Robotics Lab, NAVER LABS, and in part by the National Science Foundation AI Institute for Artificial Intelligence Fundamental Interactions, United States Air Force-MIT AI Accelerator, and MIT-IBM Watson AI Lab. The research was conducted by the Improbable AI Lab.
Hundreds of “Hidden” New Mammal Species Waiting To Be Found

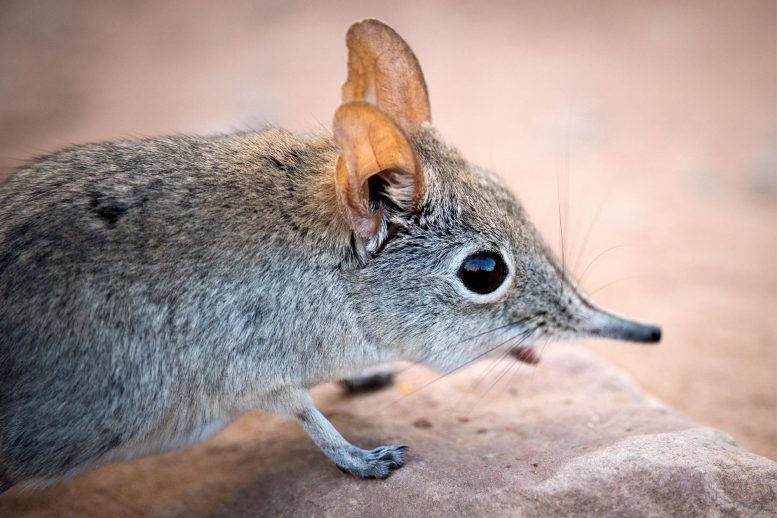
Elephant Shrew

Elephant shew.

Research suggests where these species may be “hidden.”

At least hundreds of so-far unidentified species of mammals are hiding in plain sight around the world, a new study suggests.

Researchers found that most of these hidden mammals are small bodied, many of them bats, rodents, shrews, and moles.

These unknown mammals are hidden in plain sight partly because most are small and look so much like known animals that biologists have not been able to recognize they are actually a different species, said study co-author Bryan Carstens, a professor of evolution, ecology and organismal biology at The Ohio State University.

“Small, subtle differences in appearance are harder to notice when you’re looking at a tiny animal that weighs 10 grams than when you’re looking at something that is human-sized,” Carstens said.

“You can’t tell they are different species unless you do a genetic analysis.”

The study was published on March 28, 2022, in the journal Proceedings of the National Academy of Sciences.

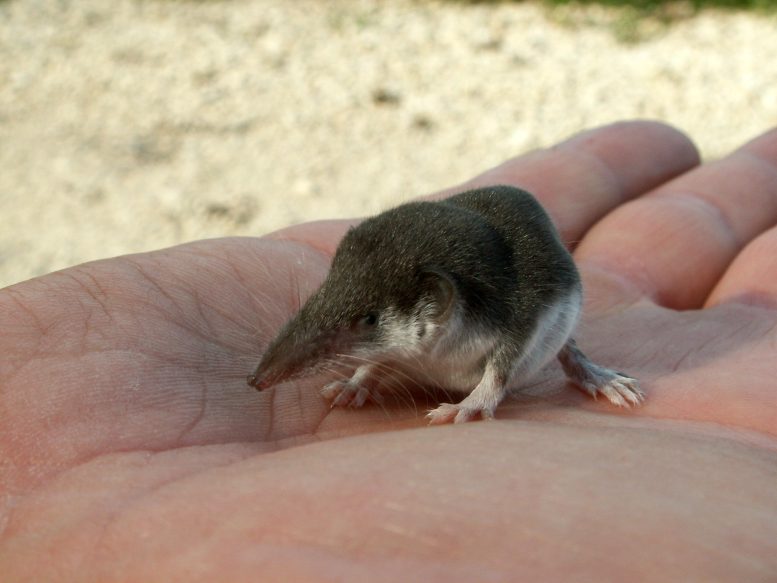
Bicolored Shrew

Small mammals, like this bicolored shrew, are more likely than larger animals to be ‘hiding’ new species. Credit: Werner Korschinsky, via Wikimedia Commons

The team, led by Ohio State graduate student Danielle Parsons, used a supercomputer and machine-learning techniques to analyze millions of publicly available gene sequences from 4,310 mammal species, as well as data on where the animals live, their environment, life history, and other relevant information.

This allowed them to build a predictive model to identify the taxa of mammals that are likely to contain hidden species.

“Based on our analysis, a conservative estimate would be that there are hundreds of species of mammals worldwide that have yet to be identified,” Carstens said.

That finding, in itself, would not be surprising to biologists, he said. Only an estimated 1 to 10% of Earth’s species have been formally described by researchers.

“What we did that was new was predict where these new species are most likely to be found,” Carstens said.

Results showed unidentified species are most likely to be found in the families of small-bodied animals, such as bats and rodents.

The researchers’ model also predicted hidden species would most likely be found in species that have wider geographic ranges with higher variability in temperature and precipitation.

Many of the hidden species are also likely to occur in tropical rain forests, which is not surprising because that’s where most mammal species occur.

But many unidentified species are also likely living here in the United States, Carstens said. His lab has identified some of them. For example, in 2018, Carstens and his then-graduate student Ariadna Morales published a paper showing that the little brown bat, found in much of North America, is actually five different species.

That study also showed a key reason why it is important to identify new species. One of the newly delimited bats had a very narrow range where it lived, just around the Great Basin in Nevada – making its protection especially critical.

“That knowledge is important to people who are doing conservation work. We can’t protect a species if we don’t know that it exists. As soon as we name something as a species, that matters in a lot of legal and other ways,” Carstens said.

Based on the results of this study, Carstens estimates that somewhere near 80% of mammal species worldwide have been identified.

“The shocking thing is that mammals are very well described compared to beetles or ants or other types of animals,” he said.

“We know a lot more about mammals than many other animals because they tend to be larger and are more closely related to humans, which makes them more interesting to us.”

Reference: “Analysis of biodiversity data suggests that mammal species are hidden in predictable places” by Danielle J. Parsons, Tara A. Pelletier, Jamin G. Wieringa, Drew J. Duckett and Bryan C. Carstens, 28 March 2022, Proceedings of the National Academy of Sciences.
DOI: 10.1073/pnas.2103400119

The study was supported by the National Science Foundation and the Ohio Supercomputer Center.

Other co-authors were Tara Pelletier, assistant professor of biology at Radford University; and Jamin Wieringa and Drew Duckett, graduate students at Ohio State.

CRISPR CRITTER

Here CRISPR Kitty? Progress in Developing a Hypoallergenic Cat

Cute Kitten

Researchers at InBio (formerly Indoor Biotechnologies), a biotech company in Virginia, report progress en route to developing a hypoallergenic cat – or at least treating patients with allergies to the domestic cat – in a new article published online in The CRISPR Journal.

The CRISPR Journal

Journal dedicated to outstanding research and commentary on all aspects of CRISPR and gene editing research. Credit: Mary Ann Publications, Inc., publishers

About 15 percent of the population suffer allergies to domestic cats, which researchers have previously shown is largely attributable to what the Atlantic called “a pernicious little protein” — an allergen called Fel d 1 that is shed by all cats. In the new study, Nicole Brackett and colleagues at InBio performed a bioinformatics analysis of the Fel d 1 gene from 50 domestic cats to pinpoint conserved coding regions suitable for CRISPR editing. Further comparisons to genes in eight exotic felid species revealed a high degree of variation, suggesting that Fel d 1 is nonessential for cats. The researchers used CRISPR-Cas9 to disrupt Fel d 1 with high efficiency.

“Our data indicate that Fel d 1 is both a rational and viable candidate for gene deletion, which may profoundly benefit cat allergy sufferers by removing the major allergen at the source,” the authors write. The study paves the way for further experiments exploring the use of CRISPR as a potential genetic therapy to muzzle the release of cat allergens.

Reference: 28 March 2022, The CRISPR Journal.

Sentinel-6: International Sea Level Satellite Takes Over

Sentinel-6 Michael Freilich Satellite Radar Pulse

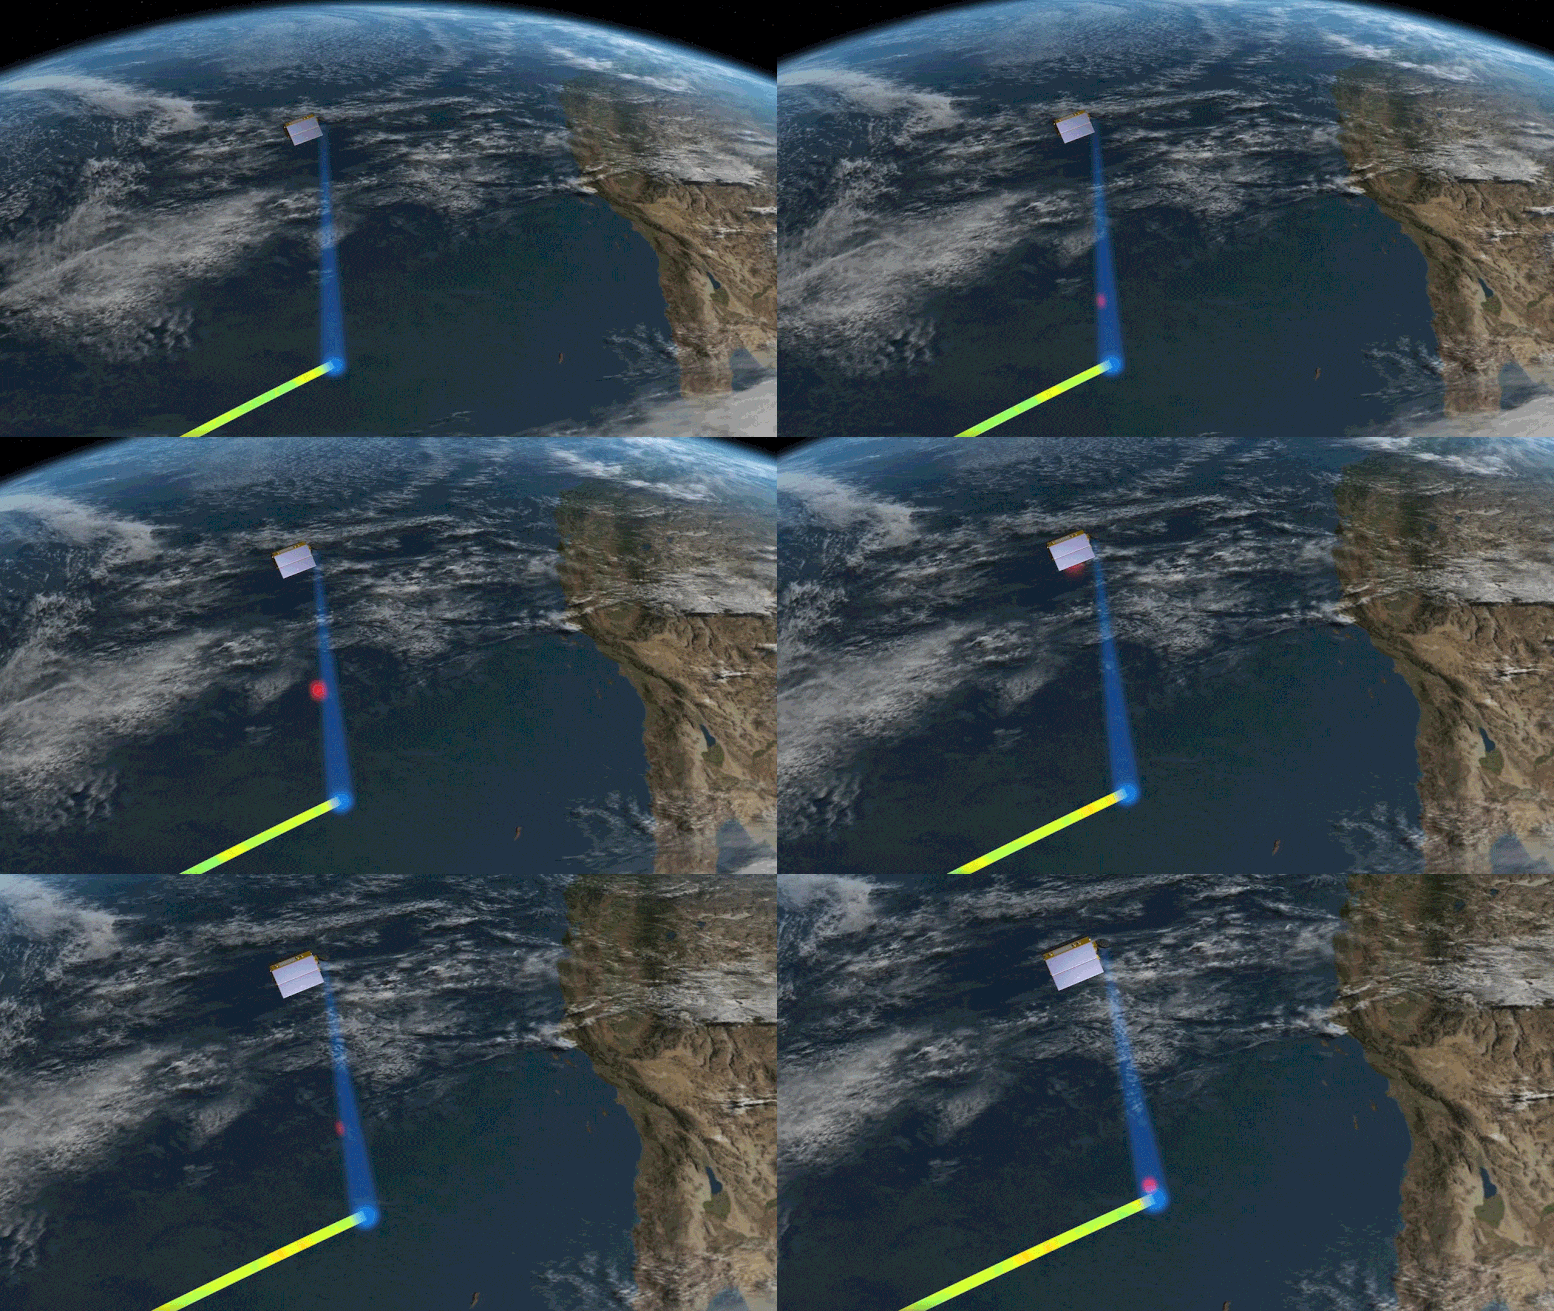
This animation shows the radar pulse from the Sentinel-6 Michael Freilich satellite’s altimeter bouncing off the sea surface in order to measure the height of the ocean. Credit: NASA/JPL-Caltech

Sentinel-6 Michael Freilich, the newest addition to a long line of ocean-monitoring satellites, becomes the reference satellite for sea level measurements.

On March 22, the newest U.S.-European sea level satellite, named Sentinel-6 Michael Freilich, became the official reference satellite for global sea level measurements. This means that sea surface height data collected by other satellites will be compared to the information produced by Sentinel-6 Michael Freilich to ensure their accuracy.

Launched from Vandenberg Air Force Base in November 2020, the satellite is continuing a nearly 30-year legacy started by the TOPEX/Poseidon satellite, which began its mission to measure sea surface height in the early 1990s. A series of successor satellites have carried on the effort since then, with Sentinel-6 Michael Freilich being the most recent. Its twin, Sentinel-6B, is slated to launch in 2025.

“These missions, of which Sentinel-6 Michael Freilich is the latest, are the gold standard when it comes to sea level measurements, which are critical for understanding and monitoring climate change,” said Josh Willis, Sentinel-6 Michael Freilich project scientist at NASA’s Jet Propulsion Laboratory in Southern California.

Meltwater From Greenland Glaciers

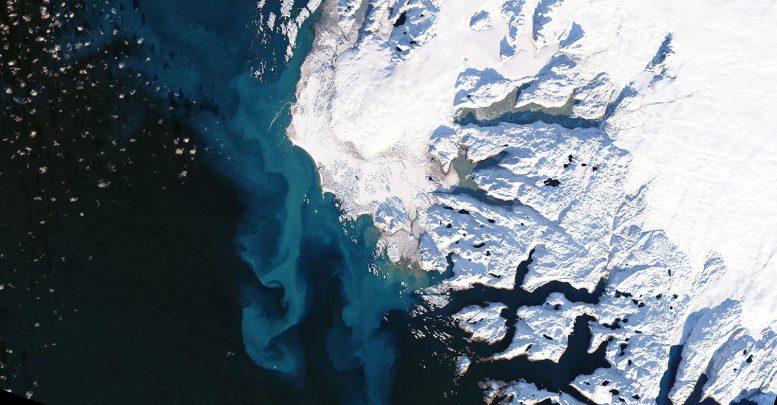
Meltwater from Greenland glaciers like the one pictured can contribute significantly to sea level rise. Sentinel-6 Michael Freilich monitors the height of Earth’s oceans so that researchers can better understand the amount and rate of sea level rise. Credit: NASA Earth Observatory using Landsat data from USGS

Long-term records of sea level height are key to monitoring how much, and how fast, the oceans are rising in a warming climate. “We can’t lose track of how much sea level has gone up because if we do, it’s hard to predict what’s going to happen in the decades to come,” Willis added.

“The unprecedented accuracy of the sea level measurements provided by this mission ensures not only the continuity of a 30-year data record, but allows improving our understanding of climate change and the impact of rising seas on coastal areas and communities,” said Julia Figa Saldana, ocean altimetry program manager at the European Organisation for the Exploitation of Meteorological Satellites (EUMETSAT).

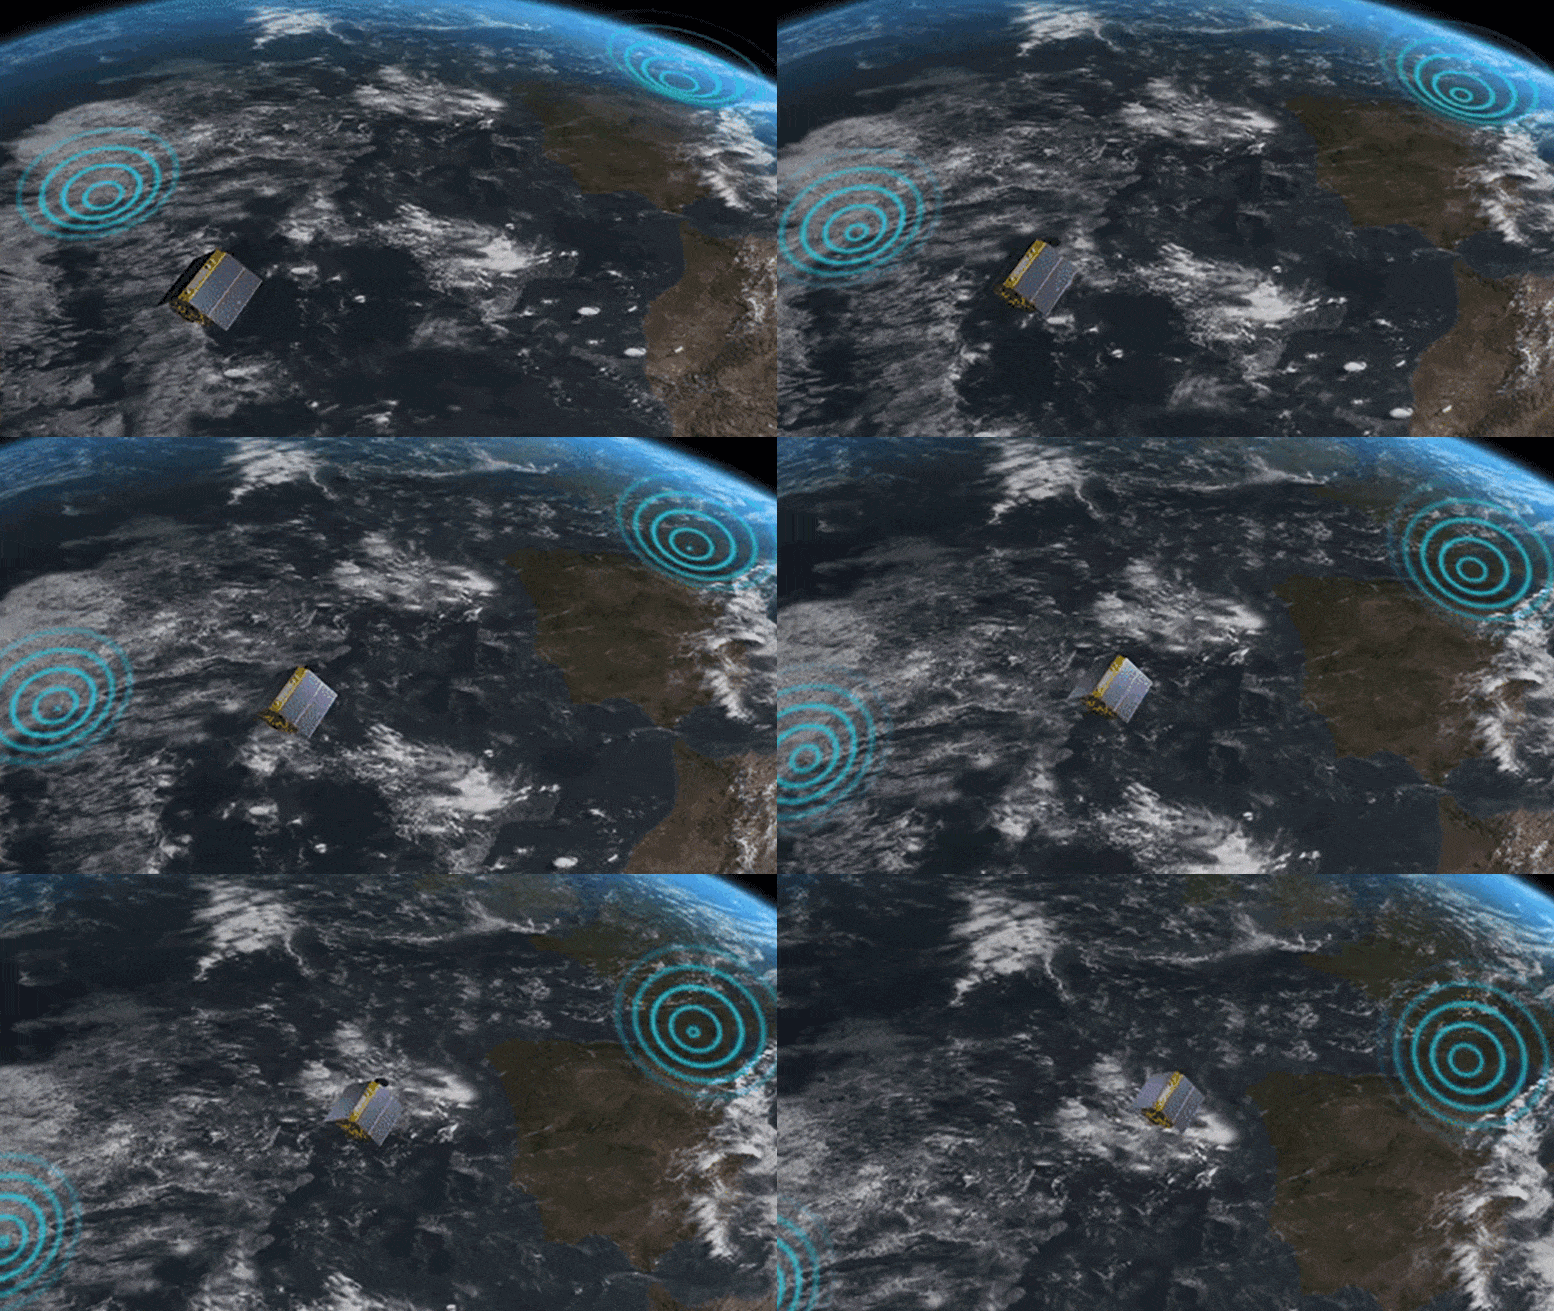
Sentinel-6 Michael Freilich

Sentinel-6 Michael Freilich. Credit: NASA

After Sentinel-6 Michael Freilich launched, it settled into orbit flying 30 seconds behind its predecessor, Jason-3. Science and engineering teams have spent the time since launch making sure Sentinel-6 Michael Freilich was collecting the intended data and that the information was accurate. Some of the initial data was made available last year for use in tasks like weather forecasting. And after further validation, the scientists agreed that Sentinel-6 Michael Freilich should become the reference satellite for sea level measurements.

Later this year, teams will move Jason-3 into what’s called an interleaved orbit. From that new position, the ground track – or the strip of Earth that Jason-3’s instruments see as the satellite travels around the planet – will run in between the ground tracks of successive orbits for Sentinel-6 Michael Freilich. Jason-3 will keep measuring sea level height from the interleaved orbit, although it will no longer serve as the official reference sea level satellite. But by continuing to collect sea level data, Jason-3 will essentially double the number of measurements seen by each pass of Sentinel-6 Michael Freilich, helping to greatly increase the spatial resolution of sea level measurements provided by both satellites.

More About the Mission

Sentinel-6 Michael Freilich, named after former NASA Earth Science Division Director Michael Freilich, is one of two satellites that compose the Copernicus Sentinel-6/Jason-CS (Continuity of Service) mission.

Sentinel-6/Jason-CS was jointly developed by ESA (European Space Agency), EUMETSAT, NASA, and NOAA, with funding support from the European Commission and technical support on performance from CNES (France’s National Centre for Space Studies). Spacecraft monitoring and control, as well as the processing of all the altimeter science data, is carried out by EUMETSAT on behalf of the EU’s Copernicus program, with the support of all partner agencies.

JPL, a division of Caltech in Pasadena, contributed three science instruments for each Sentinel-6 satellite: the Advanced Microwave Radiometer, the Global Navigation Satellite System – Radio Occultation, and the Laser Retroreflector Array. NASA also contributed launch services, ground systems supporting operation of the NASA science instruments, the science data processors for two of these instruments, and support for the U.S. members of the international Ocean Surface Topography Science Team.

We recommend

Antarctic Sea Ice Sinks to Record Low

Antarctic Sea Ice Reaches Record Low

February 25, 2022

The long-term trend for sea ice in the south is flat, while the global trend points downward.

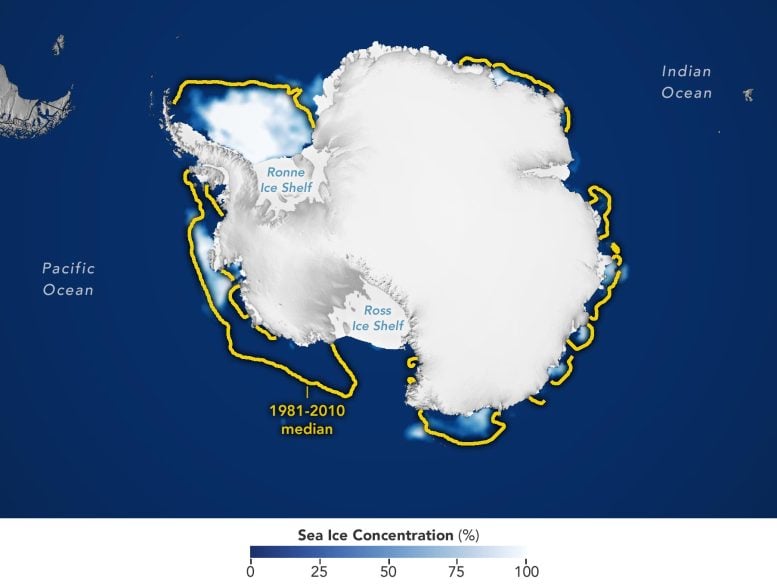
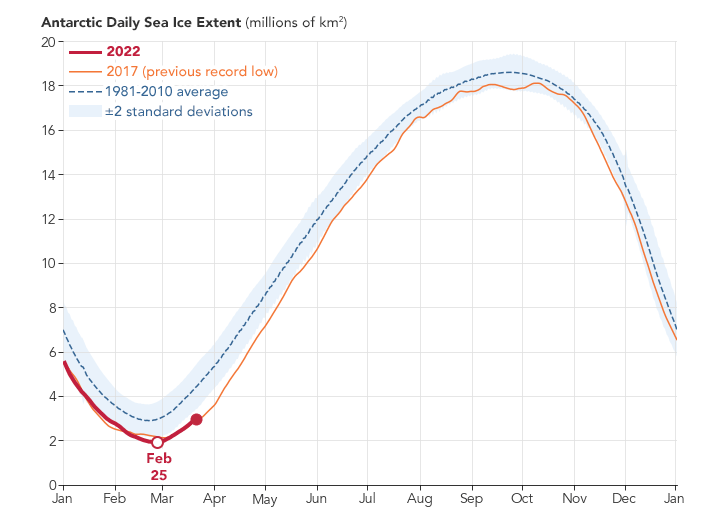
In February 2022, sea ice around Antarctica reached the lowest extent ever observed since the start of the satellite record in 1979. It marks the first time that the ice was observed to shrink below 2 million square kilometers.

Sea ice in southern polar waters reached its lowest extent on February 25, 2022, at 1.92 million square kilometers (741,000 square miles). That’s 190,000 square kilometers (73,000 square miles) below the previous record-low reached on March 3, 2017. Compared to the average minimum, the sea ice this year is missing an area about twice the size of California.

The map above shows the ice extent on the day of its record low. Extent is defined as the total area in which the ice concentration is at least 15 percent. The yellow outline shows the median sea ice extent for February from 1981–2010. A median is the middle value: That is, half of the extents were larger than the yellow line and half were smaller.

Antarctic Daily Sea Ice Extent 2022

1978 – 2022

The 2021-2022 melting season began earlier than usual, after the ice reached its seasonal maximum extent on September 1, 2021, and then quickly declined through the austral spring and summer. According to Walt Meier, a sea ice researcher at the National Snow and Ice Data Center, winds were the main reason for the low ice conditions this year. He explained that the winds around the continent were “much stronger than normal,” which quickly pushed ice north into warmer waters where it melted. An exception was in the Weddell Sea, where winds pushed the ice edge south.

Now, one month after sea ice reached its annual minimum, Meier said that the rate of growth looks normal. Even the heatwave that sent Antarctica’s air temperatures soaring in the third week of March does not seem to have slowed the growth. “It is really the ocean temperatures that count,” Meier said, “and a brief heat wave won’t affect things too much in that regard.”

It remains to be seen how much ice will regrow this year. While it is common for Antarctic sea ice to melt nearly all the way back to the coastline during the austral summer, the ice grows unconstrained through autumn and winter. After months of growth (February to September), new sea ice typically spans an area of ocean about twice the size of the continental United States.

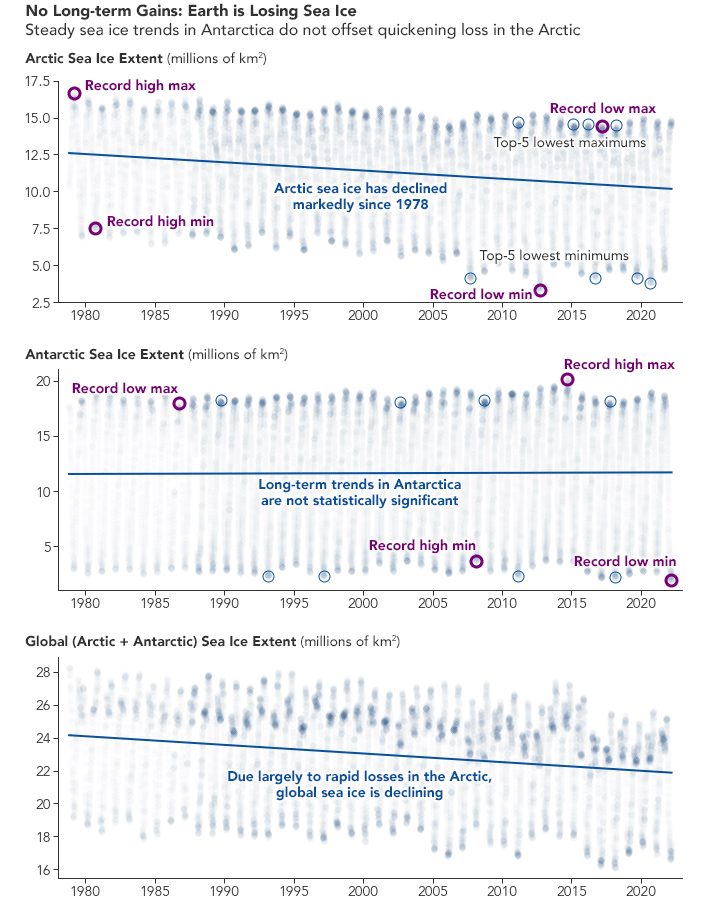
Earth is Losing Sea Ice

1978 – 2022

From year to year, Antarctic sea ice can be highly variable; since 2013 it has reached its highest high and its lowest low since record keeping began. A surge of sea ice growth in 2014 and 2015 enhanced a small upward trend in the long-term record. But over the past seven years, sea ice has generally been at or below average, including record-low minimums in 2017 and 2022. The long-term trend now appears flat, and because of the variability, is not considered statistically significant.

In contrast, sea ice in the Arctic shows a clear downward trend. That means that globally, the planet is losing sea ice. “Overall, for the Arctic and Antarctic combined,” Meier said, “the trend is definitely still downward.”

NASA Earth Observatory images by Joshua Stevens, using data from the National Snow and Ice Data Center.

Ice Shelf Completely Disintegrates in East Antarctica

Ice Shelf Collapse in East Antarctica

The shelf’s disintegration in March 2022 has reshaped a landscape where coastal glacial ice was once thought to be stable.

It is relatively common for ice shelves in Antarctica to spawn icebergs. It is less common for an ice shelf to completely disintegrate. In March 2022, an ice shelf in East Antarctica did both. The collapse has reshaped a part of the Antarctic landscape where coastal glacial ice was once thought to be stable.

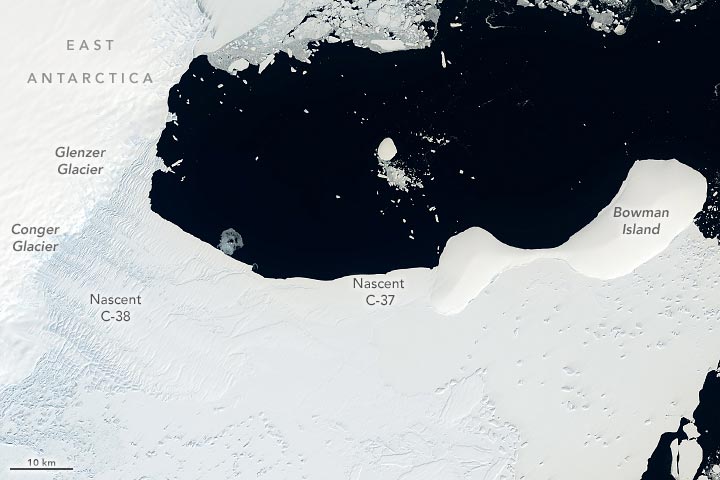
East Antarctica Ice Shelf January 2022 Annotated

January 9, 2022

East Antarctica Ice Shelf March 2022 Annotated

March 23, 2022

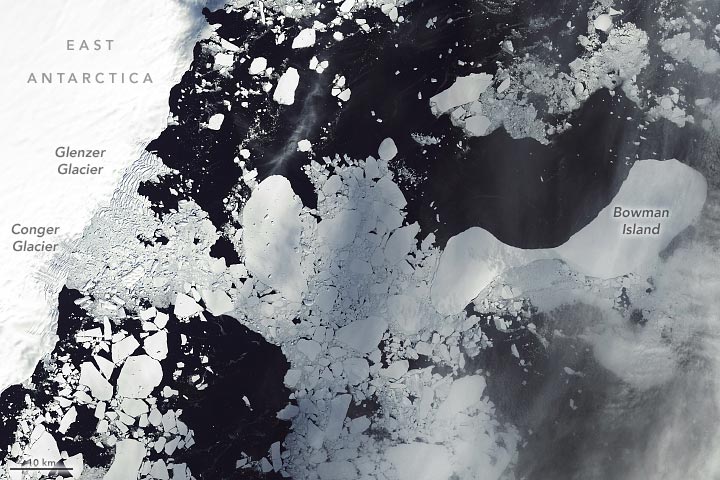
The change happened fast. At the start of March 2022, the floating shelf fed by the Glenzer and Conger glaciers was still intact. By the middle of the month, it had fallen apart. This image pair (above), acquired by the Operational Land Imager (OLI) on Landsat 8, shows the shelf before and after it disintegrated.

“The whole shelf collapsed in just around two weeks,” said Christopher Shuman, a University of Maryland, Baltimore County, glaciologist based at NASA’s Goddard Space Flight Center. The icy remnants of both glacial shelf ice and adjacent sea ice dispersed from the waters around Bowman Island within weeks. “All of this took less than a month,” Shuman said. “It was quite the blowout.”

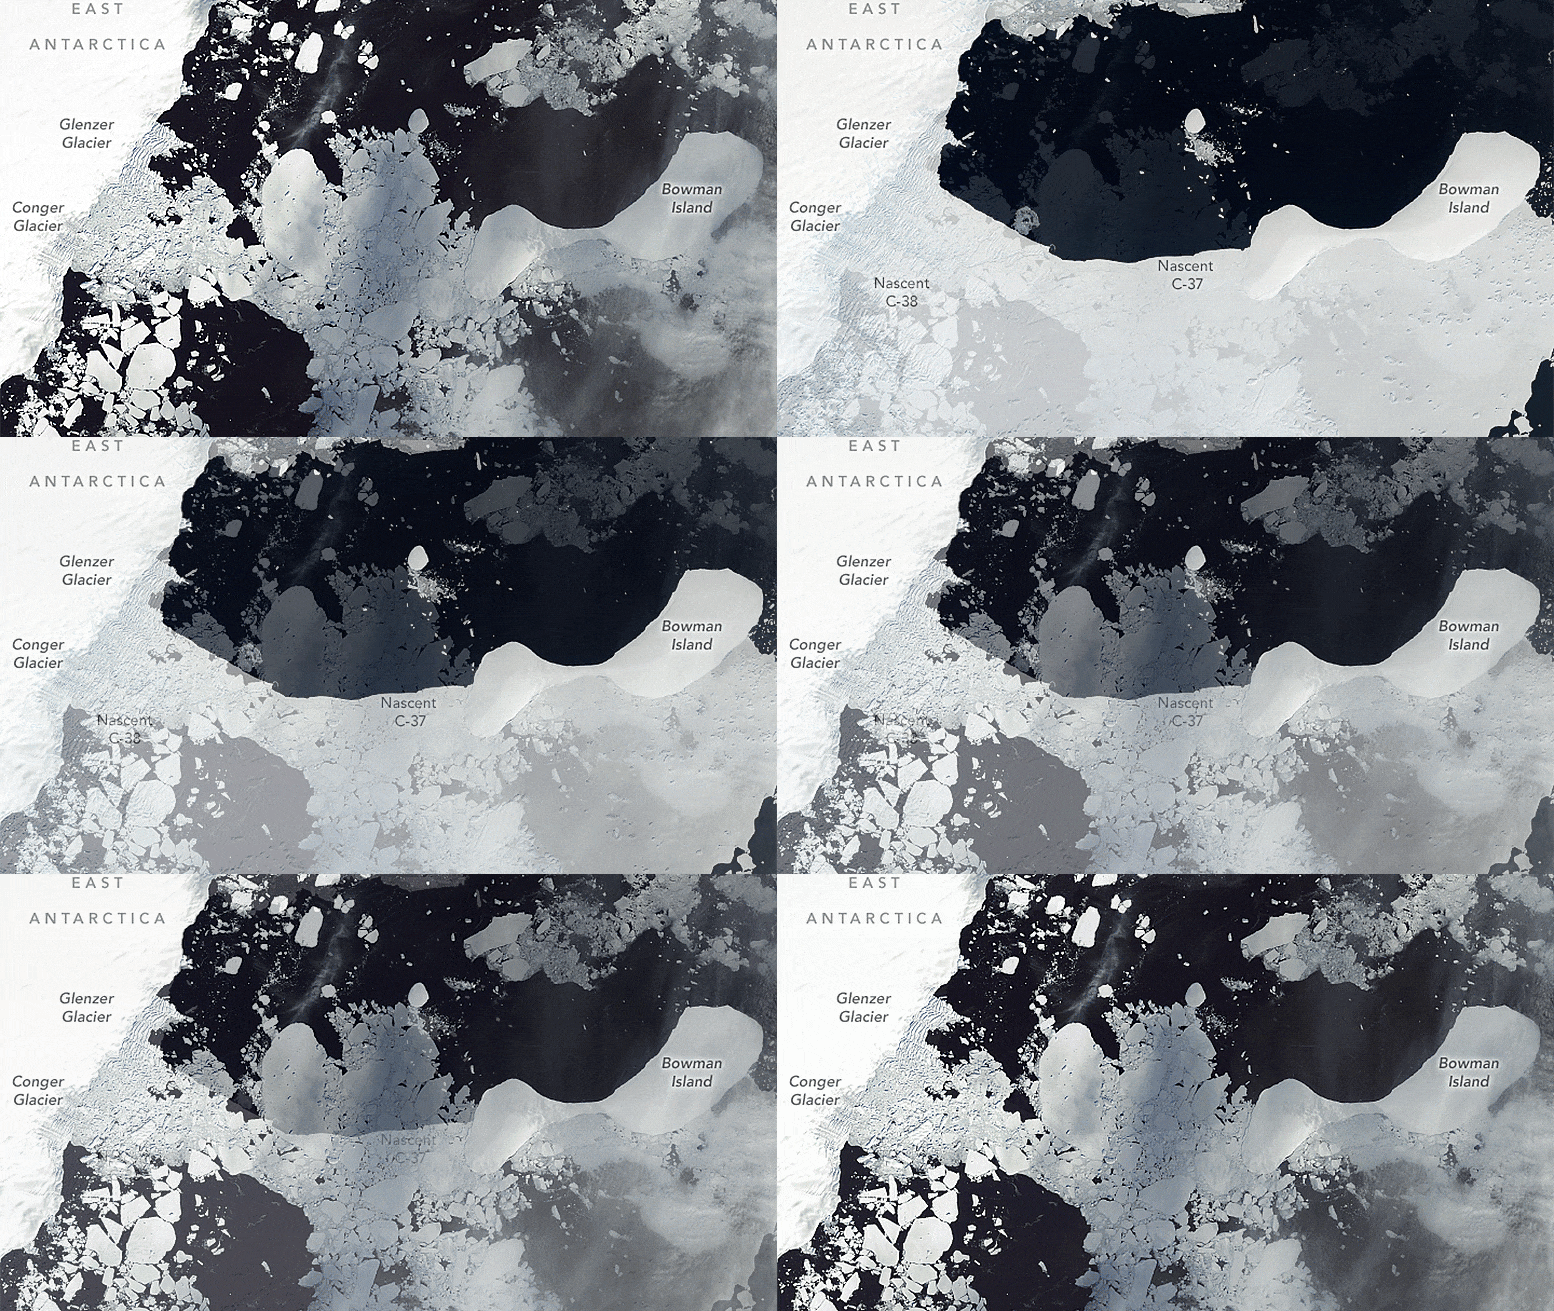
Ice Shelf Collapse in East Antarctica Annotated

February 22 – March 21, 2022

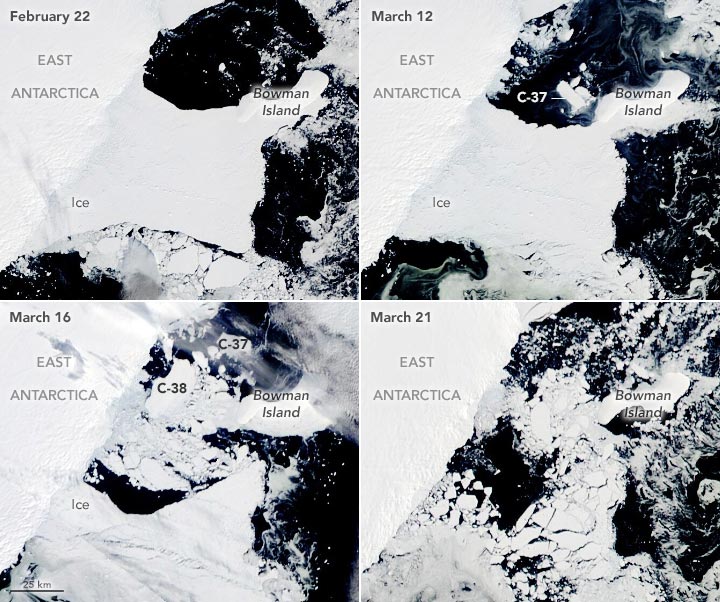
The progression of the collapse is visible in the image series above. Images were acquired with the Moderate Resolution Imaging Spectroradiometer (MODIS) on NASA’s Terra and Aqua satellites.

The first image shows the ice shelf floating on the Mawson Sea on February 22, 2022, prior to the collapse. Fast ice—a type of sea ice that becomes “fastened” to the edges of ice shelves, coastlines, and icebergs—is also part of the mix. For two years prior to this image, the shelf was already in a state of decline. According to Catherine Walker of the Woods Hole Oceanographic Institution, the shelf was losing ice at an average rate of about 1 square kilometer per day through the natural process of iceberg calving.

But in early March 2022, the shelf in front of the Glenzer Glacier calved a substantial iceberg. Named C-37, the berg initially measured about 144 square kilometers (56 square miles). A few pieces broke off, such that C-37 measured about 81 square kilometers on March 12 when MODIS acquired the second image in the series. The substantial loss of ice meant the shelf disconnected from Bowman Island. (Note that some sea ice remained attached to the island.)

“Without being supported by a land anchor, the ice shelf was destabilized and primed to collapse,” said Jonathan Wille, a postdoctoral researcher at the Université Grenoble Alpes.

According to Wille, an atmospheric river on March 15 appears to have triggered the shelf’s final collapse. The weather system—which caused temperatures in eastern Antarctica to soar 40 degrees Celsius above normal—also enhanced ocean swells and amplified winds near the vulnerable shelf. This likely caused the ice in front of Conger Glacier to break apart and quickly disperse.

The third MODIS image above shows the area on March 16 after the final collapse. The event spawned Iceberg C-38, which at the time measured about 415 square kilometers (160 square miles). The final image in the series shows the crumbled shelf ice and fast ice as it dispersed in the sea on March 21.

The loss of an ice shelf is problematic because it can indirectly contribute to sea level rise. “Ice shelves are essentially the ‘safety band’ holding up the rest of the Antarctic Ice Sheet,” Walker said. When they collapse, the ice behind them can more quickly flow into the ocean. “And that is what raises sea levels.”

By Antarctic standards, the ice shelf and glaciers that it held back are relatively small, so the impacts from the collapse are expected to be minimal. Scientists are more concerned about the location of the collapse.

“All of the previous collapses have taken place in West Antarctica, not East Antarctica, which until recently has been thought of as relatively stable,” Walker said. “This is something like a dress rehearsal for what we could expect from other, more massive ice shelves if they continue to melt and destabilize. Then we’ll really be past the turnaround point in terms of slowing sea level rise.”

NASA Earth Observatory images by Lauren Dauphin, using Landsat data from the U.S. Geological Survey and MODIS data from NASA EOSDIS LANCE and GIBS/Worldview.


 Missing Link: Global Warming Speeds Up Currents in the Ocean’s Abyss

Global Ocean Circulation

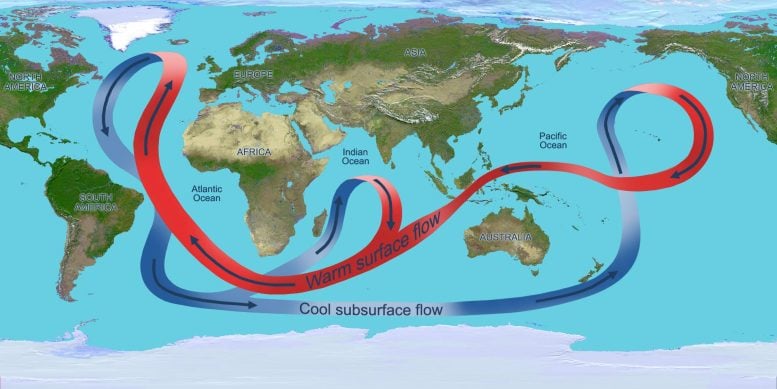
Circulation of the global ocean. Credit: NASA

Finding could help refine climate modeling.

University of Sydney scientists have used the geological record of the deep sea to discover that past global warming has sped up deep ocean circulation. This is one of the missing links for predicting how future climate change may affect heat and carbon capture by the oceans.

University of Sydney scientists have used the geological record of the deep sea to discover that past global warming has sped up deep ocean circulation.

This is one of the missing links for predicting how future climate change may affect heat and carbon capture by the oceans: more vigorous ocean currents make it easier for carbon and heat to be ‘mixed in’.

“So far, the ocean has absorbed a quarter of anthropogenic CO2 and over 90 percent of the associated excess heat,” said the study’s lead author, Dr. Adriana Dutkiewicz from the EarthByte group in the School of Geosciences at the University of Sydney.

Microscopic marine organisms called plankton use this dissolved carbon to build their shells. They sink down to the seabed after they die, sequestering the carbon. These sedimentary deposits form the Earth’s largest carbon sink.

The authors note that climate observations and models have been used alternatively to argue that deep ocean circulation may be slowing down or speeding up during global warming. This inconsistency is a problem for modeling future climate trends and the new study, published today in the leading journal Geology, helps resolve this controversy.

“The satellite data typically used to inform ocean models only cover a few decades, leading to a poor understanding of longer-term ocean variability. This prompted us to look at the deep-sea geological record to decipher these changes,” Dr. Dutkiewicz said.

Scientific ocean drilling data collected over half a century have generated a treasure trove from which to map deep sea currents. Dr. Dutkiewicz and co-author Professor Dietmar Müller compiled data from more than 200 drill sites to map the deep-sea sedimentary record, which can indicate current speed.

“A break in sedimentation indicates vigorous deep-sea currents, while continuous sediment accumulation indicates calmer conditions,” Professor Müller said. “Combining these data with reconstructions of ocean basins has allowed geologists to track where and when these sediment breaks occurred.”

Past global cooling led to sluggish currents

The maps indicate that over the last 13 million years as the earth progressively cooled and developed expanding inland ice caps, sediment breaks gradually became less frequent – a tell-tale sign of deep-sea circulation becoming more sluggish.

By contrast, during the ‘hothouse climate’ period immediately before that with global temperatures 3-4°C warmer than today, deep-ocean circulation was significantly more vigorous.

“Fast-forward to today, independent studies using satellite data suggest that large-scale ocean circulation and ocean eddies have become more intense over the last two to three decades of global warming, supporting our results,” Professor Müller said.

Another recent study, focused on the ocean floor around New Zealand, found that the production of seashells preserved as carbonate sediment was higher during ancient periods of climate warming, despite ocean acidification during those times.

Dr. Dutkiewicz added: “Combining their results with ours leads us to conclude that warmer oceans not only have more vigorous deep circulation but are potentially also more efficient at storing carbon.”

Yet the authors cautioned that we need to better understand how the ocean’s capacity to store heat and carbon dioxide will be affected by future warming. “A more comprehensive analysis of the geological history of ocean basins is needed to verify this,” Dr. Dutkiewicz said.

Reference: “Deep-sea hiatuses track the vigor of Cenozoic ocean bottom currents” by Adriana Dutkiewicz and Dietmar Müller, 24 March 2022, Geology.
DOI: 10.1130/G49810.1

This research was supported by the Australian Research Council Future Fellowship grant (FT190100829) and by AuScope.


Endangered Delicacy: Tropical Sea Cucumbers in Trouble – Critical for Healthy Ocean Ecosystems

White Teatfish Sea Cucumber

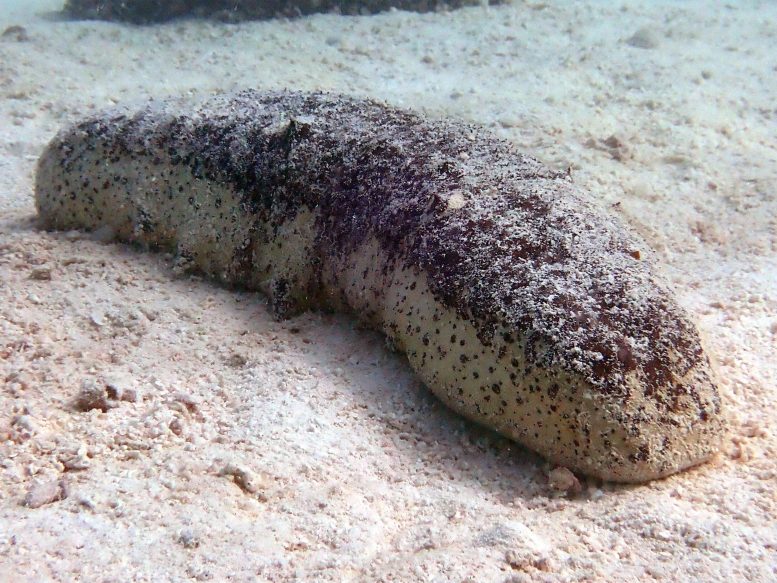
White Teatfish sea cucumber in the Southern Great Barrier Reef. Credit: Steve Purcell

Sea cucumbers are critical for healthy ocean ecosystems.

Researchers are calling for better protection of tropical sea cucumbers in the Great Barrier Reef whose numbers are dwindling due to persistent and increasing overharvesting.

New research reveals that overharvesting has put the Great Barrier Reef’s tropical sea cucumber populations in peril, with strong demand for this delicacy from East and Southeast Asia.

Several kinds of sea cucumber are harvested, mainly for Chinese consumption. The global market for sea cucumbers is estimated to be worth over USD$200 million annually.

Published in Biological Conservation, the research was led by a team from the University of Sydney and the University of Queensland.

“Known as the earthworms or vacuums of the sea, sea cucumbers are critical for reef health, helping keep the seafloor clean and productive,” said Dr. Maria Byrne, Professor of Marine Biology from the School of Life and Environmental Sciences at the University of Sydney.

“Abundant sea cucumber populations on unfished reefs process tonnes of lagoon sediments annually through their body – they are the clean sand solution.

“These animals are in peril globally and their harvest on the Great Barrier Reef is of great concern.

“Fishery data collected along Australia’s primary sea cucumber fishing ground on the Reef has shown the need for caution and regulatory changes.

“The Great Barrier Reef is home to 10 of the world’s 16 endangered or vulnerable sea cucumber species. The data shows populations of some of the highest-valued species have been dwindling due to increasing and persistent global overharvest.

Teatfish in particular peril

One fast-disappearing group of tropical sea cucumbers, known as teatfish, is of particular concern.

Teatfish are listed on CITES (Convention on International Trade in Endangered Species), which provides a strong basis to restrict their harvest and export. Yet two of these species, the white teatfish and black teatfish, represented more than 20 percent of the Queensland fishery’s recent total catch.

Populations of teatfish are most at risk because of their high market value and poor reproduction. The individuals that remain on the reef fail to find a mate due to fishery removal.

“Black teatfish numbers have not recovered since their fishery was closed in 1999 due to overharvest – although the fishery reopened in 2019,” said Dr. Kenny Wolfe from the University of Queensland.

“In December 2021 we saw a ray of hope, when the federal Minister for the Environment Sussan Ley supported the CITES listing, and in recognition of their perilous state determined that black teatfish harvest would not be permitted.

“It’s a great win for one of our 10 endangered or vulnerable sea cucumbers, but further policy interventions are needed to ensure other sea cucumber populations don’t start teetering toward extinction,” he said.

Greater government protection needed

Professor Byrne said effective statutory regulation was essential for protecting sea cucumbers.

“The Great Barrier Reef sea cucumber fishery has long been operating under what’s known as a non-regulatory – and therefore a non-binding – Performance Measurement System.

“This system recommended regular assessment of sea cucumber stocks, but these weren’t done, so industry has been operating for decades without any real idea of the impact of their harvests on stock sustainability.

“Going forward it will be essential to have a statutory regulated and enforced policy framework for regular fishery independent stock assessments for all tropical sea cucumber species harvested on the Great Barrier Reef.

“Only then would we be able to assess what is a sustainable harvest and identify species-specific interventions, hopefully avoiding local extinction of these ecologically important sea cucumber species on the Great Barrier Reef.

“This is essential for the health of the reef and provides an important contribution to meeting the Australian and Queensland Governments’ Reef 2050 plan, ensuring the UNESCO “at-risk” status of the Great Barrier Reef is avoided, and for Queensland Department of Agriculture and Fisheries to meet its latest Sustainable Fisheries Strategy.”

Reference: “Overview of the Great Barrier Reef sea cucumber fishery with focus on vulnerable and endangered species” by Kennedy Wolfe and Maria Byrne, 29 January 2022, Biological Conservation.
DOI: 10.1016/j.biocon.2022.109451