Tuesday, August 11, 2020


GIG ECONOMY
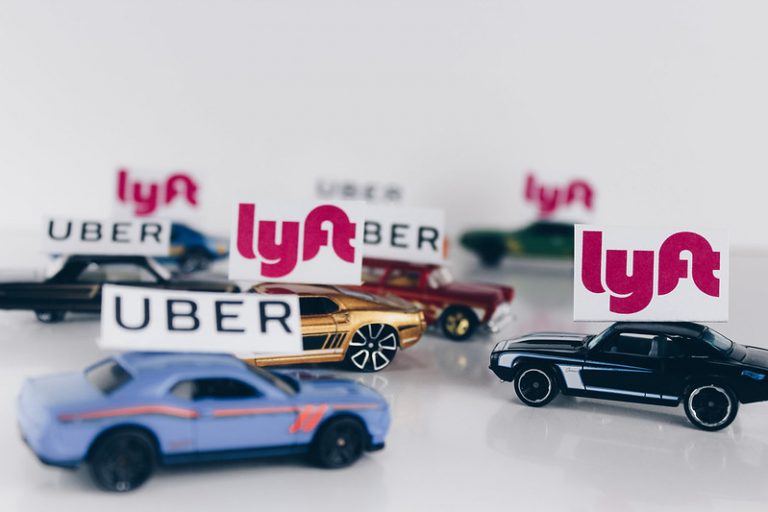
Uber and Lyft ordered by judge to classify drivers in California as employees

BY DUNCAN RILEY

A judge in California ruled today that Uber Technologies Inc. and Lyft Inc. must classify their California-based drivers as employees to comply with state law.

California Assembly Bill 5, signed into law Sept. 18 and in effect since January, forces companies to classify gig-economy and freelance contractors as employees if they work more thanr a certain number of hours. Supporters say the law protects worker rights such as minimum wage, unemployment insurance, paid family leave, workers’ compensation and paid sick leave.

The ruling by Judge Ethan Schulman of the San Francisco Superior Court came after the city attorneys of Los Angeles, San Diego and San Francisco, along with California Attorney General Xavier Becerra, filed a lawsuit against both Uber and Lyft, arguing that both companies were violating AB 5 by misclassifying drivers.

Schulman found that Uber’s and Lyft’s refusal to convert their drivers to employees was a “prolonged and brazen refusal to copy with California law” and that “defendants may not evade legislative mandates merely because their businesses are so large that they affect the lives of many thousands of people.”

As Protocol noted, the judgment will not go into effect for 10 days, giving both companies a window to appeal the ruling — which both will do.

“Drivers do not want to be employees, full stop. We’ll immediately appeal this ruling and continue to fight for their independence,” Uber said in a statement. “Ultimately, we believe this issue will be decided by California voters and that they will side with drivers.”

The latter refers to a push by Uber, Lyft and DoorDash for Proposition 22, a ballot measure that asks voters to exempt them from the law. A yes vote on the proposition would define “app-based transportation (rideshare) and delivery drivers as independent contractors and adopt labor and wage policies specific to app-based drivers and companies.”

Although Uber is arguing for its drivers to remain independent contractors, Chief Executive Officer Dara Khosrowshahi said in an op-ed in The New York Times that gig workers deserve better and that there should be a “third way” to classify those working in the gig economy.

Khosrowshahi suggested that companies that rely on gig workers should be required by law to create benefit funds that can be used by workers for anything from health insurance to paid time off. Referring specifically to the California lawsuit, Khosrowshahi claimed that the classification of workers as contractors versus employees was a “false choice.”

“Our current system is binary, meaning that each time a company provides additional benefits to independent workers, the less independent they become,” Khosrowshahi said. “That creates more uncertainty and risk for the company, which is a main reason why we need new laws and can’t act entirely on our own.”

Eye candy: More than 50,000 pink flamingos mass in France


by Elaine Ganley
In this Wednesday, Aug. 5, 2020 photo provided by Salins de Camargue, flamingo experts surround babies pink flamingos in Aigues-Mortes, the Camargue region, southern France, to gather and put bands on baby birds so scientists can track their migration. The numbers of pink flamingos may be the highest since experts began keeping records 45 years ago, said Thierry Marmol, guardian of the lands. France's two months of strict confinement may well be the reason. (Fabrice Pavanello, Salins de Camargue via AP)

Behold a treat for the eyes! Tens of thousands of pink flamingos have amassed in the wetlands of southern France along with their offspring still lacking flamboyant plumage.


The long-legged birds resembling ballerinas in tutus have long drawn tourists to the marshes in the Camargue region that has served as France's salt mine since Roman times. But the numbers of pink flamingos this year may be the highest since experts began keeping records 45 years ago, said Thierry Marmol, the guardian of the vast ecosystem.

France's two months of strict confinement to contain the coronavirus may well be the reason.

Experts relying on aerial photos estimated that 25,000 flamingo couples, or 50,000 adult birds, settled in the area this year, Marmol said. About 12,000 babies were counted. "That's historic," he said, stressing that little ones are hard to count.

"Maybe the confinement helped to make a good year," Marmol said. "It's obvious that with confinement there were no disturbances. There were no airplanes, no noise at all."

It's still too soon to confirm that the anti-virus lockdown was a factor in what he said is "one of the best four years of all time" for pink flamingos in the Salins.

Marmol has watched over 8,000 hectares (19,700 acres) around the commune of Aigues-Mortes for the past 35 years, living on the land "like a trapper in America."
In this Wednesday, Aug. 5, 2020 photo provided by Salins de Camargue, a flamingo expert walks in the water, in Aigues-Mortes, the Camargue region, southern France, to gather and put bands on baby birds so scientists can track their migration. The numbers of pink flamingos may be the highest since experts began keeping records 45 years ago, said Thierry Marmol, guardian of the lands. France's two months of strict confinement may well be the reason. (Fabrice Pavanello, Salins de Camargue via AP)

He is a keen observer of the birds, fauna and flora that draw ornithologists and other experts for field work. This year's bumper crop of pink flamingos is a treat even for him.

The Salins, with its especially salty water, also supplies France with tons of salt. Aigues-Mortes is about 50 kilometers (about 30 miles) from Arles, the closest large town.

Flamingo experts spent some three hours Wednesday fitting 320 baby birds with two bands - one plastic, one metal - so scientists can track their migration.

When autumn arrives, many will be migrating to warmer weather in Spain, Italy, Turkey or North Africa. The bands are "like a license plate," Marmol said. The plastic band allows ornithologists to spot them with binoculars or a telescope. The information is relayed to scientists tracking the birds in centers around the world. Each country uses a designated color for the bands.

In this Wednesday, Aug. 5, 2020 photo provided by Salins de Camargue, flamingo experts walk in the waters, in Aigues-Mortes, the Camargue region, southern France, to gather and put bands on baby birds so scientists can track their migration. The numbers of pink flamingos may be the highest since experts began keeping records 45 years ago, said Thierry Marmol, guardian of the lands. France's two months of strict confinement may well be the reason. (Fabrice Pavanello, Salins de Camargue via AP)
In this Wednesday, Aug. 5, 2020 photo provided by Salins de Camargue, flamingo experts walk in the water, in Aigues-Mortes, the Camargue region, southern France, to gather and put bands on baby birds so scientists can track their migration. The numbers of pink flamingos may be the highest since experts began keeping records 45 years ago, said Thierry Marmol, guardian of the lands. France's two months of strict confinement may well be the reason. (Fabrice Pavanello, Salins de Camargue via AP)

Luckily for pink flamingo aficionados, about half will choose to stay behind. Who knows why?

Babies must wait for their plumes to grow. Adults and others ready to take off may decide the coming winter won't be cold so "they take their chance and stay," Marmol said.

He recalled France's very cold winter of 2003, when thousands of pink flamingos were found dead.

"They made a bad choice that year," Marmol said.

Explore further Pinker flamingos more aggressive

© 2020 The Associated Press. All rights reserved. This material may not be published, broadcast, rewritten or redistributed without permission.
Personal connections key to climate adaptation

by ARC Centre of Excellence for Coral Reef Studies
The study found people are more empowered to respond to the devastating impacts of climate change when they see others doing the same. Credit: Dean Miller.

Connections with friends and family are key to helping communities adapt to the devastating impact of climate change on their homes and livelihoods, a new study shows.


The research found people are more empowered to respond when they see others doing the same.

Scientists analysed how an island community in Papua New Guinea of around 700 people coped with the impact of encroaching sea-levels and dwindling fish stocks. The study, published in the journal Nature Climate Change, examined the actions households took to deal with these impacts.

Lead author Dr. Michele Barnes, from the ARC Centre of Excellence for Coral Reef Studies (Coral CoE), said: "We found their actions were related to their social networks, the ways they are connected to other people within the community."

"To cope with the impacts of climate change, existing practices or behaviours can be tweaked—this is adaptation. However, in some cases this won't be enough, and people need to enact more fundamental changes—transformation."

"In our case, adaptation included things like building sea walls to protect existing land use," said co-author Dr. Jacqueline Lau, from Coral CoE and WorldFish. "And transformation involved developing alternative food and income sources away from fish and fishing-related activities."


Essentially both sets of actions are necessary to combat the impacts of climate change. Dr. Barnes says influence within social networks is what encouraged this: the households more socially connected to others taking action were more likely to do the same.

"It may be a situation of 'like-attracts-like' where households with particular mindsets are more socially connected to similar households," Dr. Barnes said. "Another explanation is that households were influencing each other's actions. It's likely a combination of the two," she said.

The authors also found household connections with the marine environment played an important role in determining the responses to climate impacts.

"Climate change and other human impacts rapidly degrade coral reef ecosystems and alter the composition of reef fish communities," said co-author Professor Nick Graham, of Lancaster University in the UK.

"The adaptation of coastal communities is becoming essential. Our research highlights that interacting with and learning from the marine environment is one mechanism through which this adaptation can be achieved," he said.

Dr. Barnes says the policies and programs seeking to reduce vulnerability to climate change often focus on building up material assets or creating infrastructure.

"Our research emphasises a broader set of factors can play an important part in the actions communities end up taking," she said.


Explore further

More information: Michele L. Barnes et al, Social determinants of adaptive and transformative responses to climate change, Nature Climate Change (2020). DOI: 10.1038/s41558-020-0871-4

Journal information: Nature Climate Change

Provided by ARC Centre of Excellence for Coral Reef Studies
GOOD NEWS
Brazil hails reduction in Amazon deforestation in July

TOO LITTLE TOO LATE

\Smoke rises from a burned area in the Xingu Indigenous Park, Mato Grosso state, Brazil, in the Amazon basin, on August 6, 2020

Brazil on Friday hailed figures showing a reduction in July of deforestation that has spooked international investors, though environmentalists warned it was too early to proclaim success.


Official data showed a swath of Brazil's Amazon rainforest about the size of London—more than 1,600 square kilometers (620 square miles)—was cleared in July, down from the 2,250 km2 lost in July 2019.

That shows government efforts have achieved an "inversion of the trend," said Vice President Hamilton Mourao, who heads Brazil's National Amazon Council.

An analysis of longer-term figures for the world's largest rainforest is more worrying, however.

The 4,730 km2 of deforestation in the Amazon from January 1 to July 31 was slightly above the 4,700 km2 from the same period in 2019, the country's National Institute for Space Research (INPE) said.

The difference is much greater when examining 12-month figures: The 9,200 km2 lost from August 2019 to July 2020 was sharply higher than the 6,800 km2 cleared in the previous 12 months.

The administration of far-right President Jair Bolsonaro is under pressure to stop Amazon deforestation and forest fires, after international investment funds that collectively administer close to $4 trillion in assets wrote an open letter to the leader in June, urging the end of projects that accelerate the area's destruction.

Bolsonaro's policies have opened up protected and indigenous areas to mining and farming, but the investors' call has been taken seriously by a government that needs capital to reignite an economy ravaged by the coronavirus.

Mourao last month committed to cutting deforestation and forest fires "to an acceptable minimum."

Environmentalists, however, were not optimistic about the latest numbers.

"We cannot celebrate that we haven't surpassed the 2019 record. That's positive, but it's important to understand that 1,600 km2 is a lot," Ane Alencar, science director at the Amazon Environmental Research Institute, told AFP.

"The fires usually start in June, accelerate in August and peak in September."

The NGO Climate Observatory blamed policies under Bolsonaro, a climate change skeptic.

"This isn't ineptitude, it's planned," the group said.

Fires on the rise

Alencar warned that clearing so much land will inevitably lead to another alarming season of forest fires.

Last year, the number of fires in the Amazon put Bolsonaro's government at loggerheads with the international community, which demanded enhanced protection for the rainforest.

Satellite data show the number of forest fires in the Amazon were up last month by 28 percent on July last year.

"Whoever cuts down trees wants to get a return on their investment, and so they burn the cut-down vegetation to clear the land... so stopping fires is the exact way to start in controlling deforestation," Alencar said.

More than 1,600 square kilometers of Brazilian Amazon deforested in July

© 2020 AFP

Nearly 60 different types of fish found in Chicago waterways, study shows

by Michael Hawthorne

Credit: CC0 Public Domain
Amazing what can happen when a city stops dumping massive amounts of bleach into its waterways.

Nearly 60 different types of fish are swimming in the Chicago and Calumet rivers these days, up from fewer than 10 during the early 1980s, according to a new study of sampling conducted by the Metropolitan Water Reclamation District 
Common carp are still the species found most frequently by district biologists during their annual monitoring of the rivers and connected channels. Last year they pulled a nearly 40-pound carp swollen with eggs out of the Little Calumet River.

But since 2001, biologists also have found 19 other species in the waterways for the first time, only one of which wasn't native to the area, the study found.

Among those netted were bluegill, catfish, largemouth bass and yellow perch—species less tolerant to pollution than carp that European immigrants deliberately introduced across the nation during the 19th century.

More robust and diverse populations of fish—scientists call them assemblages—are examples of how a long fight to clean up the rivers is paying off after decades when regional leaders turned them into industrialized sewage canals.

"Actions we're taking are working," said Austin Happel, a research biologist at the Shedd Aquarium and chief author of the new study. "We're already seeing that if you can increase fish diversity, you're also able to increase how people use waterways."

The most dramatic improvements in fish populations occurred after 1984, when the district that collects waste from Chicago and the Cook County suburbs stopped releasing sewage treated with germ-killing chlorine into local waterways.

Chlorine also is highly toxic to fish.


Most other cities that rely on chlorine strip out the chemical before pumping treated sewage into rivers and lakes. Chicago skipped that step because for years its waterways were exempt from the toughest provisions of the Clean Water Act, a 1972 federal law that made it a national goal for all water bodies to be safe enough for fishing and swimming.

Two years before Congress overrode President Richard Nixon's veto of the law, people snickered when Mayor Richard J. Daley said he wanted the Chicago River safe enough for office workers to fish for their lunch. "They can eat fish and have a bottle of beer," the mayor told a congressional committee.

Few thought that would ever happen. Chicago had reversed its flow during the beginning of the last century and blasted through the subcontinental divide separating the Great Lakes and Mississippi River watersheds, literally walling off the city's waste from its source of drinking water while linking two of the continent's major shipping routes.

"The only time the river has a healthy color is on St. Patrick's Day, when the Democrats dye it green with food coloring," the sportswriter Rick Telender wrote in 1977.

Daley and his allies secured billions of dollars set aside by Congress to clean up rivers and lakes. Much of the local share was earmarked for the Deep Tunnel, a $3 billion system of giant tunnels and reservoirs intended to prevent flooding and keep pollution out of waterways and Lake Michigan.

By the mid-1980s, the tunnels had helped reduce oxygen-depleting pollution in the waterways, and the district installed stations on the Cal-Sag Channel to aerate its once-sluggish current, making it more hospitable to fish and other aquatic life.

"Improvements definitely were more dramatic in those earlier years after the tunnels came on line and they stopped chlorinating," said Dustin Gallagher, a district biologist who co-wrote the new study with the Shedd's Happel. "Over the years we are seeing more bluegill and more largemouth bass and steadily larger game fish—all good signs."

Providing suitable places for fish to reproduce and thrive remains a problem in stretches of local waterways that were dredged and lined with thick sheet metal a century ago, Gallagher noted. One potential solution came from biologists from the Shedd and activists who built floating, plant-filled structures in a lightly trafficked channel along Goose Island.

Other significant challenges remain. The Chicago Tribune has reported that billions of gallons of bacteria-laden sewage and runoff still routinely pour into local waterways during and after storms. District leaders have acknowledged that sewage dumping likely will continue across most of Cook County even after the last reservoir connected to Deep Tunnel is completed in 2029.

Chronic sewage dumping, referred to as "sewer overflows" by government officials, threatens the health of the river. Past studies have shown how sewage and other forms of pollution can suffocate fish by quickly reducing oxygen levels in water.

Ongoing abuse of local waterways also is a major reason why the amount of disease-causing bacteria in the water remains staggeringly high, even after the district began sanitizing sewage again.

Monthly testing reveals routine violations of water quality standards in stretches of the waterway that federal and state officials have declared should be clean enough to prevent kayakers, rowing teams and boaters from suffering diarrhea and other gastric ailments.

Along the Riverwalk at Wells Street, fecal coliform levels this year spiked as high as 51,000 colony-forming units per 100 milliliters of water—255 times higher than the state standard of 200 CFUs. Bacteria levels at Wells have averaged 500 CFUs so far this year, district records show.

Just because the water might cause people gastrointestinal distress doesn't make it harmful to fish.

Most of the fish in the Chicago River and its connected channels are safe to eat, though the state advises people to limit consumption of certain species to avoid highly toxic chemicals known as PCBs, another legacy from a century of industrial pollution.

Changing views about local waterways are perhaps best summarized by "The Jetty," a section of the Riverwalk just west of Wells.

It features concrete and metal piers surrounded on two sides by floating gardens. You can walk to the water's edge and cast a line in the shadow of Loop skyscrapers—four decades after the first Mayor Daley mused about it.


Explore furtherChicago waterways—still flowing after over 100 years

©2020 Chicago Tribune


LOTS OF FISH!
Godzilla (1998) - Godzilla Rises Scene (1/10) | Movieclips on Make ...
10. Godzilla | 7 League Boots

Stronger rains in warmer climate could lessen heat damage to crops, says study


by Earth Institute at Columbia University
Farmland in eastern Oklahoma, part of the study area. Credit: Kevin Krajick/Earth Institute, Columbia University.

Intensified rainstorms predicted for many parts of the United States as a result of warming climate may have a modest silver lining: they could more efficiently water some major crops, and this would at least partially offset the far larger projected yield declines caused by the rising heat itself. The conclusion, which goes against some accepted wisdom, is contained in a new study published this week in the journal Nature Climate Change.


Numerous studies have projected that rising growing-season temperatures will drastically decrease yields of some major U.S.crops, absent adaptive measures. The damage will come from both steadily heightened evaporation of soil moisture due to higher background temperatures, and sudden desiccation of crops during heat waves. Some studies say that corn, which currently yields about 13 billion bushels a year and plays a major role in the U.S. economy, could nosedive 10 to 30 percent by the mid- to late century. Soy-the United States is the world's leading producer-could decline as much as 15 percent.

Since warmer air can hold more moisture, it is also projected that rainfall will in the future come more often in big bursts, rather than gentle downpours-a phenomenon that is already being observed in many areas. Many scientists have assumed that more extreme rains might further batter crops, but the new study found that this will probably not be the case. The reason: most of the projected heavier downpours will fall within a range that benefits crops, rather than passing the threshold at which they hurt them.

"People have been talking about how more extreme rain will damage crops," said lead author Corey Lesk, a Ph.D. student at Columbia University's Lamont-Doherty Earth Obsevatory. "The striking thing we found was, the overall effect of heavier rains is not negative. It turns out to be good for crops."

That said, the effects will probably be modest, according to the study. It estimates that corn yields could be driven back up 1 or 2 percent by the heavier rains, and soy by 1.3 to 2.5 percent. These increases are dwarfed by the potential losses due to heat, but even a few percent adds up when dealing with such huge quantities of crops. And, the researchers say, "Our findings may help identify new opportunities for climate-adaptive crop management and improved modeling."
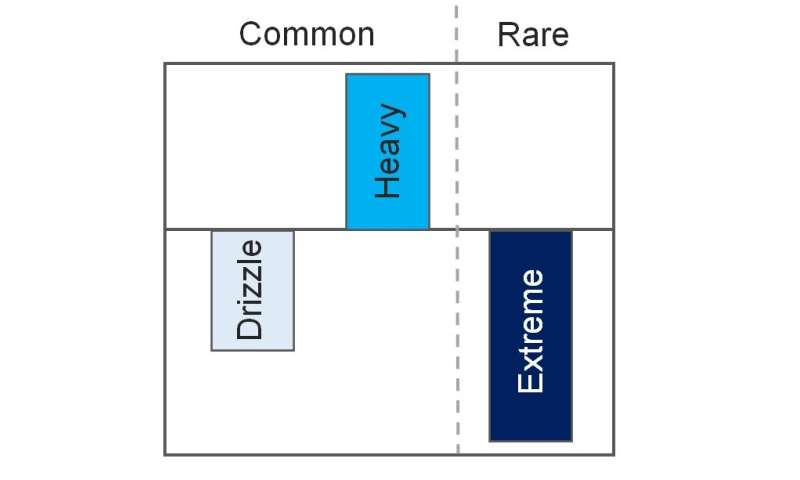
A new study finds that when rain comes down mainly as drizzle, yields of major crops are depressed; when downpours are heavier, yields rise, up a point. Yields go down severely with the most extreme rainfalls, but these are quite rare. Length of bars represents impact on crops per hour. Heavy rainfall is projected to increase more than extremes in the future, giving a boost to crops. Credit: Corey Lesk.

The team reached their conclusions by studying hour-by-hour rainfall patterns recorded by hundreds of weather stations in the agricultural regions of the U.S. West, South and Northeast each year from 2002 to 2017. They then compared the rainfall patterns to crop yields. They found that years with rains of up to about 20 millimeters an hour-roughly the heaviest downpour of the year on average-resulted in higher yields. It was only when rains reached an extreme 50 millimeters an hour or more that crops suffered damage. (20 millimeters an hour is about three-quarters of an inch; 50 is about 2 inches.) Moreover, years in which rain came mainly as mere drizzle actually damaged yields.


The researchers outlined several possible reasons for the differences. For one, drizzle may be too inefficient to do much good. In hot weather, it can mostly evaporate back into the air before reaching subsurface root zones where it is needed; in cooler weather, it might remain on leaves long enough to encourage the growth of damaging fungi. "There are only a fixed number of hours of rain you can get in a season," said Lesk. "If too much of them are taken up by useless drizzle, it's wasted."

Heavier storms on the other hand, are better-at least up to a point. These allow water to soak thoroughly into the soil, carrying in both moisture and artificial fertilizer spread on the surface. It is only the most extreme events that hurt crops, say the researchers: these can batter plants directly, wash fertilizer off fields, and saturate soils so thoroughly that roots cannot get enough oxygen.

To study the effects of future potential rainfall patterns, the researchers used basic physical models to estimate how much heavier rains might become under different levels of warming. They found that in most cases, more rain would, as expected, come in bigger downpours-but these heavier rains would fall within the fairly wide range where they are beneficial. The most extreme, damaging rains would also increase-but would still be rare enough that the greater number of beneficial rainfalls would outweigh their effects.

Because the study averaged out statistics over vast areas, and many other factors can affect crop yields, it would be hard to say exactly what the effects of future rainfall will be in any one area, said Lesk. "No single farmer would use a study like this to make decisions on what to plant or how," he said. But, as the paper concludes, the results "suggest that beyond extreme events, the crop yield response to more common rainfall intensities merits further attention."


Explore further

More information: Lesk, C., Coffel, E. & Horton, R. Net benefits to US soy and maize yields from intensifying hourly rainfall. Nat. Clim. Chang. (2020). doi.org/10.1038/s41558-020-0830-0
Journal information: Nature Climate Change


Provided by Earth Institute at Columbia University


Decline in plant breeding programs could impact food security
by Scott Weybright, Washington State University
A team of scientists led by Kate Evans, a Washington State University horticulture professor who leads WSU's pome fruit (apples and pears) breeding program, found that public plant breeding programs are seeing decreases in funding and personnel. Credit: WSU

Public plant breeding programs are declining across the United States.


A team of scientists led by Kate Evans, a Washington State University horticulture professor who leads WSU's pome fruit (apples and pears) breeding program, found that public plant breeding programs are seeing decreases in funding and personnel.

The study was published in the journal Crop Science.

Evans and her colleagues conducted a survey of 278 plant breeding programs around the country. Public programs are chiefly federal programs, like those run by the U.S. Department of Agriculture, or based at public research universities.

In the surveys, respondents estimated a 21.4% decline in full time employee (FTE) time for program leaders over the past five years and an estimated 17.7% decline in FTE time for technical support personnel.

The researchers also found that retirement looms for a significant number of plant breeding program leaders. Over a third of the responding programs reported having leaders over the age of 60 and 62% are led by people over 50.

This decline is concerning because plant breeding has a direct impact on food security, Evans said.

"Plant breeding plays a fundamental part of the long-term food security of this country," Evans said. "The tremendous increases in food production over the past century are largely due to plant breeding, and the world's population is only increasing."

The focus on food security has received more attention in the last few months, as the COVID-19 pandemic has moved around the world, she said.

"Plant breeding is a long-term, sustainable way to address concerns over having enough food and keeping our food sources secure," said Evans, who is based at WSU's Tree Fruit Research & Extension Center in Wenatchee.

Plant breeding takes on many forms, from breeding disease tolerance, increasing production, introducing new delicious varieties, or improving drought tolerance.

"It could be a disease, a pest, climate change, any number of things," Evans said. "We do not live in a stable environment, and there are many different ways to deal with that."

Plant pathogens, like bacteria, and pests are always adapting, so varieties of crops that were bred to naturally fight off a disease start to lose their defenses. Plant breeding programs help growers stay ahead of those potentially harmful adaptations.

Another impact of declining breeding programs is losing those with a local focus.

"In Washington, for example, our cereal breeding programs are very focused on local production," Evans said. "They breed wheat that grows very well for eastern Washington."

Another example is the citrus industry. Citrus greening disease has been devastating to growers, particularly in Florida, when trees produce bitter, green, and misshapen fruit. Plant breeding programs are working hard to develop varieties that naturally repel the pest that causes the problems.

One reason that plant breeding programs are declining is expense. It takes many years to develop a new variety of a crop, Evans said. And funding a program for that long requires significant investment.

"We can't rely on grants because those are often only for a few years," she said. "You can't do anything in plant breeding in three years, it requires long-term sustained funding to get a program going."


Explore furtherNew software supports decision-making for animal and plant breeders

More information: Michael T. Coe et al, Plant Breeding Capacity in U.S. Public Institutions, Crop Science (2020). DOI: 10.1002/csc2.20227

Seeing chemical reactions with music


by Institute for Basic Science
(Top) Sound-controlled spatiotemporal patterns. Schematic representation of experimental setup used for sound-controlled spatiotemporal pattern generation. For pattern generation experiments, O2-sensitive methyl viologen (MV2+/MV+* ) redox couple (left) or CO2-sensitive pH indicator bromothymol blue (BTB) is used. (Middle) Patterns generated in different conditions. Patterns generated in Petri dishes on application of 40 Hz (left) and 80 Hz (middle) sound. A pattern generated with a square porcelain dish at 40 Hz (right). (Bottom) Sound-controlled pH-specific domains and spatiotemporal patterns. Time-dependent changes during pattern generation with a pH indicator (BTB) placed in a CO2-exposed Petri dish in the presence of 40 Hz sound. Coexistence of pH-specific spatiotemporal domains in a BTB pattern (middle). Credit: IBS

Albert Einstein once said, "I see my life in terms of music." Perhaps inspired by his words, scientists at the Center for Self-assembly and Complexity (CSC), within the Institute for Basic Science (IBS, South Korea) now see chemical reactions in the presence of music. The IBS research team has reported that audible sound can control chemical reactions in solution by continuously supplying energy sources into the interface between air and the solution. The sound-controlled air-liquid chemical interactions 'painted' intriguing and aesthetic patterns on the surface and bulk of the solution.


"The Pied Piper of Hamelin tells the mythological story of a pied piper who lured rats away from the city of Hamelin by enchanting them with the music from his magical pipe. With music working like a fuel for such artistic control in chemistry, our study has shown that even synthetic molecules can exhibit life-like behavior—listening and following a musical track," says Dr. Rahul Dev Mukhopadhyay, the co-first and -corresponding author of the study.

Music (or audible sound with a frequency range of 20 to 20,000 Hz) in fact finds useful applications in various fields, such as boosting plant cultivation or livestock breeding and even for therapeutic purposes. Ultrasound (greater than 20,000 Hz) has long been used as an essential tool in medical diagnosis. However, audible sound has rarely been associated with chemical reactions due to its low energy. Previous studies have usually focused only on its effect on the movement of water surface.

In this study, the IBS research team has gone further than that. They hypothesized that sound-generated water waves may fuel chemical reactions between air and liquid. "In fact, one aspect of a climate change study is about how CO2 concentration in the ocean changes depending on the movement of ocean waves. In retrospect, it makes sense that a wavy ocean is a more suitable condition for CO2 to be absorbed in the ocean than a still ocean. Our study has revealed the function of audible sound as a source for controlling chemical reactions, which occurs all around us, but has not been noticed till now," explains Dr. Hwang Ilha, the co-first and -corresponding author of the study.

PlayPattern generation with methyl viologen redox couple at 40 Hz. The video is played 20 times faster than real time. Credit: IBS

In their experimental set-up, the water was placed on a Petri dish and positioned on top of a speaker. When sound was played through the speaker, different surface wave patterns were generated—depending on the frequency and the amplitude of the audible sound source and the geometry of the vessel. To see how this vibrating air-water interphase controls the dissolution of atmospheric gases like oxygen or carbon dioxide into water, the researchers used O2-sensitive methyl viologen (MV2+/MV+ ) redox couple and CO2-sensitive pH indicator bromothymol blue (BTB).


Organic molecule methyl viologen is normally colorless or white, but turns deep blue upon chemical reduction. When a blue-colored solution of reduced methyl viologen in a Petri dish was exposed to air with sound playing, some regions of the solution slowly turned colorless. The sound waves generates oscillation of the fluid, prompting a streaming effect, and the solution underwent a distinct observable color change due to the gradual dissolution of atmospheric oxygen. Those not affected by the streaming retained their blue color. In the absence of sound, the uncontrolled dissolution of oxygen and natural convection currents of chemicals in solution resulted in a random pattern, which was different each time over the repetition of the same experiment. However, when the same solution was exposed to low frequency sounds below 90 Hz, very interesting and aesthetic patterns were generated. More specifically, two counter-rotating vortices emerged in blue and white contrast in the presence of 40 Hz sound. The same pattern repeated in the same condition during subsequent cycles.

The experiment indicates the reaction with oxygen, which is determined whether the solution is colorless or blue. In other words, by applying sound to a solution, the researchers could control the local molecular concentrations of oxygen in different regions that compose the same solution. Just like the surface waves, the patterns vary according to the frequency of the applied sound as well as the shape of the dish. The patterns also exhibited self-healing behavior, i.e., they recover their original pattern structure after being manually disturbed.

This concept was further extended to the dissolution of carbon dioxide gas using a pH indicator (bromothymol blue, BTB). BTB has a blue color in basic conditions (pH over 7.6), green color in neutral conditions (pH 6.0 to 7.6), and a yellow color in acidic conditions (pH under 6.0). Sound assisted dissolution of carbon dioxide in water turns it acidic due to the formation of carbonic acid. Therefore, when a blue-colored basic solution of BTB is exposed to carbon dioxide, the solution gradually turns green and eventually changes to yellow. During this process, if the solution is exposed to audible sound, a three-colored pattern having two vortices was generated. Interestingly, the pattern represents the coexistence of acidic, neutral, and basic domains in a solution. "Our study visualized a chemical environment that is partitioned into different molecular environments without any physical barrier, resembling cellular microenvironments. This is a novel discovery that may replace the common sense belief that the pH of a solution is uniform throughout all of the vessel," notes Dr. Hwang.

Extending the concept beyond simple molecules, the researchers utilized their strategy to program the organization of organic molecules within solution. In all cases, the sound generated organic aggregate patterns were obtained transiently and maintained only in presence of a steady supply of chemical fuel, which may be either a reducing agent or a base. This type of behavior is generally exhibited by intracellular biochemical processes which are maintained with a steady supply of fuels or energy currencies, such as adenosine-5'-triphosphate (ATP) or guanosine-5'-triphosphate (GTP).

Prof. Kimoon Kim, Director of the IBS Center for Self-assembly and Complexity, who supervised the overall research, added, "This is the first study to show that it is possible to control and visualize chemical reactions using audible sound. In the near future, we may further expand the scope of use of audible sound from chemistry to other fields, such as physics, fluid mechanics, chemical engineering and biology."


Explore further Nanofibers align to the sound of Beethoven and Mozart

More information: lha Hwang et al. Audible sound-controlled spatiotemporal patterns in out-of-equilibrium systems. Nature Chemistry, DOI: 10.1038/s41557-020-0516-2

Journal information: Nature Chemistry


Provided by Institute for Basic Science

July 2020 set heat records for many U.S. states


by John Bateman, NOAA Headquarters
Credit: NOAA Headquarters

It was an unusually steamy month for the country—even for July. Some states recorded their hottest July ever as others tied with previous years.


The month's precipitation was also higher than average and ranked in the wettest third of the 126-year period of record, according to scientists from NOAA's National Centers for Environmental Information.

Not to be outdone, tropical activity in the Atlantic revved up, producing three tropical storms and two hurricanes in just July alone. They were the earliest fifth, sixth, seventh, eighth and ninth named storms on record in the Atlantic Basin.

Here's a climate snapshot of the month of July and the year to date:

Climate by the numbers

July 2020

The average temperature last month across the contiguous U.S. was 75.7 degrees F (2.1 degrees above average), making July the 11th-warmest in the 126-year record.

Seven states—Connecticut (tie), Delaware, Maryland, New Hampshire, New Jersey, Pennsylvania (tie), and Virginia (tie)—reported their hottest July on record. Fourteen more states across the South and East reported a top-10 hottest July.

The average precipitation for July was 2.93 inches (0.15 of an inch above average), which ranked in the wettest third of the record. Above-average precipitation fell across much of the northern and central Plains, as well as the Great Lakes, Mississippi Valley and Gulf Coast.

Year to date/January through July 2020

The year-to-date (YTD) average temperature for the contiguous U.S. was 53.6 degrees F, which is 2.4 degrees above the 20th-century average and the seventh warmest YTD on record.

In keeping with the warm trend noted in June's report, Florida saw its hottest YTD on record by July's end.

Precipitation was plentiful across the U.S. with a total of 19.29 inches—1.20 inches above average. The YTD ranked in the wettest third of the 126-year record, with both Tennessee and West Virginia marking their fifth-wettest.

More notable climate events
H
anna hit Texas: The first hurricane of the season, Hurricane Hanna, struck Padre Island, Texas, on July 25, causing significant damage. Hanna was the earliest named "H storm" on record to form in the Atlantic.

Alaska was cool, with a few hot spots: The state had its coolest July since 2014, with an average temperature of 53.3 degrees F. Meanwhile, Kodiak had its third-warmest July since 1915, and Sitka Airport tied its all-time high temperature of 88 degrees on July 31.

Drought intensified across the U.S.: Approximately 33% of the contiguous U.S. was in drought by the end of July, up 7% from June, according to the U.S. Drought Monitor report. Drought expanded or intensified across parts of the parts of the West, South, central Plains, central Rockies, Great Lakes, Ohio Valley and Northeast.


Explore further July warmer than average, year to date 3rd warmest for Lower 48
More information: Assessing the U.S. Climate in July 2020. www.ncei.noaa.gov/news/national-climate-202007

Indonesia's Mt. Sinabung blasts tower of smoke and ash into sky


Indonesia's Mount Sinabung erupted Monday, belching a massive column of ash and smoke 5,000 metres (16,400 feet) into the air and plunging local communities into darkness with a thick layer of debris.


The volcano on Sumatra island has been rumbling since 2010 and saw a deadly eruption in 2016.

Activity had picked up in recent days, including a pair of smaller eruptions at the weekend.

There were no reports of injuries or deaths from Monday morning's blast, but authorities warned of possible lava flows and more eruptions.

"This is an alert for all of us to avoid red-zone areas near Sinabung," said Armen Putera, a local official with Indonesia's Volcanology and Geological Hazard Mitigation Centre.

However, the crater's alert status remained at its second-highest level.

No one lives inside a previously announced no-go zone around the volcano.

Small communities nearby were coated in a layer of thick ash as at least one village went from day to night in a matter of minutes.

"It was like magic—when the ash came it went from being very bright to dark as night," said Rencana Sitepu, the head of Namanteran village, adding that some of the community's crops were destroyed by the fallout.

"The village went dark for about 20 minutes."
Mount Sinabung emits ash and smoke into the air

The coronavirus pandemic complicated matters as scared residents violated safety rules.

"Locals were gathering after the eruption without using face masks because they were all panicking," said local disaster agency chief Natanael Perangin-angin.

Sinabung had roared back to life in 2010 for the first time in 400 years. After another period of inactivity, it erupted once more in 2013, and has remained highly active since.

In 2016, seven people died in one of the eruptions, while another in 2014 killed 16.


In late 2018, a volcano in the strait between Java and Sumatra islands erupted, causing an underwater landslide and tsunami which killed more than 400 people.


Indonesia is home to about 130 active volcanoes due to its position on the "Ring of Fire", a belt of tectonic plate boundaries circling the Pacific Ocean where frequent seismic activity occurs.

Explore further Indonesia's Mt. Sinabung shoots column of smoke and ash into sky

© 2020 AFP