Monday, October 05, 2020

Scientist maps carbon dioxide emissions for entire US to improve environmental policy-making
by Northern Arizona University
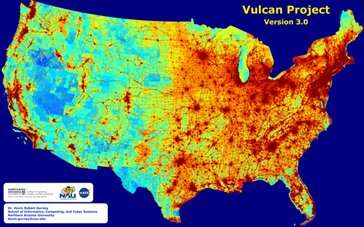
Emissions map of entire U.S. landscape at high space- and time-resolution with details on economic sector, fuel and combustion process. Credit: Northern Arizona University

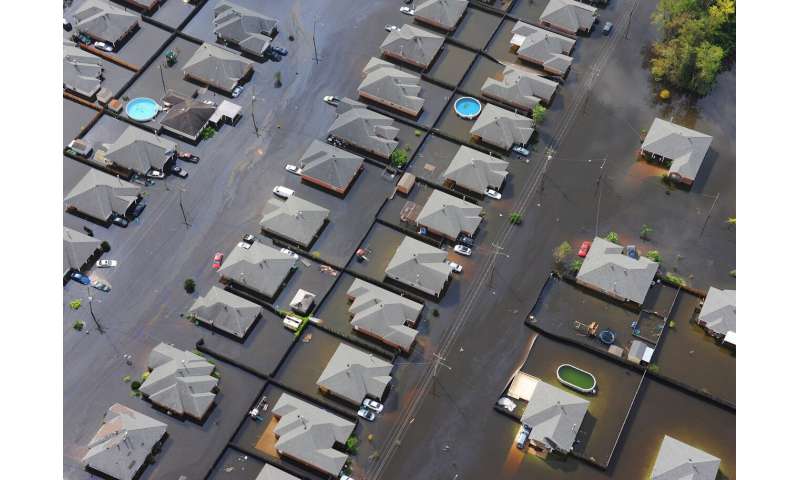
With intense wildfires in the western U.S. and frequent, intense hurricanes in the Gulf of Mexico, the nation is again affected by extreme weather-related events resulting from climate change. In response, cities, states and regions across the country are developing policies to reduce their emissions of greenhouse gases, chiefly carbon dioxide (CO2). Even though many state and local governments are committed to these goals, however, the emissions data they have to work with is often too general and too expensive to provide a useful baseline and target the most effective policy.


Professor Kevin Gurney of Northern Arizona University's School of Informatics, Computing, and Cyber Systems today published results in the Journal of Geophysical Research detailing greenhouse gas emissions across the entire U.S. landscape at high space- and time-resolution with details on economic sector, fuel and combustion process.

Gurney, who specializes in atmospheric science, ecology and public policy, has spent the past several years developing a standardized system, as part of the Vulcan Project, that quantifies and visualizes greenhouse gases emitted across the entire country down to individual power plants, neighborhoods and roadways, identifying problem areas and enabling better decisions about where to cut emissions most effectively. Leading up to the nationwide study, Gurney produced emissions maps of several different large cities, including the Los Angeles megacity, Indianapolis, the Washington, D.C./Baltimore metropolitan area and Salt Lake City.

Funded by NASA, Gurney developed the high-resolution emissions map as an effective tool for scientific and policy applications. His goal is to provide policymakers across the nation with a means to strategically address problem areas instead of taking an inefficient, costly approach.

"We're providing U.S. policymakers at national, state and local scales with a scalpel instead of a hammer. Policies that might be relevant to California are possibly less relevant for Chicago or New York. They need to have information that reflects their unique conditions but follows a rigorous, standardized scientific approach. In this way, they can have confidence in the numbers which, in turn, will stimulate smart investment in reducing emissions."

One of the strengths of Gurney's approach is validation by atmospheric monitoring of CO2 from ground-based and satellite instruments.

"By synthesizing the detail of building and road-scale emissions with the independence and accuracy of atmospheric monitoring," Gurney said, "we have the best possible estimate of emissions with the most policy-relevant detail."

Through characterization of CO2 emissions across the entire US landscape every kilometer, from coast to coast, Gurney points out that the system offers every US city an inventory on emissions. "By extracting all cities in the US from our data product, we can offer every city a consistent and comprehensive assessment of their emissions. Like the US weather forecasting system, this problem is best solved with a single systemic approach and shared with city stakeholders so they can do what they know how to do better than anyone—reduce emissions in ways that meet their individual needs," Gurney said.


Explore further

More information: Kevin R. Gurney et al, The Vulcan Version 3.0 High‐Resolution Fossil Fuel CO2 Emissions for the United States, Journal of Geophysical Research: Atmospheres (2020). DOI: 10.1029/2020JD032974
There's a giant 'Green Banana' off Florida's coast, and researchers have finally gotten to the bottom of it

by Chris Perkins, Sun Sentinel
  
Credit: CC0 Public Domain

If you haven't heard of the "Green Banana blue hole" you might imagine a tropical cocktail you can order in Key West, or a dessert you ordered after a night on Bourbon Street.

Forget that. This Green Banana is actually a mysterious sink hole. More specifically, it's a huge, underwater cavern off the coast of Florida that humans had never fully explored—until last month.

Scientists say the Green Banana could hold clues to the formation of toxic red tides, algae blooms that are devastating to Florida's shoreline, and the extent of the aquifer that supplies the state with most of its drinking water.

Maybe even the origins of life.

Blue holes—sink holes that form under water—are not unusual in the Gulf of Mexico. In the mid-1970s, a boat captain sailing about 60 miles west of Sarasota spotted one about 160 feet under water, and an unripe banana peel floating above it. It became known as the Green Banana.

Scientists believe it may have formed more than 10,000 years ago when a sink hole opened to form a cavern 265 feet deep and 425 feet below the surface of the Gulf, further than typical scuba divers are capable of reaching.

It's not just the depth of the Green Banana that's a challenge for explorers. It's wide base created by an hourglass shape had never been fully explored until advanced diver Marty Watson did it in August with a team of scientists and researchers.

"What's it like?" Watson asked. "I'm not an astronaut, but it's got to be the closest thing in the world next to it."

Blue holes are thought to be ecological hot spots whose nutrients help supply the food chain around the world. It starts with the phytoplankton that feed on those nutrients, which attracts fish that feed on phytoplankton, which attracts bigger fish that feed on those fish, and so on.

Marine life including sharks, sea turtles, corals, sponges and schools of fish have been spotted near blue holes.

Before Watson's dive, no research team had the capability or technology to fully explore the mysterious Green Banana, unlike blue holes in China or Mexico.

But researchers from Florida Atlantic University's Harbor Branch Oceanographic Institute joined a team from Georgia Tech, the Mote Marine Laboratory and Aquarium, the U.S. Geological Society and NOAA's Office of Ocean Exploration and Research to explore the Green Banana.


"It's advantageous to have something like this in our own backyard where you can study all the crazy organisms and potentially learn about life early on earth, or life on other planets," said FAU professor Dr. Jordon Beckler.

The team used technical divers and a benthic lander, a 600-pound submersible that houses multiple scientific instruments, to explore Green Banana's lower ring.

Researchers explored another blue hole near Green Banana, named Amberjack, last year. The sulfide-rich water at the bottom of Amberjack was dominated by archaea microbes, part of the organisms of all life on Earth.

Scientists say it's unusual to have one species dominating an underwater area.

"It suggests to us that there's something very special and unique about this microbe that is letting it really thrive in this low-oxygen, high-sulfide bottom water of Amberjack hole," said Dr. Nastassia Patin, who works for the National Oceanic and Atmospheric Administration and was involved in the Amberjack project when she was on the team at Georgia Tech.

Amberjack was fascinating, to say the least.

"Amberjack is very large system," said Watson, who also dove to the bottom of that 350-foot deep blue hole. "I would say that at the bottom it's as big as a football stadium, or close."

Scientists want to know if there's something special about the sediment at the rim of Green Banana, and one thing they want to know is whether the organisms that feed on the sulfide release nutrients that fertilize red tide or other algae. Analysis of Green Banana's water and sediment samples won't be complete for weeks.

"For me, I'm a geochemist," Beckler said, "and we are trying to understand how water and rocks interact, and how the oceans on earth and the atmosphere all sort of evolved over the last four to six billion years. And when you have these crazy microenvironments like the blue holes, where it's not just fully oxygenated like the rest of the ocean, it also serves as a potential proxy for what the earth looked like back in the day."

Researchers hope to launch a second trip to the bottom of the Green Banana next May.


Explore further
Mysterious 450-foot 'blue hole' off Florida has researchers looking for signs of life

©2020 Sun Sentinel (Fort Lauderdale, Fla.)
Distributed by Tribune Content Agency, LLC.
147 shares

Beirut explosion was one of the largest non-nuclear blasts in history, new analysis shows

by University of Sheffield
Engineers used footage from 16 videos on social media to estimate the yield of the 2020 Beirut explosion. Credit: Shock Waves

The explosion in the Port of Beirut was one of the biggest non-nuclear blasts in history—releasing enough energy in a matter of milliseconds to power more than 100 homes for a year—according to a new assessment of the disaster by engineers from the University of Sheffield.

Researchers behind the study, from the University's Blast and Impact Engineering Research Group, hope that the new assessment can be used to provide policymakers and the public with more accurate information on the blast, as well as to help first responders prepare for future disasters and save lives.

After analyzing videos of the explosion posted on social media, the team of researchers has been able to estimate the power of the blast by tracking how the explosion's shockwave spread through the city.

The new assessment by the Sheffield engineers, which is published in the journal Shock Waves, found that the size of the explosion was the equivalent of between 500-1100 tons of TNT—around 1/20th of the size of the atomic bomb that was used on Hiroshima on 6 August 1945 and is one of the largest non-nuclear explosions ever recorded.

The explosion also released—in a matter of milliseconds—the equivalent of around 1GWh of energy. This is equal to the hourly energy generated by three million solar panels or 400 wind turbines.


The engineers hope that by releasing a more accurate assessment of the blast, including an insight into how the shockwave traveled, it could be used to help with future disaster response planning. The data could be used by first responders to help predict the likely injuries and structural damage at various distances from a blast in future emergency situations.

Dr. Sam Rigby, senior lecturer in blast and impact engineering at the University of Sheffield, said: "The disaster that hit Beirut this summer was devastating and we hope that nothing like that ever happens again. This was an unprecedented event because never before has such a large explosion been so well documented. The reason why we decided to analyze the explosion is because as engineers it's our jobs to use the skills and resources we have at our disposal to solve problems and ultimately to help people. After seeing the events unfold, we wanted to use our expertise in blast engineering to help understand what had happened in Beirut and provide data that could be used to help prepare for, and save lives in such events should they ever happen again. By understanding more about the power of large scale accidental explosions like the one that occurred in Beirut, we can develop more accurate predictions of how different buildings will be affected, and the types of injuries there are likely to be at different distances from the blast."

The new analysis—"Preliminary yield estimation of the 2020 Beirut explosion using video footage from social media"—is published in Shock Waves.


Explore further NASA maps Beirut blast damage


More information: S. E. Rigby et al. Preliminary yield estimation of the 2020 Beirut explosion using video footage from social media, Shock Waves (2020). 
Researchers probe memory of the Venus flytrap

by National Institutes of Natural Sciences
Sensory hairs of the Venus flytrap (Dionaea muscipula). Credit: NIBB

The carnivorous plant Venus flytrap (Dionaea muscipula) captures and digests small animals and absorbs nutrients with its characteristic insectivorous leaves. Six sensory hairs on the inner surface of each leaf sense a visiting prey and cause the trap to close. A single contact event with a sensory hair is not sufficient, but a second contact within 30 seconds will induce the trap to close quickly and ensnare the unlucky prey. Thus, Venus flytraps store the memory of the first stimulus for about 30 seconds. But how does a plant memorize anything when it has no brain or nervous system?


In 1988, Dr. Dieter Hodick and Dr. Andreas Sievers from the Botanical Institute at the University of Bonn, Germany speculated that changes in calcium ions might be involved in the memory of the Venus flytrap. However, lacking the technological means to measure calcium concentrations without damaging the cells, they were unable to explore this possibility.

Now, in a study to be published in Nature Plants, a graduate student Mr. Hiraku Suda and Professor Mitsuyasu Hasebe of the National Institute for Basic Biology (NIBB) in Okazaki, Japan, together with their colleagues, have succeeded in visualizing intracellular calcium concentrations in the Venus flytrap and have demonstrated that its short-term memory can indeed be explained by changes in calcium concentration.

The research team first established a genetic transformation method for the Venus flytrap. They then introduced the gene encoding the intracellular calcium sensor protein GCaMP6, which emits green fluorescence when bound to calcium, into the insectivorous plant, allowing them to visualize changes in intracellular calcium concentrations for the first time.

Play VIDEO 
Visualization of the changes in intracellular calcium concentration of the Venus flytrap, using the fluorescent GCaMP6 calcium sensor, following stimulation with a needle. Credit: NIBB

Mr. Hiraku Suda, the first author of the article says, "I tried so many experiments over two and a half years but all failed. The Venus flytrap was such an attractive system that I did not give up. I finally noticed that foreign DNA integrated with high efficiency into the Venus flytrap grown in the dark. It was a small but indispensable clue."

Using these transgenic Venus flytrap plants, the research team stimulated a single sensory hair with a needle and measured the changes in calcium levels within the leaf in detail.

Whereas the first stimulation increased the intracellular calcium concentration in the leaf blade, the second stimulus further raised the calcium ion concentration. These results revealed that the trap only closes when the intracellular calcium concentration exceeds a certain threshold.
Visualization of the changes in intracellular calcium concentration of the Venus flytrap, using the fluorescent GCaMP6 calcium sensor, following stimulation with a needle. Credit: NIBB

In addition, it became clear that the intracellular calcium concentration decreased with the passage of time after the initial burst brought upon by the first stimulation. If the interval between the first and second stimuli sensed by sensory hairs exceeded about 30 seconds, the trap would not close, as the intracellular calcium concentration did not exceed the signaling threshold, despite the administration of two stimuli. Therefore, the memory of the Venus flytrap can be assigned to changes in intracellular calcium concentrations.

"This is the first step towards revealing the evolution of plant movement and carnivory, as well as the underlying mechanisms. Many plants and animals have interesting but unexplored biological peculiarities. The Center for the Development of New Model Organisms at NIBB is gathering the technical know-how to study such marvelous organisms," said Professor and Vice-Director General Mitsuyasu Hasebe from NIBB, who led the research team.


Explore further
Biomechanical analyses and computer simulations reveal the Venus flytrap snapping mechanisms
More information: Calcium dynamics during trap closure visualized in transgenic Venus flytrap, Nature Plants (2020). DOI: 10.1038/s41477-020-00773-1

Journal information: Nature Plants

Provided by National Institutes of Natural Sciences
Dust dampens albedo effect, spurs snowmelt in the heights of the Himalayas

by Pacific Northwest National Laboratory
Credit: CC0 Public Domain

Dust blowing onto high mountains in the western Himalayas is a bigger factor than previously thought in hastening the melting of snow there, researchers show in a study published Oct. 5 in Nature Climate Change.


That's because dust—lots of it in the Himalayas—absorbs sunlight, heating the snow that surrounds it.

"It turns out that dust blowing hundreds of miles from parts of Africa and Asia and landing at very high elevations has a broad impact on the snow cycle in a region that is home to one of the largest masses of snow and ice on Earth," said Yun Qian, atmospheric scientist at the U.S. Department of Energy's Pacific Northwest National Laboratory.

Qian and Chandan Sarangi, formerly a postdoctoral associate at PNNL and now at the Indian Institute of Technology Madras in India, are corresponding authors of the study.

More than 700 million people in southeast Asia, as well as parts of China and India, depend on melting snow in the Himalayas for much of their freshwater needs in summer and early fall, driving the urgency of scientists ferreting out the factors that influence earlier snowmelt in the region.

In a study funded by NASA, scientists analyzed some of the most detailed satellite images ever taken of the Himalayas to measure aerosols, elevation, and surface characteristics such as the presence of dust or pollution on snow.

Of dust, soot, sun and snow: The albedo effect

Dark objects on or in snow absorb sunlight more effectively than pure white snow, whose reflectivity fends off sunlight so forcefully that snow can be blinding on a bright, sunny day. But snow near an object that absorbs sunlight—like snow on a dark-colored car where some of the roof is exposed—heats up and melts faster than pristine snow.

Scientists use the word "albedo" to discuss how well a surface reflects sunlight. Dirty snow has a low albedo, while pure snow has a high albedo. Dust and soot lower snow's albedo, causing the snow to absorb more light, heating up and melting snow faster.

The albedo effect at high elevations is crucial to life for millions of people who rely on snowmelt for their drinking water. Darker, dirtier snow melts faster than pure snow, changing the timing and amount of snowmelt and affecting agriculture and other aspects of life.

Play
VIDEO
 Dust has a lot of clout in the western Himalayas, absorbing sunlight and melting snow, according to new findings published in Nature Climate Change. The process plays an important role in the timing of snowmelt in the region, where more than 700 million people depend on melting snow in the Himalayas for much of their freshwater needs in summer and early fall. Credit: Graham Bourque | PNNL

The powerful effect of dirty snow


The team found that dust plays a much larger role melting snow than soot and other forms of pollution, known as black carbon, at elevations above 4,500 meters. Below that, black carbon dominates.

It's a surprise for scientists, who note that far more studies have explored the role of black carbon than dust in snowmelt.

The dust blows into the western Himalayas from the west—from the Thar Desert in northwestern India, from Saudi Arabia and even from the Sahara in Africa. The dust comes in winds thousands of feet high, at what scientists call elevated aerosol layers.

While desert dust is natural, the scientists say that its prevalence in the Himalayas is not without human influence. Increasing temperatures have changed atmospheric circulation, affecting the winds that can carry dust hundreds or thousands of miles. Changing land-use patterns and increasing development have reduced vegetation, liberating dust that otherwise would have been tied to the land.

Qian was one of the first scientists to develop sophisticated modeling tools to analyze how impurities like dust and soot affect the rate at which snow melts. He did that early work more than a decade ago in the mountains of the U.S. West.

"It's likely that these results translate to other high mountain chains, including the Rockies, Sierras and Cascades in North America and several mountain chains in Asia, such as the Caucuses and Urals," Qian said.

Much of the data for the study comes from satellite images obtained by multiple NASA instruments, including NASA's Cloud-Aerosol Lidar and Infrared Pathfinder Satellite Observations (CALIPSO), OMI (Ozone Monitoring Instrument), and MODIS (Moderate Resolution Imaging Spectroradiometer). These instruments can detect dust and other aerosols in the atmosphere, and measure snow coverage and albedo, from hundreds of miles above Earth. Equipped with data from these and other sources, the PNNL team did extensive computer modeling of the processes at work.

Dust with staying power

Dust particles usually stay in snow longer than black carbon, the scientists noted. Dust is usually a little bit bigger; it's not as easily blown off the snow and it doesn't fall through snow as easily. There's also a lot more of it.

"The snow in the western Himalayas is receding rapidly. We need to understand why this is happening, and we need to understand the implications," said Sarangi. "We've shown that dust can be a big contributor to the accelerated snowmelt. Hundreds of millions of people in the region rely on snow for their drinking water—we need to consider factors like dust seriously to understand what's happening."

Qian notes that as the climate warms and snow lines move higher, scientists expect the role of dust to become even more pronounced in the Himalayas—a region that, aside from the Arctic and Antarctic regions, contains the biggest mass of snow and ice on the planet.

Explore further Snow in the Andes as clean as Canadian Arctic: study

More information: Dust dominates high-altitude snow darkening and melt over high-mountain Asia, Nature Climate Change (2020). 
Study shows that African herbivores that eat mixed diets or migrate have more stable populations

  
A herd of impala, Kruger National Park, South Africa. Credit: Carla Staver

A pair of researchers, one with Yale University, the other the University of the Witwatersrand, reports that African herbivores that eat mixed diets or migrate have more stable populations than do those who eat just one food and do not migrate. In their paper published in the journal Science Advances, A. Carla Staver and Gareth Hempson describe two theories to predict population stability for African herbivores, how they tested their theories, and what they found.

As the researchers note, African savannas host the world's largest megafaunal communities, but as they also note, populations of most of the endemic species are in decline due to a host of factors including diseases, drought and human encroachment. And while these factors have been extensively studied, one that has not is animals' diets. In the savannah, there is more to eat than just grass: there are also small trees and shrubs, and some animals diversify their diet by eating from more than one source. In this new effort, Staver and Hempson theorized that those animals with more diverse diets likely had more stable populations than those that did not. They also suspected that another factor might be in play: whether animals moved to new locations to find food, a form of migration.

To test their theories, the researchers obtained and analyzed herbivore population data from 18 preserves across the African continent. They compared those animals that fed on just one type of plant to those with a more varied diet. They found that animals that fed on both grasses and shrubs, such as the impala, maintained population levels better than animals such as buffalos, which fed only on grass. They also found that animals such as the wildebeest that travel to find new food sources also maintained their populations better than did those that did not migrate and fed on a single food source. The researchers also found that body size did not appear to play a role in helping to preserve population levels. They suggest that diet be included as a population stability factor by animal management teams.

This is a talk Carla Staver gave at the annual meeting of the Ecological Society of America in August about this work. Credit: Carla Staver as presenter (with Gareth Hempson as a co-author on the talk)


Explore further

More information: A. Carla Staver et al. Seasonal dietary changes increase the abundances of savanna herbivore species, Science Advances (2020).

Journal information: Science Advances

© 2020 Science X Network

As atmospheric carbon rises, so do rivers, adding to flooding

by Kristin Strommer, University of Oregon
Credit: CC0 Public Domain

When it comes to climate change, relationships are everything. That's a key takeaway of a new UO study that examines the interaction between plants, atmospheric carbon dioxide and rising water levels in the Mississippi River.

Published recently in the Geological Society of America's journal GSA Today, the study compared historical atmospheric carbon data against observations of herbarium leaf specimens to quantify the relationship between rising carbon levels and increasingly catastrophic floods in the American Midwest.

Using data covering more than two centuries, researchers demonstrated that as carbon levels in the atmosphere have risen due to the burning of fossil fuels, the ability of plants to absorb water from the air has decreased. That means more rainfall makes its way into rivers and streams, adding to their potential for damaging floods.

Co-authored by UO Museum of Natural and Cultural History geologist Greg Retallack and earth sciences graduate student Gisele Conde, the study focused on Ginkgo biloba leaf specimens representing a time span of just over 260 years.

The team examined the leaves' stomata, tiny pores that deciduous plants use to take up carbon dioxide from the atmosphere. In low-carbon environments, plants increase the density of stomata so they can take in enough carbon dioxide for photosynthesis, but they need relatively few stomata in carbon-rich environments.

"Variations in stomatal density, which we observed using microscopic imaging, reflect corresponding changes in atmospheric carbon over the 264-year span," said Retallack, director of the museum's Condon Fossil Collection and a professor of earth sciences.

Stomatal density also governs the degree of transpiration, the process by which plants absorb water and give off water vapor; the fewer the stomata, the lower the transpiration potential. In the leaf specimens under examination, the researchers observed an overall decline in stomatal density and transpiration potential over the 260-year timespan, with a 29 percent reduction from 1829 to 2015.

The authors note that the reduction has directly contributed to the devastating floods that increasingly plague the Midwest, since less transpiration means more water running off into streams and rivers, and in turn, greater flooding risk.

"The devastation of individual floods is still related to that year's weather, but the steady rise of carbon levels is driving the average level of the Mississippi River up by a stunning 2 centimeters per year," Retallack said.

The study also points to a need for revised planning efforts and insurance concepts in the region.

"Rising carbon levels aren't always considered in flood prediction and risk analyses," Retallack said. "We hope the study will help clarify the danger that climate change and attendant flooding pose to agricultural communities around the Mississippi River, and help inform new insurance and zoning policies there."

Explore further
The revolt of the plants: The arctic melts when plants stop breathing
More information: Gregory Retallack et al. Flooding Induced by Rising Atmospheric Carbon Dioxide, GSA Today (2020). DOI: 10.1130/GSATG427A.1
Invasional meltdown in multi-species plant communities

by University of Konstanz
  
Plant pots with plants used during the experiment. Credit: Zhijie Zhang

Invasive alien plant species can pose a serious threat to native biodiversity and to human well-being. Identifying the factors that contribute to invasion success is therefore crucial. Previous studies on biological invasions have focused mainly on interactions between one alien and one native species, attributing invasion success to the superior competitive ability of the invading aliens. Very few experiments have examined them in multi-species plant communities.


A new experiment by ecologists based at the University of Konstanz and international collaborators addresses this research gap by considering competition among plants in communities composed of several plant species, both alien and native. The results, which appear in the latest issue of Nature Ecology and Evolution, pinpoint one major reason for invasion success and subsequent invasional meltdown to soil microbes, especially fungal endophytes.

Soil microbes a major driver of invasion success

"Plants compete in different ways," says Zhijie Zhang, first author on the study and a doctoral researcher in the University of Konstanz's Ecology group led by Professor Mark van Kleunen. "The most intuitive way is competition for resources such as nutrients and sunlight. But competition can also occur through other trophic levels, for instance in relation to herbivores and especially in regard to soil microbes (fungi, bacteria and other small organisms that live below ground). Our study shows that fungal endophytes, which spend at least part of their life cycle inside plants, are key to explaining invasion success."

Previous studies have revealed that plants modify the community of soil microbes as they grow, which affects both their own development and that of plants which later grow on this soil ("soil-legacy effect"). However, exactly how soil-legacy effects impact competitive outcomes between alien and native plants in multi-species communities had remained unclear. To address this issue, the researchers conceived a large, multi-species experiment consisting of two stages. First, soil was conditioned with one of six native plant species, with one of four aliens, or, as a control, without any plant. In a second step, on these soils, ten plant species (either native or alien) were grown without competition, with competition from conspecific plants, or with competition from another species, thus mimicking different competition scenarios in nature. To assess the role of microbes, the researchers further analyzed how soil-conditioning species affected the soil microbial communities and how the soil microbial communities affected later plants, taking biomass production above ground as an indication of competitive ability.

Invasional meltdown in multi-species plant communities

The study revealed several things: First, there was no evidence of superior competitive ability among the naturalized aliens if the soil they were grown on had not undergone any conditioning. In other words, aliens did not prove to be more competitive than natives in two-species communities, a finding that challenges previous theories on invasion success. Soil conditioned by aliens, however, did affect competitive outcomes between natives and aliens, with aliens producing much more biomass than native plants. "In this scenario, the aliens proved much more competitive than their native rivals, lending further credence to the invasional meltdown hypothesis," says Zhang.

This hypothesis posits that the establishment of one alien species in a non-native habitat can facilitate the invasion of other alien species in the same environment. The study by Zhang et al. pinpoints the underlying mechanism to the soil microbiome: "Our analyses reveal that the legacy effect of soil-conditioning species on later species became less negative as their microbial communities became less similar," elaborates Zhang. Aliens were observed to share fewer fungal endophytes with other aliens than with native species, which comes with a lower chance of fungal endophytes spilling over. "The idea, which is also referred to as 'novelty," is that two species that share few fungal endophytes affect each other less negatively than two species that share many endophytes," concludes Zhang. "More research needs to be carried out, but we are positive that soil microbes are crucial to invasion success and invasional meltdown in multi-species communities."


Explore further Economic alien plants more likely to go wild

More information: Soil-microorganism-mediated invasional meltdown in plants, Nature Ecology and Evolution (2020). DOI: 10.1038/s41559-020-01311-0 , www.nature.com/articles/s41559-020-01311-0

Journal information: Nature Ecology & Evolution

Provided by University of Konstanz

Nights warming faster than days across much of the planet

by University of Exeter
  
Spatial variation in warming asymmetry across the diel cycle between 1983 and 2017. In total c.54% of the land surface has experienced warming asymmetry of >0.25°C, with more than twice the area of land warming more during the nighttime than the daytime. Driven primarily by changing levels of cloud cover this is associated with a wetting (increased nighttime warming) and drying (increased daytime warming) of the climate. The blue illustrates where the nighttime has warmed more rapidly, and red where the daytime has done so. The projection is Behrmann's equal area. Credit: University of Exeter

Global warming is affecting daytime and night-time temperatures differently—and greater night-time warming is more common than greater daytime warming worldwide—new research shows.


University of Exeter scientists studied warming from 1983 to 2017 and found a difference in mean annual temperature of more than 0.25°C between daytime and night-time warming in over half of the global land surface.

Days warmed more quickly in some locations, and nights did in others—but the total area of disproportionately greater night-time warming was more than twice as large.

The study shows this "warming asymmetry" has been driven primarily by changing levels of cloud cover.

Increased cloud cover cools the surface during the day and retains the warmth during the night, leading to greater night-time warming. Whereas, decreasing cloud cover allows more warmth to reach the surface during the day, but that warmth is lost at night.

"Warming asymmetry has potentially significant implications for the natural world," said lead author Dr. Daniel Cox, of the Environment and Sustainability Institute on Exeter's Penryn Campus in Cornwall.

"We demonstrate that greater night-time warming is associated with the climate becoming wetter, and this has been shown to have important consequences for plant growth and how species, such as insects and mammals, interact.

"Conversely, we also show that greater daytime warming is associated with drier conditions, combined with greater levels of overall warming, which increases species vulnerability to heat stress and dehydration.

"Species that are only active at night or during the day will be particularly affected."

The global study examined hourly records of temperature, cloud cover, specific humidity and precipitation.

The authors modelled the different rates of change of daytime maximum and night-time minimum temperatures, and mean daytime and mean night-time cloud cover, specific humidity and precipitation.

They then looked at changes in vegetation growth and precipitation over the same period.

The study found that differences in daytime and night-time vegetation growth depended on rainfall.

Increased night-time warming led to less vegetation growth where it rained more, likely due to increased cloud cover blocking the sun. Whereas, vegetation growth was limited by water availability due to less rainfall where the days warmed more.


Explore further  Understanding why nights are getting warmer faster than days
More information: Daniel T. C. Cox et al, Global variation in diurnal asymmetry in temperature, cloud cover, specific humidity and precipitation and its association with leaf area index, Global Change Biology (2020). DOI: 10.1111/gcb.15336

Journal information: Global Change Biology

Provided by University of Exeter
Evolution on the smallest of scales smooths out the patchwork patterns of where plants and animals live

by Mark C. Urban, The Conversation
  
In the Pacific Northwest, even though there are huge variations in environment, the Douglas fir grows everywhere. Credit: NASA/NOAA

The Douglas fir is a tall iconic pine tree in Western North America forming a forest that winds unbroken from the Western spine of British Columbia all the way to the Mexican cordillera. The environmental conditions of Canada and Mexico are obviously very different, but even on much smaller scales—say, the top of a mountain compared with a valley below it—the rainfall, temperature, soil nutrients and dozens of other factors can vary quite a bit. The Douglas fir grows well in so many of these places that it turns a dramatically varied landscape into one smooth, continuous forest complete with all the species it supports.


I am an ecologist and used to think that the Douglas fir was simply a hardy tree, rarely hemmed in by environmental conditions or other species. But recent research done by my colleagues and me suggests that environmental conditions are not all that determines where plants and animals live in a landscape and the patchwork patterns of those distributions. These spatial patterns are also influenced by evolution.

Over time, species often adapt to local conditions, and these adaptations alter how and where they can live. For example, Douglas fir trees might adapt through evolution to thrive on both a dry mountainside and in a wet valley nearby. But my colleagues and I have taken this idea a step further to explore not just how organisms adapt, but how the process of adaptation itself can have profound effects on the patterns of where organisms live in a landscape.

Without adaptation, you might find a mixed patchwork of where species live—a species of insect lives in the valley, but not on the mountains. When Douglas firs adapt to and grow on a dry mountain as well as in the wet valley, they create one continuous forest habitat where two very different landscapes used to exist. The birds, the insects, the deer, the flowers and all the other organisms that live in the forest can also now occupy both the valley and the mountaintop. Adaptation by the Douglas fir created a smoother distribution of species.

Adaptation, it seems, plays a larger role in determining ecological patterns than scientists previously thought.
  
Yellow-spotted salamanders in some ponds get eaten by larger predators, but in others, they adapted to eat more and grow quickly so that they would not be eaten. Credit: Mark Urban, CC BY-ND

A salamander mystery

In 1999, when I was a beginning graduate student in Connecticut, I wanted to understand how a predator called the marbled salamander affected the survival of the smaller yellow-spotted salamander in small temporary ponds. Much like the famous wolves in Yellowstone National Park, the marbled salamander is a keystone predator, and just a few individuals in a pond can determine which other species live there.


I spent months watching these ponds, but however much I tried, the patterns I saw just weren't making sense. In one pond, the yellow-spotted salamanders survived alongside the marbled predator. But in the next pond over, under nearly identical conditions, the spotted salamanders were quickly reduced to predator poop. I couldn't find an environmental explanation for this.

To figure out what was driving this unevenness of high and low survival, I collected salamander eggs from ponds where the small salamanders survived alongside the predator, as well as eggs from ponds without predators. I then raised these yellow-spotted salamanders in buckets and looked for differences between them.
  
Marbled salamanders are keystone predators in New England ponds, but adaptation by the smaller spotted salamander can dramatically change the composition of the ponds. Credit: Mark Urban, CC BY-ND

I found one surprising difference. The salamanders from ponds with the predatory marbled salamander adapted to the predator by becoming gluttonous—eat and get big so you don't get eaten yourself.

In these little New England ponds, local adaptation had created spotted salamander populations with very different behaviors to allow them to survive predation from the marbled salamander. But before I could find out more, I finished my doctorate and found myself driving far away from these salamanders to a new job in California.

Adaptation, not environment, as a cause?

Over the next few years, other ecologists were beginning to recognize that evolution could happen very quickly. In one classic experiment, scientists put algae and a microscopic grazer into a tank together. At first, there were cycles of boom and bust, but after only a few weeks, the algae evolved defenses that prevented them from being eaten and stopped the large swings in population numbers.
  
Marbled salamanders were causing local adaptation in another species that was driving dramatic differences in ponds. Credit: Mark Urban, CC BY-ND

This was intriguing. My experience with the salamanders had taught me that evolution could happen not just quickly, but also differently in two nearby and otherwise similar ponds. If evolution affected population patterns in time, maybe it could also affect species distribution patterns in space.

I returned to my salamanders after getting a job at the University of Connecticut. This time, I wasn't interested just in how salamanders adapted to their ecosystem, but how their adaptations altered the ecosystem itself. I again raised salamanders from high- and low-predation ponds under the same conditions. But this time, I tracked what happened to other species in the artificial ecosystems I had created.

The predatory marbled salamanders eat small crustaceans. But the yellow–spotted salamanders adapted to the predators by eating more of these small crustaceans too. Adaptation by the yellow-spotted salamanders resulted in far fewer crustaceans in the ponds. My experiment showed that this adaptation amplified differences in the numbers of crustaceans between ponds with and without the marbled predator. In this case, adaptation made two ponds more different than they would have been otherwise.

When I compared my experiments with what was happening in the natural ponds, I realized that I had discovered what was driving the perplexing patterns I'd seen years before. Local adaptation, not just the environment or other species, was amplifying the differences in these ponds.
Large cattle watering tanks make for effective experimental ponds. Credit: Mark Urban, CC BY-SA

Adaptation as a universal effect

I began to wonder: If this effect was happening with salamanders, could local adaptation also amplify or dampen spatial ecological patterns in other species? Was this a widespread effect?

Answering this question would require evidence from creatures all around the world. I recruited a bunch of biologist friends to help me sort through thousands of past studies on everything from bacteria to birds and look for evidence that local adaptation was changing the spatial patterns of these species.

Our team gathered information from 500 studies over the past 100 years. We found that, as with my salamanders, adaptation sometimes makes existing differences between places even greater than expected without evolution.

Adaptation can also create patterns where none existed previously. Widespread plants like goldenrods and aspens often evolve chemical defenses that change which insects can eat them. Adaptation creates new patchwork patterns of insect abundances and diversity across fields and forests where none would exist otherwise.
Just like the salamanders, Douglas firs undergo local adaptation that drives broad changes in where organisms live.

However, we found that in 85% of cases, adaptation dampened existing ecological spatial patterns. Organisms ranging from the modest apple maggot fly to the grand Douglas fir adapted in ways that reduced the variability of the landscapes in which they lived. Adaptation on small spatial scales smoothed out the patchwork of forests and meadows, populating both hilltops and valleys with the same trees, birds, insects and other organisms. Thanks to adaptation, the world in general is more homogeneous than it would otherwise be.

So next time you find yourself counting down the hours for your car to reach its destination, notice the natural patterns scrolling by your window. Many of these patterns reflect the hidden hand of evolution, which has ironed out the wrinkles and left the world a smoother place.


Explore further  Evolution makes the world less ragged

Provided by The Conversation

This article is republished from The Conversation under a Creative Commons license. Read the original article.