Showing posts sorted by relevance for query AIR POLLUTION LUNG CANCER. Sort by date Show all posts

Saturday, April 27, 2024

The world’s 100 worst polluted cities are in Asia — and 83 of them are in just one country

Helen Regan, CNN
Fri, April 26, 2024 


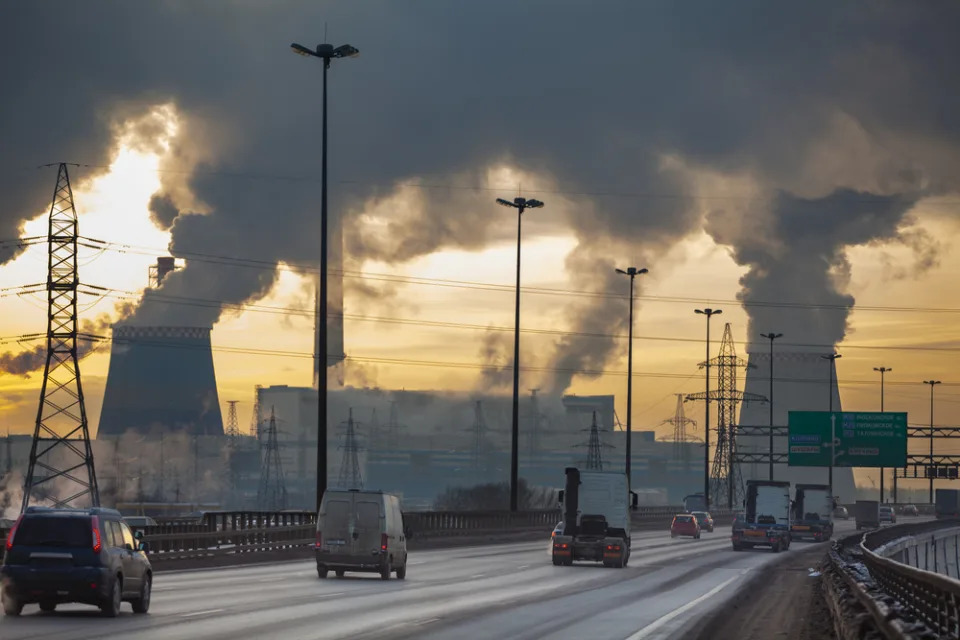
All but one of the 100 cities with the world’s worst air pollution last year were in Asia, according to a new report, with the climate crisis playing a pivotal role in bad air quality that is risking the health of billions of people worldwide.

The vast majority of these cities — 83 — were in India and all exceeded the World Health Organization’s air quality guidelines by more than 10 times, according to the report by IQAir, which tracks air quality worldwide.

The study looked specifically at fine particulate matter, or PM2.5, which is the tiniest pollutant but also the most dangerous. Only 9% of more than 7,800 cities analyzed globally recorded air quality that met WHO’s standard, which says average annual levels of PM2.5 should not exceed 5 micrograms per cubic meter.


“We see that in every part of our lives that air pollution has an impact,” said IQAir Global CEO Frank Hammes. “And it typically, in some of the most polluted countries, is likely shaving off anywhere between three to six years of people’s lives. And then before that will lead to many years of suffering that are entirely preventable if there’s better air quality.”

When inhaled, PM2.5 travels deep into lung tissue where it can enter the bloodstream. It comes from sources like the combustion of fossil fuels, dust storms and wildfires, and has been linked to asthma, heart and lung disease, cancer, and other respiratory illnesses, as well as cognitive impairment in children.

Begusarai, a city of half a million people in northern India’s Bihar state, was the world’s most polluted city last year with an average annual PM2.5 concentration of 118.9 — 23 times the WHO guidelines. It was followed in the IQAir rankings by the Indian cities of Guwahati, Assam; Delhi; and Mullanpur, Punjab.

Across India, 1.3 billion people, or 96% of the population, live with air quality seven times higher than WHO guidelines, according to the report.

Central and South Asia were the worst performing regions globally, home to all four of the most polluted countries last year: Bangladesh, Pakistan, India and Tajikistan.

South Asia is of particular concern, with 29 of the 30 most polluted cities in India, Pakistan or Bangladesh. The report ranked the major population centers of Lahore in 5th, New Delhi in 6th and Dhaka in 24th place.

Hammes said no significant improvement in pollution levels in the region is likely without “major changes in terms of the energy infrastructure and agricultural practices.”

“What’s also worrisome in many parts of the world is that the things that are causing outdoor air pollution are also sometimes the things that are causing indoor air pollution,” he added. “So cooking with dirty fuel will create indoor exposures that could be many times what you’re seeing outdoors.”
A global problem

IQAir found that 92.5% of the 7,812 locations in 134 countries, regions, and territories where it analyzed average air quality last year exceeded WHO’s PM2.5 guidelines.

Only 10 countries and territories had “healthy” air quality: Finland, Estonia, Puerto Rico, Australia, New Zealand, Bermuda, Grenada, Iceland, Mauritius and French Polynesia.

Millions of people die each year from air pollution-related health issues. Air pollution from fossil fuels is killing 5.1 million people worldwide every year, according to a study published in the BMJ in November. Meanwhile, WHO says 6.7 million people die annually from the combined effects of ambient and household air pollution.

The human-caused climate crisis, driven by the burning of fossil fuels, plays a “pivotal” role in influencing air pollution levels, the IQAir report said.

The climate crisis is altering weather patterns, leading to changes in wind and rainfall, which affects the dispersion of pollutants. Climate change will only make pollution worse as extreme heat becomes more severe and frequent, it said.

The climate crisis is also leading to more severe wildfires in many regions and longer and more intense pollen seasons, both of which exacerbate health issues linked to air pollution.

“We have such a strong overlap of what’s causing our climate crisis and what’s causing air pollution,” Hammes said. “Anything that we can do to reduce air pollution will be tremendously impactful in the long term also for improving our climate gas emissions, and vice versa.”
Regional rankings

North America was badly affected by wildfires that raged in Canada from May to October last year. In May, the monthly average of air pollution in Alberta was nine times greater than the same month in 2022, the report found.

And for the first time, Canada surpassed the United States in the regional pollution rankings.

The wildfires also affected US cities such as Minneapolis and Detroit, where annual pollution averages rose by 30% to 50% compared to the previous year. The most polluted major US city in 2023 was Columbus, Ohio for the second year running. But major cities like Portland, Seattle and Los Angeles experienced significant drops in annual average pollution levels, the report said.

In Asia, however, pollution levels rebounded across much of the region.

China reversed a five-year trend of declining levels of pollution, the report found. Chinese cities used to dominate global rankings of the world’s worst air quality but a raft of clean air policies over the past decade has transformed things for the better.

A study last year had found the campaign meant the average Chinese citizen’s lifespan is now 2.2 years longer. But thick smog returned to Beijing last year, where citizens experienced a 14% increase in the annual average PM2.5 concentration, according to the IQAir report. China’s most polluted city, Hotan, was listed at 14 in the IQAir ranking.

In Southeast Asia, only the Philippines saw a drop in annual pollution levels compared to the previous year, the report found.

Indonesia was the most polluted country in the region, with a 20% increase compared to 2022. Indonesia, Vietnam and Thailand all had cities that exceeded WHO PM2.5 guidelines by more than 10 times, according to the report.

Last month, Thai authorities ordered government employees to work from home due to unhealthy levels of pollution in the capital Bangkok and surrounding areas, according to Reuters. On Friday, tourism hot spot Chiang Mai was the world’s most polluted city as toxic smog brought by seasonal agricultural burning blanketed the northern city.
Inequality… and one bright spot

The report also highlighted a worrying inequality: the lack of monitoring stations in countries in Africa, South America and the Middle East, which results in a dearth of air quality data in those regions.

Although Africa saw an improvement in the number of countries included in this year’s report compared with previous years the continent largely remains the most underrepresented. According to IQAir, only 24 of 54 African countries had sufficient data available from their monitoring stations.

Seven African countries were among the new locations included in the 2023 rankings, including Burkina Faso, the world’s fifth most polluted country, and Rwanda, in 15th.

Several countries that ranked high on the most polluted list last year were not included for 2023 due to a lack of available data. They include Chad, which was the most polluted country in 2022.

“There is so much hidden air pollution still on the planet,” said Hammes.

One bright spot is increasing pressure and civic engagement from communities, NGOs, companies, and scientists to monitor air quality.

“Ultimately that’s great because it really shows governments that people do care,” Hammes said.


20 Most Air Polluted Cities in Asia
Meerub Anjum
Fri, April 26, 2024


In this article, we will look into the 20 most air polluted cities in Asia. If you want to skip our detailed analysis, you can go directly to the 5 Most Air Polluted Cities in Asia.
Air Pollution in Asia

99 out of the 100 most air polluted cities in the world are from Asia. The UNEP reports that nearly 6.5 million people die due to poor air quality every year, out of which 70% of the deaths occur in Asia and the Pacific. According to the 2023 Air Quality Life Index report, countries such as Bangladesh, Nepal, Pakistan, and India account for more than 50% of the life years lost due to air pollution. South Asia is the most polluted subregion in Asia, where the average lifespan declined by 5.1 years. Bangladesh is the most air polluted country in Asia. Life expectancy declined by 6.8 years in Bangladesh, as of 2023.

In 2023, Asia dominated the countries with the worst air pollution in the world. According to the 2023 World Air Quality Report, East Asia showed a diverse outlook, with some countries experiencing an increase in PM2.5 concentration in 2023 while others facing a decline. Countries such as Japan, Taiwan, South Korea, and Hong Kong SAR surpassed the WHO's target 2 of 15 μg/m³. Mongolia continued its downward trend in PM2.5 concentration and recorded a 25% decrease in its PM2.5 concentration. Hotan, China stands out as the most air polluted city in 2023, with an annual average particulate matter concentration of more than 87 µg/m3. Whereas, Ibigawa, Japan is the least polluted city in the region, as of 2023.

The air quality in Southeast Asia deteriorated, due to many countries in the region experiencing a rise in PM2.5 concentration. Indonesia appeared as the most air polluted country in the subregion. While Phillippines saw improvement in air quality in 2023, recording a 10% drop in its particulate matter concentration. Cambodia's air quality worsened, with its PM2.5 concentration tripling in 2023. The top 4 countries with the worst air pollution in the world in 2023 are from Central and South Asia. The region also has the most number of air polluted cities, with the top 10 most air polluted cities from India and Pakistan. 31% of the region's cities had 10 times higher particulate matter concertation, compared to the WHO limit.
Green Tech and Clean Energy Solutions for India's Air Pollution Crisis

The third most air polluted country in Asia, India, has the most number of cities out of the 100 air polluted cities in the world in 2023. The country's annual PM 2.5 concentration increased to 54.4 μg/m³ in 2023. Delhi, the National Capital Territory of India, witnessed a 10% increase in its PM 2.5 concentration, with a peak monthly average of 255 μg/m³. 66% of the country's cities report annual averages higher than 35 μg/m³.

A startup in India, called Takachar, is working towards reducing the air pollution associated with stubble and crop residue burning. It develops small-scale and portable equipment that converts crop residue into bio-products, such as fertilizers, fuel, or activated carbons. Takachar claims that up to 100 million tons of carbon dioxide can be reduced every year, by providing price-competitive renewable biobased active carbon, as an alternative to fossil-based activated carbon. Stubble burning is one of the major causes of smog and air pollution in the country, especially in rural areas. The company provides processing of a diverse variety of crop and forest residues and converts them into bioproducts with a wide range of agricultural applications

Another major reason for air pollution is the emissions and PM2.5 released from the burning of fossil fuels for conventional energy production. Many corporations in India are providing clean energy solutions. Some of the prominent names in the market include Adani Green Energy Ltd (NSE:ADANIGREEN) and Suzlon Energy Ltd (NSE:SUZLON). Let's discuss them below in detail.

Adani Green Energy Ltd (NSE:ADANIGREEN) is a leading renewable energy company in India. It develops and operates utility-scale grid-connected wind, solar, and hybrid renewable energy power generation plants. On April 3, the company announced that it has become the first corporation in India to have surpassed 10,000 MW of operational capacity. Its portfolio consists of 1,401 MW wind, 7,393 MW solar, and 2,140 hybrid capacity. The total operational portfolio of Adani Green Energy Ltd (NSE:ADANIGREEN) will be able to provide energy to over 5.8 million homes and avoid nearly 21 megatonnes of carbon dioxide emissions annually.

Suzlon Energy Ltd (NSE:SUZLON) is another major name in the renewable energy market in India. The company has a wind energy capacity of nearly 20.5 GW across 17 countries, with 14.5 GW of wind energy assets in India. On March 7, the company announced that it has won an order for developing a 72.45 MW wind power project for a Delhi-based independent renewable energy provider, Juniper Green Energy Private Limited. Suzlon Energy Ltd (NSE:SUZLON) will deploy 23 wind turbine generators with a hybrid lattice tubular (HLT) tower, along with a rated capacity of 3.15 MW each at Juniper's site in Dwarka district, Gujrat.

Air pollution continues to affect millions of lives globally. Green technology initiatives are emerging as a strategic path to reduce GHG emissions and control air pollution. With this context, let's have a look at the 20 most air polluted cities in Asia. You can also look at


20 Most Air Polluted Cities in Asia

Kekyalyaynen / Shutterstock.com

Methodology

To compile our list of the 20 most air polluted cities in Asia, we consulted the IQ Air's Air Quality Index (AQI) live ranking. We have ranked the cities in ascending order of their Air Quality Index, as of April 22. We have also mentioned the PM2.5 and other pollutant concentrations of the cities, where available. For cities with the same AQI, we have used their PM2.5 concentration to break the tie.
20 Most Air Polluted Cities in Asia
20. Shanghai, China

Live Air Quality Index (2024): 83

Shanghai is ranked among the 20 most air polluted cities in Asia. As of April 22, the city has an AQI index of 83. The PM2.5 concentration in the city is 27.5 μg/m³.
19. Dubai, United Arab Emirates

Live Air Quality Index (April 20, 2024): 84

Dubai ranks 19th on our list. The major air pollutant in the city is PM10. Its PM2.5 and PM10 concentrations are 29 μg/m³ and 132.9 μg/m³, respectively.
18. Yangon, Myanmar

Live Air Quality Index (2024): 86

Yangon is one of the most air polluted cities in Asia. The city has a particulate matter concentration of 35.9 μg/m³, which is 7.9 times higher than the WHO standard.
17. Tashkent, Uzbekistan

Live Air Quality Index (2024): 88

Tashkent is the capital of Uzbekistan. As of April 22, the city has an air quality index of 88. Its PM2.5 concentration is 29 μg/m³. It is ranked 17th on our list.
16. Karachi, Pakistan

Live Air Quality Index (2024): 94

Karachi is the largest city in Pakistan. The city has an air quality index of 94, as of April 22. The PM2.5 concentration in Karachi is 29.5 μg/m³, which is 5.9 times higher than the air quality standards set by the WHO.
15. Kolkata, India

Live Air Quality Index (2024): 95

Kolkata is one of the most air polluted cities in Asia. The city has a PM2.5 concentration of 33 μg/m³ and an AQI of 95, as of April 22.
14. Astana, Kazakhstan

Live Air Quality Index (2024): 99

The capital of Kazakhstan, Astana is ranked 14th on our list. It has a particulate matter concentration of 33 μg/m³. Its air quality index is 99, as of April 22.
13. Kuwait City, Kuwait

Live Air Quality Index (2024): 102

Kuwait City is ranked 13th on our list of the most air polluted cities in Asia. The PM2.5 concentration in the city is 36 μg/m³, which is over 7 times higher than the WHO PM2.5 guideline.
12. Manama, Bahrain

Live Air Quality Index (2024): 102

Manama is the capital and one of the largest cities in Bahrain. As of April 22, the city has an AQI index of 102 and a PM2.5 concentration of 36 μg/m³. It is ranked 12th on our list.
11. Bangkok, Thailand

Live Air Quality Index (2024): 104

Bangkok ranks among the most polluted cities for air quality in Asia. As of April 22, the city has an AQI of 104. Its PM2.5 concentration is 34 μg/m³, which is 6.8 times higher than the WHO standard of 5 μg/m³ PM2.5 in the air.
10. Chengdu, China

Live Air Quality Index (2024): 107

Chengdu is ranked 10th on our list. The city has a PM2.5 concentration of 38 μg/m³ and a PM10 concentration of 73 μg/m³.
9. Doha, Qatar

Live Air Quality Index (2024): 112

Doha is the capital of Qatar. As of April 22, the city has an air quality index of 112. Its PM2.5 concentration is 50 μg/m³. It is one of the most air polluted cities in Asia.
8. Medan, Indonesia

Live Air Quality Index (2024): 114

Medan is the capital of North Sumatra, Indonesia. It has a PM2.5 concentration of 41 μg/m³, which is over 8 times higher than the air quality standards.
7. Dhaka, Bangladesh

Live Air Quality Index (2024): 118

Dhaka is ranked 7th on our list. As of April 22, the city has an air quality index of 118. Its particulate matter concentration is 46.7 μg/m³.
6. Delhi, India

Live Air Quality Index (2024): 134

Delhi is ranked 6th on our list of the most air polluted cities in Asia. The major air pollutant in the city is PM10. The concentration of PM2.5 and PM10 in Delhi is 43 μg/m³ and 210 μg/m³, respectively.

Where has the dirtiest air in the US? Report ranks cities with best and worst air quality
.

Eduardo Cuevas and Krystal Nurse, USA TODAY
Sat, April 27, 2024 


A new report revealed concerning findings about America's air, but some cities are doing better than others.

As part of the report, the American Lung Association ranked the 10 best and worst metropolitan areas for air pollution. While the best cities are scattered all over the U.S., the West Coast saw some of the worst rankings.

The report looked at daily and annual fine particulate matter averages and ozone pollution regulated under the Clear Air Act. Nearly 2 in 5 Americans live in areas that had a failing grade for at least one air pollution measure, the report stated.

Read more: Report says U.S. air pollution worst in 25 years as new environmental regulations finalized

“We're seeing the most days and the ‘very unhealthy’ or ‘hazardous’ air quality level due to spikes in particle pollution,” Paul Billings, ALA’s senior vice president of public policy, told USA TODAY.
'No safe level to particle pollution'

The below rankings focus on fine particulate matter, or PM 2.5, which created when things are burned. It can cause asthma attacks, strokes and a litany of long term health problems.

“There is no safe level to particle pollution,” Dr. Kari Nadeau, the John Rock professor of climate and population studies at the Harvard T.H. Chan School of Public Health, told USA TODAY. “We were not meant to breathe this in as humans.”

The pollutants increase the risk of cardiovascular problems such as heart failure and arrhythmia, as well as respiratory ailments such as asthma and chronic obstructive pulmonary disease. Breathing in high levels of particulate matter in the long term has been linked to brain damage that puts people at higher risk of Parkinson’s disease, Alzheimer’s disease and other related dementias.
Top ten US metro areas with worst air pollution: West Coast air gets bad marks

The western U.S. experienced the bulk of its pollution from roadways, agriculture, oil and gas industries and seemingly endless wildfires.

Bakersfield, Fresno and Visalia – hubs for agricultural production, shipping and warehouses where the population is predominantly Latino – make up the top five cities in each of the report’s measures for 24-hour particle pollution, year-round particle pollution and ground-level ozone pollution.

Other metro areas included are: Eugene-Springfield, Oregon; Los Angeles-Long Beach; Sacramento-Roseville; Medford-Grants Pass, Oregon; Phoenix-Mesa, Arizona; and Fairbanks, Alaska.

Dangerous smoke: Where is wildfire smoke and air quality at its worst? Here's a map of the entire US.
Top ten US metro areas with least air pollution: Residents skew white

Some of the communities with the best air quality included Bangor, Maine; Wilmington, North Carolina; and Honolulu. Except for Honolulu, most of the cities with the best air quality were majority white.

Areas with the least amount of particulate matter pollution include: Casper, Wyoming, Kahului-Wailuku-Lahaina, Hawaii; Cheyenne, Wyoming; Duluth, Minnesota-Wisconsin; Colorado Springs, Colorado; Anchorage, Alaska; and St. George, Utah.

This article originally appeared on USA TODAY: Best and worst air in the US: Report ranks pollution in cities, metros

Thursday, November 19, 2020


Air pollution costs Utahns billions annually and shortens life expectancy by two years

New study reveals the cost of air pollution for Utahns' health and pocketbooks

UNIVERSITY OF UTAH

Research News

Air pollution has been a problem in Utah since before the territory was officially recognized as a state. The mountain valleys of this high elevation region are particularly vulnerable to the buildup of air pollution from vehicles, household heating and power production. Together with high per-capita energy use, this has resulted in periods of poor air quality. However, with so many types of pollution and regional conditions, determining the overall effects of air pollution on Utah's health and economy has been a major challenge. A new study from 23 Utah-based researchers, including five from the University of Utah, sought to do just that.

The study estimated that air pollution shortens the life of the average Utahn by around 2 years. And pollution costs Utah's economy around $1.9 billion annually. But many state-level actions, such as increasing vehicle and building efficiency, could reduce air pollution by double-digit percentages while benefitting the economy, the researchers found.

The team used an approach called expert assessment, which combines all available research and experience from published and unpublished scientific studies. Combining expertise from public health, atmospheric science and economics, the researchers assessed what types of disease and economic harm could stem from Utah's air pollution. The study was published in the peer-reviewed journal Atmosphere in a special issue on air quality in Utah.

They estimated that air pollution in Utah causes between 2,500 and 8,000 premature deaths each year, decreasing the median life expectancy of Utahns by 1.1 to 3.6 years. This loss of life expectancy is distributed across most of the population, they found, rather than only affecting "sensitive groups." For example, 75% of Utahns may lose 1 year of life or more because of air pollution and 23% may lose 5 years or more.

This substantial health burden is caused by many illnesses and conditions that most people might not associate with air pollution. For example, exposure to particulates and other pollutants increases occurrence of heart and lung diseases, including congestive heart failure, heart attack, pneumonia, COPD and asthma. These conditions account for 62% of the pollution impact on health, according to this study. The remaining 38% of health effects are associated with stroke, cancer, reproductive harm to mothers and children, mental illness, behavioral dysfunction, immune disease, autism and other conditions--all exacerbated by exposure to dirty air.

On the economic side, the researchers estimated that the direct and indirect costs of air pollution cost Utahns around $1.9 billion dollars (in the range of $0.75-3.3 billion) annually. This economic damage results from direct effects such as healthcare expenses, damage to crops and lost earning potential, in addition to indirect costs such as loss of tourism, decreased growth and regulatory burdens.

"It was a real eye-opener to see quantitative estimates of how serious the health and economic costs of air pollution are for the people of Utah," said Isabella Errigo, lead author and a graduate student at Brigham Young University. "The consequences of dirty air can seem very abstract until you read the medical research connecting the quality of our environment to our personal health."

Even though the estimates of cost in this study are on the low end of national estimates, which range up to $9 billion a year for Utah, they are still much higher than figures commonly discussed in the legislature. For example, approximately $10 million was appropriated to clean Utah's air this year, representing only 0.1% to 0.5% of the costs of air pollution.

"Utahns understand that air pollution imposes large hidden costs on our communities which is why it's consistently ranked as a top concern," said Logan Mitchell, a research assistant professor at the U and a co-author of the study. "Thankfully, innovation has made clean energy technologies cost competitive on the market, without even considering those hidden costs. The coming energy transition will mean being good stewards of the environment will also protect our economy."

The mismatch between the size of the problem and the proposed solutions emphasizes one of the central findings from the study: cleaning the air could have immense health and economic benefits for Utah. The authors combined their estimates of cost with the air pollution goals from the recent Utah Roadmap to Clean Air, produced by the U's Kem C. Gardner Policy Institute. If Utah achieves the roadmap's pollution reduction targets, they estimate, Utah could save $500 million per year by 2030 and $1.1 billion per year by 2050.

"The payoff of reducing pollution would be huge in economic terms and the benefits would be incalculable in terms of human life and health," said senior author Ben Abbott, an assistant professor at BYU. "It's a question of choice. Are we going to settle for incremental progress in air quality or take advantage of this immense opportunity to improve the health of our communities and remove this enormous drag on our economy?"

"When I read these results, my thoughts immediately turn to my friends and family who live in Utah," said co-author Rebecca Frei, a graduate student at the University of Alberta. "My grandmother goes walking and my niece plays on the playground every day. Changing some simple things about how we operate means added years of life. To me, that's a no-brainer. This isn't about pushing an agenda, this is about assessing the evidence and acting out of love for our families and community."

The researchers ranked more than 30 recommendations of how to best reduce the amount of air pollution in Utah. At the top of the list: increase efficiency of vehicles and buildings, invest in awareness, remove subsidies for nonrenewable energy, require payment for pollution and expand alternative transportation. They estimated that each of these interventions could result in double-digit decreases in air pollution. The researchers suggested that changes at the state level and community level as the most effective and tractable.

The researchers cautioned that no single change would achieve the desired improvement in air quality alone. "We need long-term implementation of proven pollution control measures," Errigo said. "It's going to take commitment from multiple groups at city to state levels to clean up our air and prepare for future growth."

The findings of this study are directly in line with the recommendations of the Utah Road Map to Clean Air and add quantitative estimates of the health and economic costs. The researchers hope that these estimates provide additional context for state legislators and concerned citizens who want to enact positive change.

"In our efforts to clear the air there are no perfect answers, but there are practical solutions," said Thom Carter, Executive Director of the Utah Clean Air Partnership (UCAIR) and co-author on the study. "When looking at how poor air quality impacts our region, it is important to know that we are making progress and that each person, family, organization, and community can find ways to reduce emissions and improve our quality of life."

###

Find the full study here.

Other co-authors include Daniel Mendoza, Kerry Kelly, Andrew Freeman and Heather Holmes from the U; Sayedeh Sara Sayedi, Jeffrey Glenn, John D. Beard, Samuel Bratsman, Robert A. Chaney, Mitchell Greenhalgh, James D. Johnston, Leslie Lange and Audrey Stacey from BYU;  Peter D. Howe, Randal Martin and Trang Tran from Utah State University; Andrew Follett from Yale Law School and Derrek Wilson from the University of Colorado, Boulder Law School.

Disclaimer: AAAS a

Monday, June 10, 2024

NTU Singapore-led study estimates that between 1980 and 2020, 135 million premature deaths could be linked to fine particulate matter pollution


 NEWS RELEASE 

NANYANG TECHNOLOGICAL UNIVERSITY

Image 1 

IMAGE: 

(L-R): DIRECTOR OF EARTH OBSERVATORY OF SINGAPORE (EOS) AND PROFESSOR IN EARTH SCIENCE AT NTU’S ASIAN SCHOOL OF THE ENVIRONMENT (ASE) PROFESSOR BENJAMIN HORTON, NTU’S ASE AND LKCMEDICINE ASSOCIATE PROFESSOR STEVE YIM, WHO IS ALSO PRINCIPAL INVESTIGATOR AT NTU’S EOS, AND NTU’S SENIOR VICE PRESIDENT (HEALTH AND LIFE SCIENCES) AND DEAN OF NTU’S KONG CHIAN SCHOOL OF MEDICINE (LKCMEDICINE) DISTINGUISHED UNIVERSITY PROFESSOR JOSEPH SUNG, PRESENTING A PAIR OF PLASTINATED HUMAN LUNGS.

view more 

CREDIT: NTU SINGAPORE


A study led by researchers from Nanyang Technological University, Singapore (NTU Singapore) revealed that fine particulate matter from 1980 to 2020 was associated with approximately 135 million premature deaths globally.


In the study, premature deaths refer to fatalities that occur earlier than expected based on average life expectancy, resulting from preventable or treatable causes such as diseases or environmental factors.


The study found that the impact of pollution from fine particulate matter was worsened by climate variability phenomena such as the El Niño-Southern Oscillation, the Indian Ocean Dipole, and the North Atlantic Oscillation, and led to a 14 per cent rise in premature deaths.


The researchers explain that during such weather events, the increased temperature, changes in wind patterns, and reduced precipitation can lead to stagnant air conditions and the accumulation of pollutants in the atmosphere. These result in higher concentrations of PM2.5 particles that are particularly harmful to human health when inhaled.


Fine particulate matter, or PM2.5, refers to particulate matter 2.5 micrometres in diameter or smaller. These tiny particles come from vehicle emissions, industrial processes, and natural sources such as wildfires and dust storms.


As they are so small, PM2.5 particles can easily get into the air we breathe and penetrate deep into our lungs, leading to a range of health problems, especially for vulnerable groups like children, the elderly, and people with respiratory conditions.


The study estimated that a third of the premature deaths from 1980 to 2020 were associated with stroke (33.3 per cent); another third with ischemic heart disease (32.7 per cent), while chronic obstructive pulmonary disease, lower respiratory infections, and lung cancer made up the rest of premature deaths.


To understand how PM2.5 pollution affects mortality rates, the researchers studied satellite data from NASA on the levels of fine particulate matter in the Earth's atmosphere. They also analysed statistics on the incidence and mortality of diseases linked to pollution from the Institute for Health Metrics and Evaluation, based in the US. Additionally, they considered information on climate patterns from the National Oceanic and Atmospheric Administration.


While previous studies have explored aspects of air quality and climate, this study had a global scope and analysed over 40 years of data. By examining how specific climate patterns affect air pollution in different regions, it offers fresh insights into the complex relationship between climate and air quality.


First author of the study, Associate Professor Steve Yim of NTU’s Asian School of the Environment and Lee Kong Chian School of Medicine (LKCMedicine), who led the study, said: “Our findings show that changes in climate patterns can make air pollution worse. When certain climate events happen, like El Niño, pollution levels can go up, which means more people might die prematurely because of PM2.5 pollution. This highlights the need to understand and account for these climate patterns when tackling air pollution to protect the health of the global population.” Assoc Prof Yim is also a Principal Investigator at NTU’s Earth Observatory of Singapore (EOS).


Study co-author Distinguished University Professor Joseph Sung, NTU’s Senior Vice President (Health and Life Sciences), and Dean of NTU’s LKCMedicine, said: “Our study highlights how climate patterns affect air pollution, and this is crucial for healthcare professionals because it directly impacts public health. The effects of climate change and the environment on human health are not lesser than those of genomics and lifestyle patterns, and they have been increasing over the past decades. By recognising these patterns, healthcare providers can better prepare for potential increases in patients seeking treatment for pollution-related ailments. Additionally, this knowledge underscores the importance of proactive measures to reduce pollution and mitigate its health impacts, ultimately helping healthcare systems manage and alleviate the burden of pollution-related illnesses on communities.”


The findings from this study, which represents an advance in understanding how environmental challenges affect the health of the global population, reflect NTU's commitment to responding to the needs and challenges of healthy living and ageing, one of humanity’s grand challenges that the University seeks to address through its NTU 2025 strategic plan.


The study is also part of NTU’s S$50 million interdisciplinary climate research programme, the Climate Transformation Programme (CTP). Hosted by EOS and funded by Singapore’s Ministry of Education, the CTP aims to investigate climate change, develop, inspire, and accelerate knowledge-based solutions, and educate future leaders to establish the stable climate and environment necessary for a resilient and sustainable Southeast Asia.


Co-author of the study Professor Benjamin Horton, Director of Earth Observatory of Singapore, said: "Our study aligns seamlessly with NTU Singapore's ambitious Climate Transformation Programme (CTP), which aims to tackle the pressing challenges of climate change through interdisciplinary research and collaboration. By investigating the intricate relationship between weather patterns and deadly air pollution, we contribute valuable insights that will inform evidence-based solutions and policies to safeguard public health and promote environmental resilience in Southeast Asia and beyond.” Prof Horton is also Professor in Earth Science at NTU’s Asian School of the Environment.


This study was also funded by several awards and a grant from the Ministry of Education, Singapore. It is also part of The Prudential EOS Climate Impacts Initiative, for which Prudential Services Singapore funded NTU’s EOS to conduct a two-year, two-phase study to understand better the impacts of climate change on air quality and its associated health impacts.


The study also saw participation from NTU President's Chair in Genomics Professor Stephan Schuster, who is also Deputy Director at the Singapore Centre for Environmental Life Sciences Engineering (SCELSE). Healthcare professionals and researchers from The Chinese University of Hong Kong, Imperial College London, UK, Sun Yat-sen University, China, and Tan Tock Seng Hospital, Singapore were also involved. The findings were published in April in the peer-reviewed journal Environment International.


Assessing the interplay between climate phenomena, pollution, and deaths


This study used data from a dataset managed by NASA called MERRA-2 (Modern-Era Retrospective Analysis for Research and Applications, version 2). The dataset provides monthly information about the concentration of fine particulate matter on the Earth's surface.


The PM2.5 data analysed for this 40-year study spans from January 1980 to December 2020 and gives detailed information about air pollution levels in specific areas.


The study looked at how changes in air quality are affected by climate patterns, such as the El Niño-Southern Oscillation, Indian Ocean Dipole, and North Atlantic Oscillation weather patterns, obtained from indices assessed by the US National Oceanic and Atmospheric Administration.


The researchers also used data from the Institute for Health Metrics and Evaluation based in the United States on global deaths and occurrences of pollution-linked diseases, which include lower respiratory infections, tracheal, bronchus, and lung cancer, chronic obstructive pulmonary disease, stroke, and ischemic heart disease.


The researchers found that 363 major air pollution episodes happened worldwide over the past four decades, with an average of nine episodes yearly. The duration of an air pollution episode ranged from two to nine months, with 2002 being the year with the highest number of air pollution episodes (15 episodes), followed by 2004 and 2006 (14 episodes each year).


The study estimated that Asia had the highest number of premature deaths attributable to PM2.5 pollution between 1980 and 2020, at 98.1 million, with China and India reaching 49.0 million and 26.1 million deaths, respectively. Pakistan, Bangladesh, Indonesia, and Japan also had significant numbers of PM2.5-attributable premature deaths, ranging from 2 to 5 million each.


The researchers estimate that the three weather phenomena simultaneously caused approximately 7,000 more global premature deaths annually, with the Indian Ocean Dipole phenomena having the largest impact on the number of deaths, followed by North Atlantic Oscillation, and then El Niño.


All three weather patterns coincided in 1994, 1997, 2002, and 2015, with the Southeast Asian region being the most vulnerable. Around 3,100 more deaths occurred in that region each year due to the higher impact of pollution worsened by the weather patterns.


Assoc Prof Yim added: “This study underscores the importance of prioritising public health when developing air quality strategies. Instead of solely focusing on pollutant levels, governments should also consider the health effects of air pollution. This means evaluating policies based on their impact on reducing pollution-related health issues, especially highlighting the need for targeted interventions to mitigate pollution during specific weather conditions.”


Prof Sung added: “As our study has shown that PM2.5 pollution could have significant health consequences, health agencies need to allocate resources accordingly. This includes ensuring that healthcare services are equipped to handle the demands related to PM2.5 pollution-related illnesses. By emphasising health outcomes in air quality management, governments can better protect public health and improve overall well-being."


The team of researchers will be conducting more detailed studies for a deeper understanding of local air pollution patterns and further detailing the mechanisms behind how climate patterns influence the formation and reduction of PM2.5.

Tuesday, May 17, 2022

Study: Survivors of wildfires face greater risk of cancer
By Denise Mann, HealthDay News

"We saw a consistent signal for lung and brain cancer risk among people who live near wildfires," study author Scott Weichenthal said. 
File Photo by Peter DaSilva/UPI | License Photo

Wildfires, like the one raging in New Mexico, are known to cause upticks in breathing issues and heart attacks in their immediate wake for folks who live nearby.

Now, new Canadian research shows that these fires may also increase the risk for lung and brain cancer over time.

People who lived within about 30 miles of wildfires over the prior 10 years were 10% more likely to develop brain cancer and had a 5% higher risk for lung cancer, compared to folks living further away from these fires.


"We saw a consistent signal for lung and brain cancer risk among people who live near wildfires," said study author Scott Weichenthal, an associate professor in the Department of Epidemiology, Biostatistics and Occupational Health at McGill University in Montreal.

"We know that a whole range of carcinogens are released during wildfires that may increase the risk for these cancers."

Wildfires typically begin in forests, grassland or prairies, and are often caused by campfires left unattended, still-lit discarded cigarette butts, sparks from power lines, or arson.

These fires tend to occur in similar parts of the country, so people living in these areas can be continuously exposed to the potentially cancer-causing wildfire pollutants, the study authors noted.

RELATED Worsening drought fuels 'catastrophic' wildfires in New Mexico

Making matters worse, "wildfires are occurring more frequently, covering larger parts of the country, and wildfire season is starting earlier," Weichenthal said. These changes are likely due to global warming and climate change, he believes.

For the study, Weichenthal and his colleagues (including doctoral student Jill Korsiak, who led the analysis), tracked 20 years of data on more than 2 million Canadians to learn more about how wildfires affect people's risk for certain cancers.

The study wasn't designed to look at specific toxins in smoke that may increase cancer risks. "There's still a lot 
to learn about the kind of pollution that sticks around after the fire," Weichenthal said.

RELATED New Mexico wildfire exceeds 176,000 acres officials urge residents to evacuate

It's not just about outdoor air pollution: "Wildfires also pollute water, soil and indoor air," he noted.

Dr. Mary Prunicki, who reviewed the new study, stressed that "we know more about the short-term effects of wildfires than we do about their long-term impact." She directs air pollution and health research at the Sean N. Parker Center for Allergy Research at Stanford University School of Medicine in California.

On the day of and days immediately following a wildfire, there's an uptick in hospital visits for asthma attacks, chronic obstructive pulmonary disease (COPD) exacerbations, and other lung conditions, Prunicki said.

"There is a strong literature showing an increase in heart attacks, cardiac arrests and strokes among people who have been exposed to wildfire smoke, especially those who have a pre-existing condition," she explained.

Anyone living near wildfire smoke may have burning eyes, a runny nose, cough and/or difficulty breathing.

Exactly what's in the smoke depends on what is burning, Prunicki said, but "in general, wildfires contain small particulate matter that can penetrate deep into the lungs and cause health problems.

"There are various toxins that could be in the smoke that have already been associated independently with increases in lung cancer, including polycyclic aromatic hydrocarbons [PAHs]," she added.

There are steps you can take to protect your health if you live in a part of the country where wildfires are common.

According to Prunicki, these including understanding your indoor air quality, and if it's poor, using an air purifier or a high-efficiency particulate air (HEPA) filter in your central air conditioning or heating unit. These filters can help remove pollutants from the air you breathe.

Also, "if you have underlying heart or lung conditions, make sure you have your medication at the ready, too," Prunicki said.

It's important as well to reduce the risk of wildfires when you're enjoying the great outdoors, including dousing your campfire with water until it's cold to make sure it is really out.

The study was published in the May 2022 issue of The Lancet Planetary Health.

More information

Sign up for local air quality notices via the Environmental Protection Agency.

Copyright © 2022 HealthDay. All rights reserved.

Wednesday, April 19, 2023

A quarter of Americans live with polluted air, with people of color and those in Western states disproportionately affected, report says

Story by Jen Christensen • CNN Yesterday 

About 1 in 4 people in the United States – more than 119 million residents – live with air pollution that can hurt their health and shorten their lives, according to a new report from the American Lung Association. People of color are disproportionately affected, as are residents of Western cities.

U.S. EPA unveils new emissions standards to push electric vehicle production
Duration 5:40

Since President Richard Nixon signed the Clean Air Act in 1970, emissions of outdoor air pollutants have fallen 78%, according to the US Environmental Protection Agency. But Wednesday’s 2023 State of the Air report, which focuses on ozone and particle pollution, shows that millions put their health on the line every time they step outside.
Cleaner air, but not for all

To capture pollution levels at the county level, researchers analyzed data collected by the EPA’s Air Quality System, a repository of ambient air quality data from more than 10,000 monitors. They characterized the hourly average ozone concentration and the 24-hour average particle pollution concentration for 2019-21 at each monitoring site and factored in year-round pollution information from the EPA.

There were significant improvements in some areas. Generally, 17.6 million fewer people were breathing unhealthy air than in last year’s report, due largely to falling levels of ozone in some regions.

Ozone pollution is the main ingredient in smog. It comes from cars, power plants and refineries. Exposure to ozone can immediately exacerbate asthma symptoms, and people with long-term exposure to higher levels face a significantly higher risk of death from respiratory diseases than those who live with cleaner air.

Around 25% more counties got an A grade in the report for lower levels of ozone pollution. Some of that improvement can be attributed to the Clean Air Act, according to Katherine Pruitt, author of the report and the American Lung Association’s national senior director for policy.

Emission controls have helped, she said, as has the country’s continuing move away from its reliance on coal for its energy needs. Even something simple as the increase in the number of people who work from home has played a role.

“The Biden administration has set themselves a good, strong to do list of things that will help with environmental justice and climate protection,” Pruitt said. “They’re moving kind of slow, though. So we’d like them to pick up the pace.”

Despite the progress, not everyone was lucky enough to live in a county with good ozone levels. More than 100 million people live in counties that get an F for ozone smog, the report says.

Western and Southwestern cities are the most ozone-polluted, with 10 of the 25 most-polluted cities in California. New York, Chicago and Hartford, Connecticut, were the only three on that list east of the Mississippi River.

The five metropolitan areas with the worst ozone pollution are Los Angeles-Long Beach, California; Visalia, California; Bakersfield, California; Fresno-Madera-Hanford, California; and Phoenix-Mesa, Arizona.

Problematic particle pollution

Particle pollution, the other form of pollution tracked in the report, still seems to be a significant issue for the US.

Often hard to see, particle pollution is a mix of solid and liquid droplets that may come in the form of dirt, dust, soot or smoke. Coal- and natural gas-fired power plants create it, as do cars, agriculture, unpaved roads, construction sites and wildfires.

Particle pollution is so tiny – 1/20th of a width of a human hair – that it can travel past your body’s usual defenses.

Instead of being carried out when you exhale, it can get stuck in your lungs or go into your bloodstream. The particles cause irritation and inflammation and may lead to respiratory problems. Exposure can cause cancer, stroke or heart attack; it could also aggravate asthma, and it has even been associated with a higher risk of depression and anxiety, studies show.

The new report says the number of people living in counties with failing grades for daily spikes of particle pollution was the highest it has been in a decade. Nearly 64 million live with these kind of unhealthy spikes in counties that get failing grades.

One driver of the high amounts of particle pollution are the wildfires that have consumed hundreds of thousands of acres. In 2021 alone, there were 14,407 fires, many in the West, according to the National Interagency Fire Center. There used to be a wildfire season, experts say, but now they happen year-round.

Those fires are why the regions with the highest concentrations of air pollution are largely in the West.

When the American Lung Association started producing its report in 2004, 106 counties in 30 states got failing grades for daily spikes in particle pollution. Fewer than half were in eight states west of the Rocky Mountains. Today, 111 counties in 19 states got Fs for spikes in particle pollution, and all but eight counties are in the West, the report says.

Urban centers in the Rust Belt and the industrialized East had gotten the most failing grades in the early 2000s, but many have cleaned up and now get passing grades.

Bakersfield, California, displaced Fresno as the metropolitan area with the worst short-term particle pollution, but Fresno did not suddenly develop cleaner air. That city still had the most-polluted label for year-round particle pollution, tied with Visalia, in the agricultural San Joaquin Valley.

Los Angeles is still the city with the worst ozone pollution, according to the report, as it has been for all but one of the years included in the report.

California has some of the more progressive environmental legislation in the country, but the climate crisis has not been kind to the state, said Tarik Benmarhnia, an air pollution and wildfire researcher at the University of California, San Diego, who did not work on the new report.

“All these cities like Bakersfield and Visalia are in a valley near the forests that are seeing big fires. There’s also intense agricultural and industrial work there, so they unfortunately have all the worst conditions for air pollution,” Benmarhnia said.

There are some newcomers to the list of the 25 areas with the most particle pollution, including Denver and Fargo, North Dakota. Reno, Nevada; Yakima and Spokane, Washington; and Boise, Idaho; all made the worst list this year.

San Luis Obispo, California; Portland, Oregon; and Seattle and Bellingham, Washington; all moved off the list of worst 25 cities.

Residents in the cities ranked worst for particle pollution are living with more of it, the report says. In the top 25 cities with the worst air, the average number of days residents were exposed to high levels of fine particle pollution increased to a weighted average of 18.3, up from 16.5 in last year’s report.

East of the Mississippi, Pittsburgh and Lancaster, Pennsylvania, were the two worst metropolitan areas in the country, posting more days high in fine particle pollution in this year’s report.

Unequal exposure

Not everyone experiences pollution the same way in the US. Regardless of the region, communities of color bear the brunt of the problem.

Specifically, although people of color make up 41% of the overall US population, they are 54% of the nearly 120 million people living in counties with at least one failing grade for unhealthy air. And in the counties with the worst air quality, 72% of the 18 million residents are people of color, the report said.

Other research has also shown this trend. On maps that lay out areas with high levels of air pollution and where communities were redlined – areas where Black people were forced to live – they line up perfectly, Pruitt said.

“Then, the other aspect is, when you have a community of color that is a voluntary community, people aren’t forced to live there, those are communities that tend to have less of a voice, so decision makers place polluting sources in those communities because there’s not as much howling by people with power when they do. So those communities get the highways; they get the landfills; they get the fence lines,” she said.

There’s a myth that only poor communities live with disproportionate pollution levels, says Chris Tessum, a professor in the Civil and Environmental Engineering Department of the University of Illinois. Tessum, who was not involved in the new report, says race really is the determining factor.

“The thinking is that people with more money will buy better property, which has lower air pollution and that’s just the way of the world or whatever, but that’s just kind of emphatically not, not true,” he said.

Solutions to pollution

Communities need to play a key role in making decisions to help clean air, Tessum said.

“People that have the power will use that power to benefit themselves and not the people that have been historically overburdened,” he said.

The new report says government and residents can make a difference. One suggestion is to leverage Inflation Reduction Act funding to help reduce emissions at ports and to invest in zero-emission heavy-duty vehicles and in infrastructure that would improve air quality monitoring.

States can also use the Clean Air Act authority to adopt the California zero-emissions standards for cars and trucks, the report says.

At the federal level, agencies must finalize stronger limits on air pollution to truly protect public health and advance environmental justice, the report says, including standards to move the country toward zero-emissions vehicles. The EPA also has to set stronger national standards for particle pollution and ozone, the researchers say.

Pruitt said she knows firsthand how better policies can work. She said growing up before the Clean Air Act, pollution was so high that she could see it every time she stepped outside. Today, the pollution is not nearly as visible.

“I’m in my mid-60s, and of course, air pollution was very tangible when I was young, but these days, thank goodness it isn’t. Most people don’t see it,” she said. Unless a person has a lung condition, they may not even feel it.

But just because you can’t see it or feel it doesn’t mean it’s not there. Pruitt encourages people to remember that no level of pollution is safe. The World Health Organization estimates that the combined effects of ambient air pollution and household air pollution are associated with 6.7 million premature deaths annually.

“People don’t really recognize that what they’re breathing is impacting their health,” Pruitt said.

For more CNN news and newsletters create an account at CNN.com

Wednesday, March 18, 2020


Dramatic satellite footage shows 'notable drop' in air pollution over Italy after coronavirus lockdown restricts transport and industrial activity


Levels of nitrogen dioxide emissions were down across northern Italy in March

The ESA Copernicus Sentinel-5 satellite spotted the emission levels changing 

ESA shared an animation showing the dramatic change from January to March 

It coincided with the announcement of a lockdown in Italy due to coronavirus 


By RYAN MORRISON FOR MAILONLINE UPDATED:16 March 2020


VIDEOS AT THE END OF ARTICLE

Dramatic footage from the European Space Agency Copernicus satellite reveals a 'notable drop' in air pollution over Italy after the coronavirus lockdown.

ESA shared an animation that showed a significant change in the pollution levels over Italy between January and March, particularly over Po Valley in the north.

In an attempt to reduce the spread of the deadly disease, Italy's Prime Minister Giuseppe Conte announced a lockdown of the entire country.

The animation is made with data from the a special instrument called Tropomi on the Copernicus Sentinel-5 satellite that maps traces of noxious gases in the atmosphere.


Graphic shows decline of air pollution since Italy lockdown


There are just under 125,000 cases of coronavirus around the world with over 4,500 deaths from the virus as the World Health Organisation says Europe is now the global epicentre

Italy closed schools, restaurants, bars, museums and other venues - as well as limited large gatherings - all of which reduced the number of polluting activities.

ESA's Claus Zehner, Sentinel-5P mission manager, said, 'The decline in nitrogen dioxide emissions over the Po Valley in northern Italy is particularly evident.

'Although there could be slight variations in the data due to cloud cover and changing weather, we are very confident that the reduction in emissions that we can see, coincides with the lockdown in Italy causing less traffic and industrial activities.'

Similar changes in pollution levels were noted by NASA researcher Santiago Gasso when studying other data from Copernicus.

He said: 'In one month, there is a clear decrease of NO2 levels (a pollution marker) in northern Italy according to the satellite sensor.'


‹ SLIDE ME ›
There was a notable drop in Nitrogen Dioxide over Italy between January and March. By March, in line with the lockdown in the Italy, the level of nitrogen dioxide (orange on the map) had started to drop

The satellite that captured the data is the first Copernicus mission dedicated to monitoring our atmosphere.

Its Tropomi instrument maps a range of trace gases such as nitrogen dioxide, ozone, formaldehyde, sulphur dioxide, methane, carbon monoxide and aerosols.

All of these gases affect the air we breathe and therefore our health, says ESA.

The same ESA satellite also revealed a drop in air pollution over China with tiny particles slahed in the wake of coronavirus.

The country's government closed down much of its industrial activity and restricted air and car travel to limit the spread of the killer virus.


The Copernicus Atmosphere Monitoring Service (CAMS) observed a decrease of fine particulate matter (PM2.5) for February relative to the previous three years of between 20 and 30 per cent, Copernicus said in a statement.

PM2.5 is one of the most important air pollutants regarding health impacts according to the World Health Organization.

Nitrogen dioxide is a noxious gas which is released during fuel combustion and emitted by cars, power plants and industrial facilities.

It forms when fossil fuels such as coal, gas or diesel are burned at high temperatures and can cause a range of harmful effects on the lungs including increased inflammation of the airways and a greater risk of asthma attacks.

Satellite images compared this February's air quality with the same month from 2017 and 2019 and found a decrease in the amount of PM2.5 emissions in China of up to 30 per cent (pictured, the percentage difference as shown by the colour bar at the top)

Air quality researcher at NASA’s Goddard Space Flight Center Fei Liu said: 'This is the first time I have seen such a dramatic drop-off over such a wide area for a specific event.'

'Given the growing importance and need for the continuous monitoring of air quality, the upcoming Copernicus Sentinel-4 and Sentinel-5 missions will monitor key air quality trace gases and aerosols,' the agency said.

'These missions will provide information on air quality, stratospheric ozone and solar radiation, as well as climate monitoring.'

Josef Aschbacher, ESA's Director of Earth Observation Programmes, says the Tropomi instrument on the Copernicus Sentinel satellite was used to capture the changing atmosphere over Italy.

'It's the most accurate instrument measuring air pollution from space,' he said.

'These measurements, globally available thanks to the free and open data policy, provide crucial information for citizens and decision makers.'


Smog has dropped in northern Italy over a three-week period - February 14 (top left), February 24 (top right), March 4 (bottom left) and March 8 (bottom right) - following a month of coronavirus restrictions. The orange shading shows a heavy concentration of air pollution

Medical staff checks the body temperature of a woman in front of the Molinette hospital in Turin as Italy clamps down on public events and travel to halt spread of the virus

Europe is now the 'epicentre' of coronavirus with more daily cases on the continent than China was suffering at the height of its outbreak, the World Health Organisation said today.

WHO chief Tedros Adhanom Ghebreyesus made the stark assessment today as he bemoaned the 'tragic milestone' of 5,000 global deaths from Covid-19.

He added that Europe now has 'more reported virus cases and deaths than the rest of the world combined, apart from China'.

In Italy, which is already in lockdown, Catholic churches in Rome have now been shut as the Vatican falls in line with the rest of the country.

Football fixtures across Europe have been taking place behind closed doors amid calls for the Euro 2020 tournament to be postponed.

Meanwhile, some European passengers were boarding the last flights to America this morning before Donald Trump's unexpected travel ban comes into force tonight.

Bulgaria's state of emergency involves the shutting of all shops - except food stores and pharmacies - shopping malls, casinos, bars and restaurants with immediate effect until March 29. 


WHAT IS AIR POLLUTION?

Emissions

Carbon dioxide
Carbon dioxide (CO2) is one of the biggest contributors to global warming. After the gas is released into the atmosphere it stays there, making it difficult for heat to escape - and warming up the planet in the process.

It is primarily released from burning fossil fuels such as coal, oil and gas, as well as cement production.

The average monthly concentration of CO2 in the Earth's atmosphere, as of April 2019, is 413 parts per million (ppm). Before the Industrial Revolution, the concentration was just 280 ppm.

CO2 concentration has fluctuated over the last 800,000 years between 180 to 280ppm, but has been vastly accelerated by pollution caused by humans.

Nitrogen dioxide


The gas nitrogen dioxide (NO2) comes from burning fossil fuels, car exhaust emissions and the use of nitrogen-based fertilisers used in agriculture.

Although there is far less NO2 in the atmosphere than CO2, it is between 200 and 300 times more effective at trapping heat.

Sulfur dioxide

Sulfur dioxide (SO2) also primarily comes from fossil fuel burning, but can also be released from car exhausts.

SO2 can react with water, oxygen and other chemicals in the atmosphere to cause acid rain.

Carbon monoxide

Carbon monoxide (CO) is an indirect greenhouse gas as it reacts with hydroxyl radicals, removing them. Hydroxyl radicals reduce the lifetime of carbon dioxide and other greenhouse gases.

Particulates

What is particulate matter?

Particulate matter refers to tiny parts of solids or liquid materials in the air.

Some are visible, such as dust, whereas others cannot be seen by the naked eye.

Materials such as metals, microplastics, soil and chemicals can be in particulate matter.

Particulate matter (or PM) is described in micrometres. The two main ones mentioned in reports and studies are PM10 (less than 10 micrometres) and PM2.5 (less than 2.5 micrometres).


Air pollution comes from burning fossil fuels, cars, cement making and agriculture

Scientists measure the rate of particulates in the air by cubic metre.

Particulate matter is sent into the air by a number of processes including burning fossil fuels, driving cars and steel making.

Why are particulates dangerous?
Particulates are dangerous because those less than 10 micrometres in diameter can get deep into your lungs, or even pass into your bloodstream. Particulates are found in higher concentrations in urban areas, particularly along main roads.

Health impact

What sort of health problems can pollution cause?

According to the World Health Organization, a third of deaths from stroke, lung cancer and heart disease can be linked to air pollution.

Some of the effects of air pollution on the body are not understood, but pollution may increase inflammation which narrows the arteries leading to heart attacks or strokes.

As well as this, almost one in 10 lung cancer cases in the UK are caused by air pollution.

Particulates find their way into the lungs and get lodged there, causing inflammation and damage. As well as this, some chemicals in particulates that make their way into the body can cause cancer.

Deaths from pollution

Around seven million people die prematurely because of air pollution every year. Pollution can cause a number of issues including asthma attacks, strokes, various cancers and cardiovascular problems.


Asthma triggers

Air pollution can cause problems for asthma sufferers for a number of reasons. Pollutants in traffic fumes can irritate the airways, and particulates can get into your lungs and throat and make these areas inflamed.

Problems in pregnancy


Women exposed to air pollution before getting pregnant are nearly 20 per cent more likely to have babies with birth defects, research suggested in January 2018.

Living within 3.1 miles (5km) of a highly-polluted area one month before conceiving makes women more likely to give birth to babies with defects such as cleft palates or lips, a study by University of Cincinnati found.

For every 0.01mg/m3 increase in fine air particles, birth defects rise by 19 per cent, the research adds.

Previous research suggests this causes birth defects as a result of women suffering inflammation and 'internal stress'.

What is being done to tackle air pollution?

Paris agreement on climate change


The Paris Agreement, which was first signed in 2015, is an international agreement to control and limit climate change.

It hopes to hold the increase in the global average temperature to below 2°C (3.6ºF) 'and to pursue efforts to limit the temperature increase to 1.5°C (2.7°F)'.

Carbon neutral by 2050
The UK government has announced plans to make the country carbon neutral by 2050.

They plan to do this by planting more trees and by installing 'carbon capture' technology at the source of the pollution.

Some critics are worried that this first option will be used by the government to export its carbon offsetting to other countries.

International carbon credits let nations continue emitting carbon while paying for trees to be planted elsewhere, balancing out their emissions.

No new petrol or diesel vehicles by 2040


In 2017, the UK government announced the sale of new petrol and diesel cars would be banned by 2040.

From around 2020, town halls will be allowed to levy extra charges on diesel drivers using the UK's 81 most polluted routes if air quality fails to improve.

However, MPs on the climate change committee have urged the government to bring the ban forward to 2030, as by then they will have an equivalent range and price.

The Paris Agreement, which was first signed in 2015, is an international agreement to control and limit climate change. Pictured: air pollution over Paris in 2019.

Norway's electric car subsidies

The speedy electrification of Norway's automotive fleet is attributed mainly to generous state subsidies. Electric cars are almost entirely exempt from the heavy taxes imposed on petrol and diesel cars, which makes them competitively priced.

A VW Golf with a standard combustion engine costs nearly 334,000 kroner (34,500 euros, $38,600), while its electric cousin the e-Golf costs 326,000 kroner thanks to a lower tax quotient.

Criticisms of inaction on climate change

The Committee on Climate Change (CCC) has said there is a 'shocking' lack of Government preparation for the risks to the country from climate change.

The committee assessed 33 areas where the risks of climate change had to be addressed – from flood resilience of properties to impacts on farmland and supply chains – and found no real progress in any of them.

The UK is not prepared for 2°C of warming, the level at which countries have pledged to curb temperature rises, let alone a 4°C rise, which is possible if greenhouse gases are not cut globally, the committee said.

It added that cities need more green spaces to stop the urban 'heat island' effect, and to prevent floods by soaking up heavy rainfall.