Showing posts sorted by date for query GAINERS. Sort by relevance Show all posts

Monday, April 29, 2024


Further thoughts on the economics of imperialism

Over the last 50 years… the imperialist bloc is unchanged and increasing its extraction of wealth income from the rest – and that includes the likes of China, India, Brazil and Russia. In that sense, these BRIC countries cannot be considered even sub-imperialist, let alone imperialist.
Michael Roberts

While many comment on the shifting balance of power in the global economy, over a century after the first analyses of imperialism Michael Roberts argues that the same imperial powers continue to exploit the rest of the world.

Back in 2021, Guglielmo Carchedi and I published a paper in Historical Materialism called The Economics of Modern Imperialism.  The paper focused exclusively on the economic aspects of imperialism. We defined that as the persistent and long-term net appropriation of surplus value by the high-technology advanced capitalist countries transferred from the low-technology dominated countries.  We identified four channels by which surplus value flows to the imperialist countries: currency seigniorage; income flows from capital investments; unequal exchange (UE) through trade; and changes in exchange rates.

We did not deny other aspects of imperialist domination of the majority of world i.e. in particular, military power and political control of international institutions (UN, IMF, World Bank etc) and the power of ‘international diplomacy’.  But in the paper we focused on the economic aspects, which we argued was the ultimate determining factor driving these other extremely important, but determined traits, like military and political domination, as well as cultural and ideological pre-eminence.

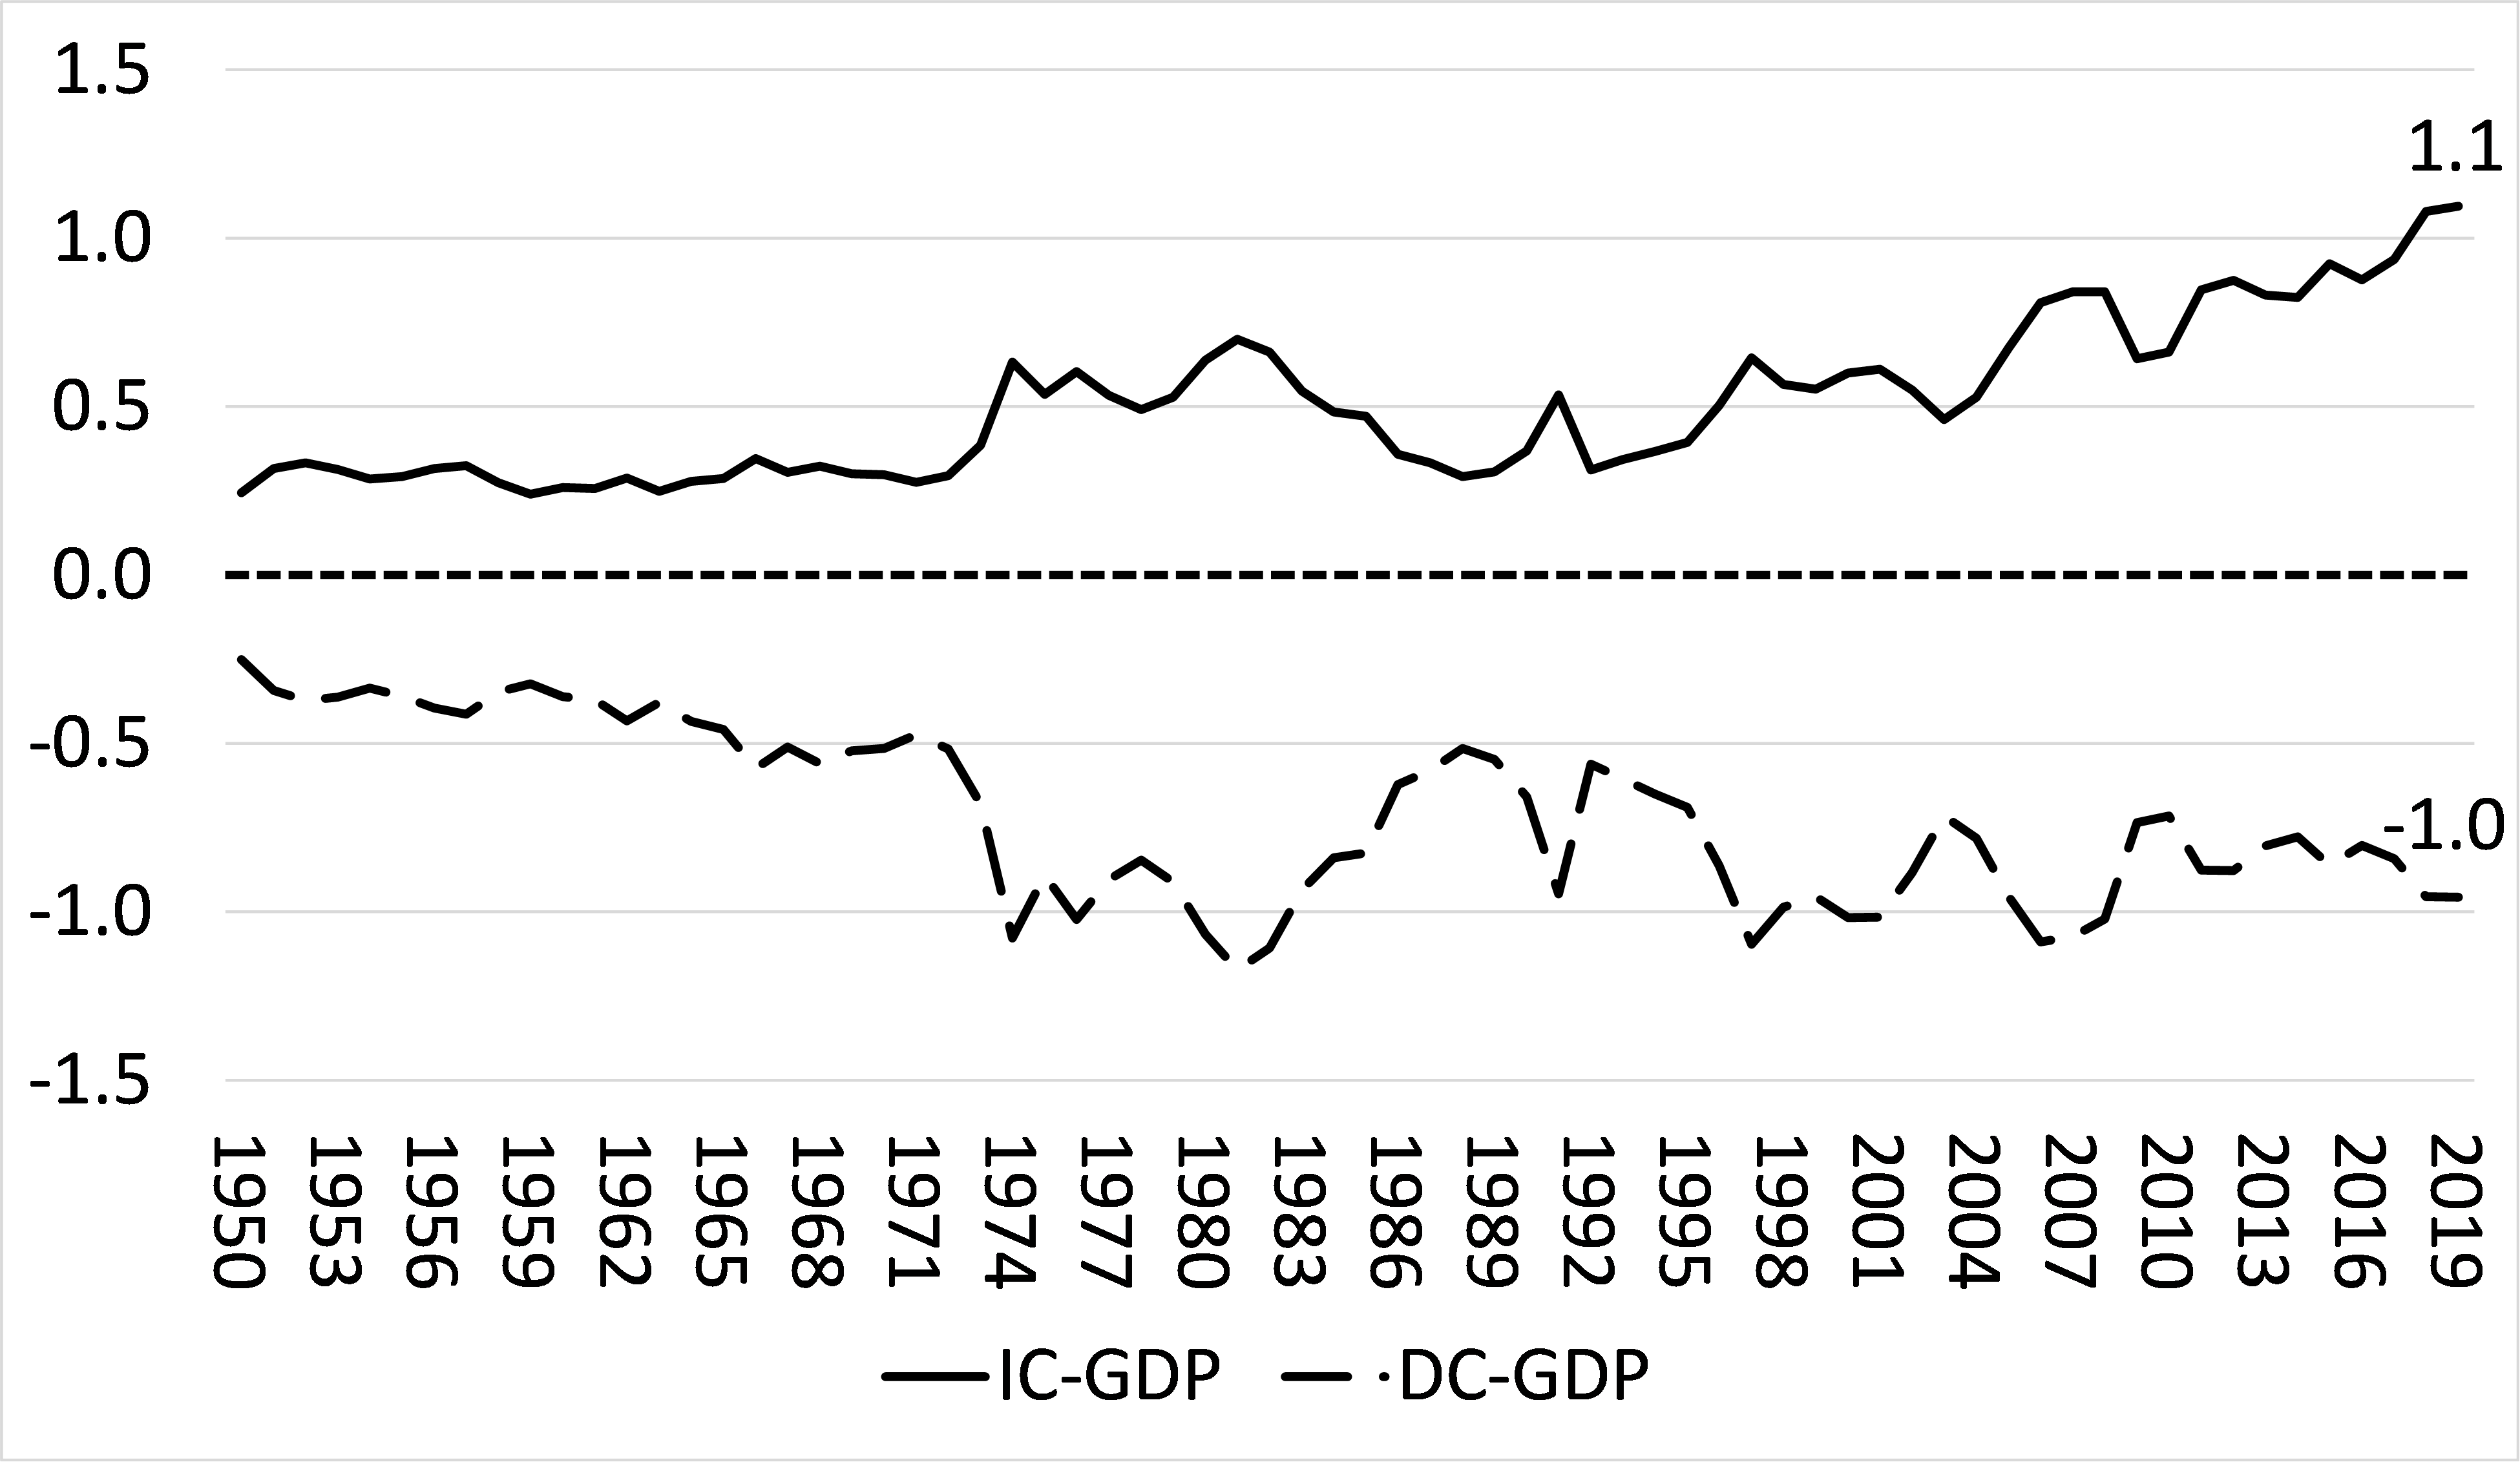
In that paper, we paid particular attention to the quantification of unequal exchange (UE) i.e the transfer of surplus value through international export trade.  We used two variables in our analysis of UE: the organic composition of capital and the rate of exploitation, and we measured which of these two variables was more important in contributing to UE transfers. 

We found that since the end of WW2, the imperialist bloc (IC) annually got around 1% of their GDP through the transfer of surplus value in international trade from the rest of the major ‘developing’ economies (DC) in the G20; while the latter lost about 1% of their GDP in surplus value transferred to the imperialist bloc. And these ratios were rising.

The other large area of transfers of income came from the international flow of profits, interest and rent appropriated by the imperialist bloc from their investment in assets, both tangible and financial, in the periphery.  We measured this from the net flows of profits, interest and rent to the imperialist bloc – what the IMF calls net primary credit income – compared to those of the rest of the G20.

For this post, I decided to update that aspect of economic domination by first comparing the gross primary credit income flows for the G7 and BRICS economies.  I just looked at the years of the 21st century.  The gross income flows to the G7 are now seven times greater than those received by the BRICS.

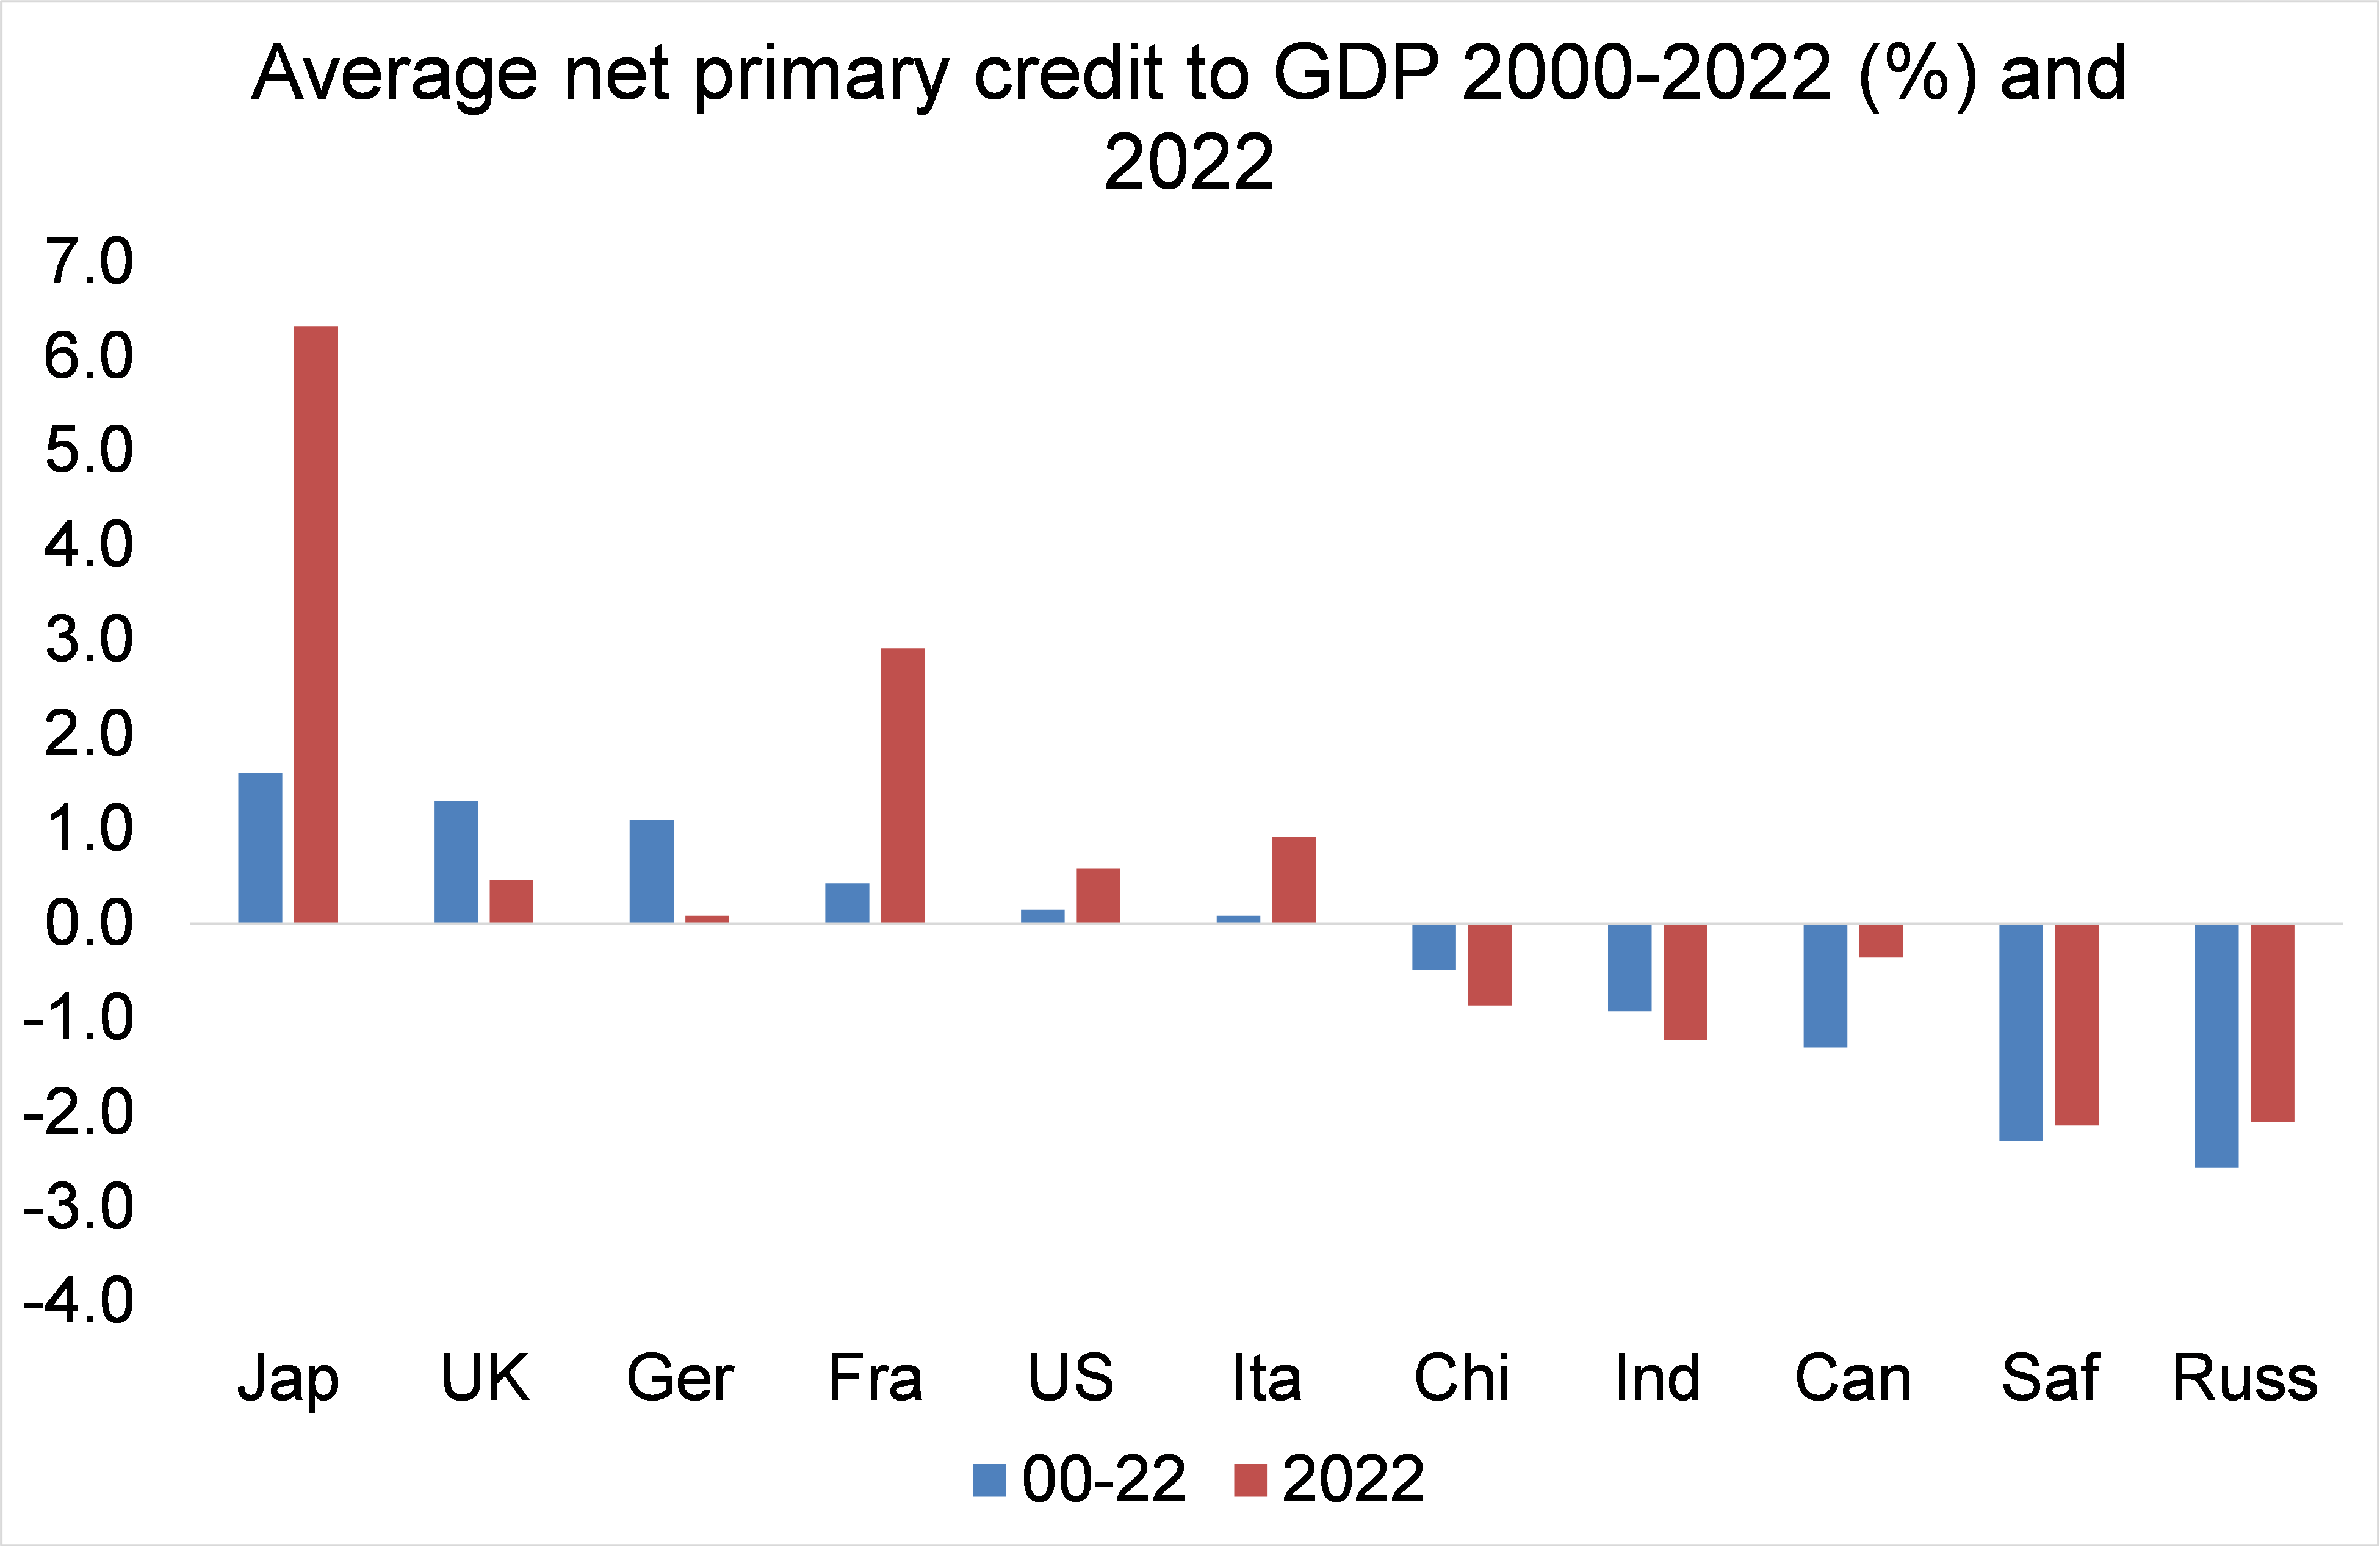
What I also found was that after accounting for the debits ie income flowing out, the NET position was even starker.  The annual net flow of income to the G7 economies was around 0.5% of G7 GDP.  Indeed, the top five imperialist economies (G5) obtained a staggering 1.7% of their annual GDP from such net inflows.  In contrast, the BRICS economies lost 1.2% of their GDP a year in net outflows.

If you look at the net income flows for each G7 and BRICS countries, the biggest gainers over the last two decades have been Japan with its huge foreign asset holdings and the UK, the rentier centre of financial circuitry.  Those BRICS countries that have lost the most (as a share of their GDPs) have been South Africa and Russia.

Now, if you add in the 1% of GDP gain/loss in income from international trade described above, then the imperialist bloc benefits by some 2-3% of GDP each year from exploitation of the BRICS, the major economies of the ‘Global South’ – in effect equivalent to their average annual growth in real GDP in the 21st century.

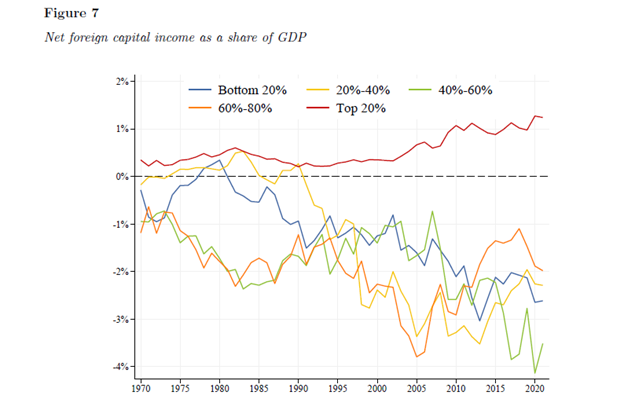
The World Inequality Database (WID), the Paris-based group of ‘inequality’ economists including Thomas Piketty and Daniel Zucman, has just published a deep analysis of what they call the ‘excess yield’ obtained the rich imperialist bloc on assets held abroad.  The WID finds that gross foreign assets and liabilities have become larger almost everywhere, but particularly in rich countries, and foreign wealth has reached around twice the size of the global GDP, or a fifth of the global wealth. The imperialist bloc controls most of this external wealth, with the top 20% richest countries capturing more than 90% of total foreign wealth.  The WID also included the wealth hidden in tax havens and the capital income accrued from it.   

The excess yield is defined as “the gap between returns on foreign assets and returns on foreign liabilities”.  The WID finds that this has increased significantly for the top 20% richest countries since 2000.  Net income transfers from the poorest to the richest is now equivalent to 1% of the GDP of top 20% countries (and 2% of GDP for top 10% countries), while deteriorating that of the bottom 80% by about 2-3% of their GDP.  These results are pretty similar to the results that I got for net credit income flows above.

What was striking to us in our original paper was that the imperialist bloc of countries as we defined it in 2021 was virtually the same as those advanced capitalist economies that Lenin identified as the imperialist grouping in 1915 – around 13 countries or so.  There had hardly been any additions to the club – it was closed to new members.  Emerging capitalist economies in the last century were condemned to domination by the imperialist bloc.  This new study by the WID confirms that conclusion.  Over the last 50 years in their survey, the imperialist bloc is unchanged and increasing its extraction of wealth income from the rest -and that includes the likes of China, India, Brazil and Russia.  In that sense, these BRIC countries cannot be considered even sub-imperialist, let alone imperialist.

That brings me to a few thoughts on the issue of super-exploitation.  Super-exploitation has been defined as where wages are so low that they are below the value of labour power, ie the amount of value necessary to keep workers functioning and reproducing sufficiently to continue to work.  Workers with wages and benefit levels below that are paupers in effect.  It has been argued that this is the major feature of imperialist exploitation of the Global South. Wages are so low there that they are below the value of labour power.  It is super-exploitation that enables the imperialist multi-nationals to make their super profits in trade, invoicing and investment income.

In our original paper, we questioned whether ‘super-exploitation’, which no doubt exists, was necessarily the major driver of surplus value transfer from the poor countries to the rich.  In our view, the mechanism of capitalist exploitation and surplus value transfer was doing the job without having to resort to super exploitation as the main cause. 

Moreover, international super-exploitation implied that there was some average international wage level that could act as a gauge of the value of labour power globally. But while there are international market prices for export goods and services, there is no international wage.  Wages are very much determined by the balance of power between capitalists and workers in each country.  Sure, there are international pressures and domestic capitalist companies in the Global South competing in world markets against much more technologically advanced companies in the imperialist bloc can often only survive by driving down wages for their workers.  But that means the rate of surplus value or exploitation rises to compensate for the loss of surplus value in international trade with the imperialist companies given their more productive technologies. 

Indeed, in our original paper, we found that it was a combination of the two factors: better technology lowering costs per unit for the rich economies; plus a higher rate of exploitation in the poorer countries that contributed to that 1% of GDP annual transfer of profits from the BRICS to the imperialist club.  We found that it was about 60:40 for the contribution of more productive technology against higher rates of exploitation in the transfer of surplus value from the poor to rich countries..

Could we measure whether the transfer of value is due to ‘super-exploitation or not?  One way would be to look at national poverty wage levels.  They vary sharply across countries and between rich and poor countries.  If these levels can be considered the tipping point of wages above or below the value of labour power, then the percentage of workers in both rich and poor countries earning less than these national levels could be considered to be ‘super-exploited’.

The point here is that there are also workers in the imperialist ‘rich’ economies that are ‘super-exploited’ by this criterion.  And in turn, there are many workers in the poor countries that are earning above their national poverty wage levels. 

Look at the poverty wage levels for the G7 and BRIC economies that I calculated from World Bank sources.  Based on the ratio of workers earning less than the poverty wage rate in their respective countries (as provided by the World Bank), I reckon that roughly 5-10% of G7 workers are being ‘super-exploited’, while in the BRICS it’s about 25-30%.  But that still means that 70% of workers in the BRICS, while earning way less per day than G7 workers, are not earning below the value of their labour power on a national basis.  Exploitation of workers in the Global South is huge, but super-exploitation as such is not the main cause.

In sum, what these new studies confirm is that imperialism can be quantified in economic terms: it is the persistent transfer of surplus value to the rich countries from the poorest countries of the world through unequal exchange in international trade and through net flows of profits, interest and rent from investments and wealth owned by the rich countries in the poor countries.  This process developed some 150 years or so ago and remains.


  • This article was originally published on Michael Roberts blog, The Next Recession, on 23 April 2024
  • Michael Roberts is an experienced economist and activist writing from a Marxist perspective.

Saturday, March 09, 2024

“Austerity is a political choice, not an economic necessity” – Jeremy Corbyn exclusive on #Budget24

“Today’s budget exposes a government that is blind to the scale of the crises we face. While private companies are taking home more profit than ever before, more than 4 million children live in poverty.”

Jeremy Corbyn MP

Jeremy Corbyn MP writes for Labour Outlook on #Budget24.

“Austerity is a political choice, not an economic necessity.”

This is what we said back in 2015, five years into a devastating programme of cuts and privatisation. We knew that austerity would decimate our public services, plunge millions into poverty and send our country into economic decline. It was true then – and it is true now.

Today’s budget exposes a government that is blind to the scale of the crises we face. While private companies are taking home more profit than ever before, more than 4 million children live in poverty. A quarter of a million people are homeless, while millions more languish on social housing waiting lists. Our NHS is on its knees after decades of austerity and privatisation.

Perhaps most alarmingly, we are sleepwalking toward a climate emergency. Make no mistake, the climate crisis is here, and we are running out of time to avoid total catastrophe. People in the Global South are already suffering the worst consequences – more and more people in this country will experience the devastating effects of air pollution, heatwaves and flooding.

The Tories’ economic experiment has failed – and they should not get off lightly. Parroting the language of austerity is a grave mistake, and represents a missed opportunity to bring about the transformative change this country needs. When there are more billionaires in this country than ever before, the idea that we cannot afford to build a fairer and greener society is absurd. We have the means to end poverty, pay our workers properly and save the planet. We just need the political will.

Millions of us still believe in a real alternative.

One that funds a fully-public NHS; austerity and privatisation are the causes of – not the solutions to – the healthcare crisis.

One that introduced rent controls and builds social housing; we will never tackle the housing emergency until we treat housing as a human right, and embark upon a huge council house-building programme.

One that invests in a Green New Deal to transform the economy and create thousands of green, unionised jobs.

One that scraps the 2-child benefits cap; this cruel and callous policy is a moral disgrace, and we could pay for the abolition of this policy seventeen times over with a 1-2% wealth tax on people with assets over £10 million.

One that brings energy, water, rail and mail into public ownership; privatisation has been a total disaster, and it’s time we stood up to the companies holding our country to ransom.

Our economy is not just broken. It is rigged in the interests of the few – and unless we fundamentally rewrite the rules of our economy, nothing will change. There’s nothing fiscally responsible about plunging millions of people into poverty or destroying our natural world. Why can’t we have the courage to campaign for a more joyful, equal and sustainable future?

As the MP for Islington North, I will continue to campaign alongside my community for a redistribution of wealth and power. For an economy that puts human need before corporate greed. For a society that cares for each other and cares for all.


Why Jeremy Hunt’s budget fails Britain

The evidence of past policy failures is all around us. Since 2010, the real economy has grown by around 1.2% a year and is set to have the weakest growth amongst G7 countries.


Columnists
Left Foot Forward 
Opinion
7 March, 2024 


Every year, the UK parliament enacts a pantomime with deadly consequences. A man with a red box (might as well be a red nose) and known as the Chancellor, ritually promises to eradicate poverty, redistribute income and wealth, rejuvenate the economy and public services, and increase people’s prosperity and happiness. Instead for the last 14 years he has delivered, lower living standards, worse public services, crumbling infrastructure and transferred wealth from the masses to the rich. This year’s budget statement is no different.

Calamitous Policies

The evidence of past policy failures is all around us. Since 2010, the real economy has grown by around 1.2% a year and is set to have the weakest growth amongst G7 countries. The real average wage is unchanged since 2007 and Britons have faced the biggest fall in livings standards since the records began. The richest 1% of the population has more wealth than 70% of the population combined whilst 14.4m live in poverty. UNICEF reported that child poverty levels in the UK have risen by 20% in recent years, and the UK is ranked 39th out of 39 relatively well-off countries.

Deprived of good food, housing and healthcare, British children are up to 7cm shorter than their European counterparts. Malnutrition, scurvy and rickets have returned. A major reason for huge social disparities is that income from wealth, such as capital gains, is taxed at the rates of 10%-28% whilst wages are taxed at the rates of 20%-45%. In addition, national insurance contribution (NIC) at the rate of 10% is payable on wages between £12,570 and £50,270, and 2% above that. Recipients of capital gains, dividends and other forms of investment income do not pay any NIC.

Dwindling household incomes have led to lower investment in productive assets. The overall investment rate in the UK fell from a high of around 23% of GDP in the late 1980s to around 17% from 2000 onwards, compared to an average of 22% for the EUPublic investment in new industries has fallen from an average of 4.5% of GDP between 1949 and 1978 to 1.5% between 1979 and 2019. Public buildings are literally crumbling, there is a huge teacher shortagelocal councils are going bankrupt and are cutting services, and 7.1m adults in England have very poor literacy skills. Roads are full of potholes. Hospitals in England have a waiting list of 7.6m appointments and 300,000 a year die whilst waiting for that appointment. 2.8m are chronically ill and unable work. People struggle to see a family doctor or find a dentist. This has a negative effect on productivity.

Disappointing Budget

Against the above background, the budget statement is disappointing. The erosion of disposable incomes continues. In March 2021, the government froze tax free personal allowance at £12,570 and income tax thresholds with the result that 40% marginal rate kicks in at £50270 and 45% marginal rate at £125,140. One consequence is that in an inflationary environment is that 4.2m more workers now pay income tax. If nothing changes by 2028-29 another 3.7m workers will be forced to pay income tax at basic rate of 20%, another 2.7m at 40% and another 200,000 at 45%. Due to frozen tax thresholds, the government will collect another £41.1bn a year.

The Chancellor has handed a few crumbs to the masses in the shape of a 2p cut in the headline rate of national insurance, reducing it from 10% to 8%. It will cost around £10.2bn a year. Someone on median wage of around £29,600 will take home extra £341 year, easily wiped out by higher council tax, energy and household bills and higher income tax due to frozen thresholds. People earning £19,000 a year will be worse off as tax rises due to frozen thresholds will exceed cut in national insurance. Some 17.8m adults with annual income less than £12,570 will receive no benefit.

Due to fiscal drag pensioners will be forced to pay income tax on low incomes, as well as higher council tax, food and energy bills. The projected hit on pensioners is around £8bn. Real value of benefits is not protected so millions of workers relying upon universal credit to top-up their low wages will face real cuts.

The middle and higher income families, most likely to vote Conservative, are the major gainers. The higher rate of capital gains tax on residential property disposals has been cut from 28% to 24%. Owners of multiple properties will be the main beneficiaries of the tax break worth around £600m.

The high-income child benefit threshold will be increased from £50,000 to £60,000 with a taper extended to £80,000. Nearly 500,000 families with children would benefit by around £1,300 next year. In sharp contrast the two-child benefit cap which hits the poorest, depriving 402,000 families of around £3,200 a year is to be retained.

The International Monetary Fund (IMF) has urged the government to shun tax cuts called for greater investment in public services and infrastructure but that is not what the government has done. Green investment is missing altogether from the budget. The Chancellor has promised £3.5bn to replace the NHS IT system and claims that this will somehow generate savings of £35bn. Another £2.5bn top-up will largely meet the pay settlements. There is little or nothing extra for expansion of the NHS or appointment of additional doctors and nurses to reduce the 7.76m hospital appointment queue in England.

Tax cuts for higher income earners are financed by borrowing and cuts in public spending of around £19bn and will hammer councils, police, courts, justice, border checks and transport. Services will be cut and public sector workers face prospects of further real pay cuts. Potholes in roads will become a way of life.

The Chancellor soothed public anxieties by claiming that the UK is on track to become the world’s next Silicon Valley. However, he was silent on how this is to be achieved when there are severe skills shortages and due to low pay many academics are migrating to other countries. Last year, the government announced a package of $1.2bn (£1bn) investment into the vital semiconductor industry compared to $50bn by the US, $40bn by China and $10bn by India.

Instead of investment the government has launched a gimmick – a British ISA. This nationalistic gesture will enable some to invest £5,000 a year in secondary UK stocks and shares for a tax free return. This will be beyond the reach of million as 34% of UK adults have savings of less than £1,000. Not a penny of the amounts put in the British ISA will go directly into investment in productive public or private assets though bankers and financial intermediaries will gain.

The budget is silent about value for money for the billions handed to private companies in subsidies. For example, Drax has received £6.2bn subsidy and set to receive another £4.2bn. Rail companies have received £75bn subsidy in the last decade and in return people don’t own a single railway engine or carriage.

On the face of it, the government is helping small traders raising the VAT registration threshold from annual turnover of £85,000 to £90,000. But nothing has been done to simplify rules. Here are some nightmare examples: toilet rolls have a VAT of 20% but caviar is zero-rated. Potato crisps have 20% VAT but prawn crackers and tortilla chips are zero-rated. Cakes and biscuits are zero-rated but if they are wholly or partly covered in chocolate then taxed at the standard rate of 20. There is 0% VAT on unshelled nuts but 20% VAT on shelled nuts with the exception of peanuts even when they are out of their shells. Roasted and salted nuts are subject to 20% VAT but toasted ones can be VAT free.

Overall, the budget hits pensioners and average families and transfers wealth from the less well-off to the rich. It is likely that the government will try to boost its dwindling electoral fortunes in autumn with a tax cut, but it has consistently failed to address deeper economic problems. The economy can’t be revived by cutting purchasing power of the masses and by strangling public investment.

The budget also poses major challenges for the Labour Party, the official opposition in parliament. It had promised not to increase capital gains tax, corporation tax or levy any wealth taxes. It pinned its hopes on somehow securing growth but that looks forlorn without major investment or rebalancing the tax system in favour of the masses. It had modest proposals for raising additional tax revenues by reforming non-dom taxation, levying 20% VAT on private school fees to raise around £1.7bn, and reforming the taxation of “carried interest” at private equity to raise around £600m a year. Now the government has pre-emptied the non-dom taxation reform which it claims will raise £2.7bn in 2026/27. This leaves Labour with £2.3bn of tax raising initiatives, nowhere enough to rebuild the economy or redistribute. It will need to revisit the entire issue of taxation, public spending and economic management.


Prem Sikka is an Emeritus Professor of Accounting at the University of Essex and the University of Sheffield, a Labour member of the House of Lords, and Contributing Editor at Left Foot Forward.

Thursday, February 22, 2024

MONOPOLY CAPITALI$M

USA, Singapore, UK, Canada and Germany make up top five in latest annual index of the most attractive Mergers & Acquisitions markets


USA retains top spot in Bayes Business School M&A markets annual index - but India, Russia and China among nations to drop down the league table


CITY UNIVERSITY LONDON


The United States remains the most attractive destination globally for inbound and domestic mergers and acquisitions (M&A) investment, according to the annual index published by Bayes Business School (formerly Cass), City, University of London today.

The country scored 73 per cent in the latest index – four points ahead of second-placed Singapore, and six points more than the UK in third.

Canada dropped one place to fourth out of the 148 nations measured by Bayes’ Mergers and Acquisitions Research Centre (MARC).

Germany, France, South Korea, The Netherlands, Norway and Australia complete the top ten.

The index assesses countries against 19 indicators, ranging from political stability and roads to access to financing and demographics.

Co-author Dr Naaguesh Appadu, Research Fellow at Bayes, said: “Most governments are dealing with multiple challenges, all of which affect their local and in-bound M&A markets. Many, for example, are grappling with achieving monetary policy stability to control inflation. At the same time they need to understand and support investment in the tech sector through ongoing innovation, technology advancements and workforce development, particularly in field of AI, which also has critical impacts on productivity and the economy.

“With the high cost of capital, acquirers are shifting their focus towards smaller mid-market transactions. These deals are easier to execute, less risky to finance and potentially more feasible given current financial conditions.”

The USA has topped the MARC M&A Attractiveness Index Score (MAAIS) since it was first published in 2009. The index records both annual movements up and down the league table and movements over five years.

Other headlines from the latest index include:

  • While Germany and France both remain in the top ten, since 2018 Germany has slipped two places while France rose one place. China, in 14th position, fell two places last year and is down three places on 2018.
  • India has risen nine places to 40th since 2018, despite falling five places last year.
  • Russia, perhaps unsurprisingly, fell 18 places last year to 55th.
  • Other big movers inside the top 50 last year include Cyprus (up 11 to 42nd) and Denmark, Latvia, Oman and Kazakhstan – all of which rose ten places.

The big gainers over the five year period included Saudi Arabia (up 14 places to 44th), the Philippines (up 13 to 47th), Oman (up ten places to 49th) and Thailand (up 12 to 29th).

The report also analyses what the indicators tell governments, firms and investors about the challenges and opportunities facing each nation. In recent years, for example, environmental, social and governance (ESG) considerations have become increasingly important for investors considering a deal, as has the presence of strong national infrastructure.

Dr Appadu said: “As the global economy continues to recover from a series of massive shocks, the nature of both the opportunities and challenges facing different countries face varies widely. This year, the biggest market challenge for nine of the countries in the top ten – including the United States – are socio-economic factors around demographics. 

“By contrast, the nature of the main market opportunities and strengths in the top ten is more diverse: in six – including the USA – it is the strong infrastructure and assets, with two benefitting from strong ESG and two from their political and regulatory environment.”

Thursday, February 01, 2024

EU Breaks Deadlock on €50 Billion for Ukraine After Orban Caves

Alberto Nardelli, Jan Bratanic and Ellen Milligan
Thu, February 1, 2024 


(Bloomberg) -- European Union leaders clinched a deal on a €50 billion ($54 billion) financial aid package for Ukraine after Hungarian Prime Minister Viktor Orban caved to their demands and lifted his veto.

The agreement proves “that we stand by Ukraine and I think it will be an encouragement for the US also to do their fair share,” Ursula von der Leyen, European Commission president, said after the meeting in Brussels as US funding remains stalled in Congress.

As part of the accord, the member states agreed to debate the implementation of the Ukraine aid package every year and, “if needed,” the commission, the bloc’s executive body, could be asked to propose a review in two years. Orban’s demand for a veto was dropped.

The agreement was salvaged in a morning gathering Orban had with Chancellor Olaf Scholz, French President Emmanuel Macron and Italian Prime Minister Giorgia Meloni, according to people familiar with the meeting. Leaders at the extraordinary summit — some of whom accused Orban of “blackmail” — had braced for a deadlock after weeks of negotiations produced no result.

The moment is crucial for Ukraine, which has warned that its coffers are emptying as it grapples with a shortage of weapons to fend off the Russian military campaign. Kyiv is still awaiting more than $60 billion in assistance from the US, yet to be backed by Congress.

“We negotiated a review mechanism that guarantees that the money will be used rationally,” Orban said in a Facebook video after the agreement was reached. He also hailed the positive market reaction to the deal.

Thursday’s breakthrough avoided a messy split within the EU, papering over mounting concern that Western support for Kyiv is splintering. It also marks a significant boost for Ukrainian President Volodymyr Zelenskiy. The bloc’s leaders said the breakthrough should send a signal to Washington, where funds proposed by President Joe Biden are being held up over a fight with Republican lawmakers.

“The American president is a truly good friend and ally who’s trying to get approval in Congress,” Scholz told reporters after the meeting. “I hope that today’s message will help him to have it a bit easier at home for his agenda.”

Hungary’s forint gained 0.2% against the euro, reversing a drop earlier in the session. Ukraine’s international bonds were the top gainers across emerging-market dollar debt Thursday, with the Ukrainian dollar note due in Sept. 2034 up more than 1 cent on the dollar to 24.2 after the deal.

The agreement hinged on Orban, who angered his counterparts in the 27-member bloc by stonewalling a pillar of Europe’s security strategy aimed at containing Russian President Vladimir Putin. EU leaders made little effort to veil their frustration at the 60-year-old Hungarian leader.

“Viktor definitely wants to be the center of attention every time we’re here, but it shouldn’t be like this,” Estonian Prime Minister Kaja Kallas told reporters earlier Thursday. “I don’t want to use the word ‘blackmail,’ but I don’t know a better word.”

Ukraine’s weapons inventories are diminishing as Russia’s invasion heads into a third year. Reports from the frontlines suggest Ukraine is struggling to hold Russian forces back, while an ugly dispute has broken out between Volodymyr Zelenskiy, and his commander-in-chief, Valeriy Zaluzhnyi — heightening the sense of crisis in Kyiv.

Ukrainian Defense Minister Rustem Umerov sent a sharp warning to his EU counterparts this week that his country’s forces are now out-gunned three to one by the Russians. In a letter seen by Bloomberg, he added that Kyiv needs at least 6,000 artillery rounds daily, but is unable to shoot more than 2,000 shells along a 1,500-kilometer (932-mile) front.

The EU is still withholding two-thirds of the more than €30 billion in EU funding for Hungary on rule-of-law and graft concerns. Continued obstructionism also threatened to jeopardize Hungary’s rotating EU presidency from July and potentially scupper the bloc’s agenda in the second half.

Adding to the tense atmosphere inside the EU’s summit are protests by farmers, who staged a demonstration nearby — with Brussels’ city center full of tractors parked near EU institutions — to protest the bloc’s green policies and trade liberalization measures.

Some of the protests, which have spread across Europe over the past months, have been supported by organizations with ties to Orban.

--With assistance from Lyubov Pronina, Ewa Krukowska, Max Ramsay, Maria Tadeo, Katharina Rosskopf, Andras Gergely, Piotr Skolimowski, Natalia Ojewska, Milda Seputyte, Natalia Drozdiak, Jorge Valero, Samy Adghirni, Stephanie Bodoni and Zoltan Simon.

(Updates with comments encouraging US to move on funding, Ukrainian bonds, from second paragraph.)

Most Read from Bloomberg Businessweek

Biden appears to have found a workaround to the GOP Ukraine aid block — routing weapons via Greece


Tom Porter
Wed, January 31, 2024 

Ukraine's President Volodymyr Zelenskyy gestures as he thanks MPs after his virtual address to the Greek Parliament in Athens on April 7, 2022.LOUISA GOULIAMAKI

Joe Biden is sending weapons to Greece, which is then sending its own to Ukraine.


Greece is reported to have missile-defense systems vital for Ukraine.


Republicans in Congress are blocking a large Ukraine aid bill.

Joe Biden appears to have found a way around the Republican Party's blockade of Ukraine aid using a little-known presidential power.

In a letter to Greek Prime Minister Kyriakos Mitsotakis, reported by Greek media, Secretary of State Antony Blinken said the US would send Greece a batch of weapons and equipment free of charge under the Excess Defense Articles law.

The rule states that the US president can authorize the transfer of weapons deemed to be surplus to US requirements to other countries for little or no money.

Under the deal, the US will send Greece two C-130H aircraft, 60 Bradley armored fighting vehicles, 10 engines for P-3 patrol planes, three Protector-class ships, and a consignment of transport trucks. That's in addition to selling Greece a fleet of 40 F-35 fighter jets for $8 billion.

The transfer was first reported by Forbes, citing Greek media reports.

But as a condition of the transfer, Blinken said, Greece should explore ways of providing weapons from its own arsenal to Ukraine, with Greek daily Kathimerini reporting that Greek military leaders have privately agreed to do so.

"We continue to be interested in the defense capabilities that Greece could transfer or sell to Ukraine," Blinken writes, and dangled the prospect of new, lucrative weapons deals if Athens agrees.

"If these capabilities are of interest to Ukraine, and pending an assessment of their status and value by the US government, we can explore opportunities for possible additional Foreign Armed Forces Financing of up to $200 million for Greece."

According to the report, Greece has weapons such as the S-300 missile-defense systems and Hawk surface-to-air missiles that would prove valuable to Ukraine in its war against Russia.

Kurt Volker, a former US Special Representative for Ukraine Negotiations, wrote for the European Center for Policy Analysis recently that the Excess Defense Articles law was one of a number of tools available to Biden to keep weapons to Ukraine flowing.

But, said Volker, "none of these are ideal," and the best way to get Ukraine the support it requires is to pass a new Ukraine aid bill.

"These improvisations will not produce enough equipment or money to sustain Ukraine's war effort," noted Mark Cancian of the Center for Strategic and International Studies, of the Excess Defense Articles law and related measures, though can help plug equipment shortages.

To deal comes as Republicans in the House of Representatives continue to block a $66 billion aid package to Ukraine, amid partisan squabbling over linked border security measures.

The value of weapons that can be transferred under the Excess Defense Articles law is capped at $500 million.

According to reports, Ukraine is running low on vital supplies of ammunition and equipment as it battles a Russian offensive.

Tuesday, January 16, 2024


Samsung leads again in U.S. patents while Qualcomm leaps into second place; overall grants dip 3.4%


New 2023 patent data rankings highlight escalating areas of R&D activity, according to an annual patent study by Digital Science company IFI CLAIMS


Reports and Proceedings

DIGITAL SCIENCE

IFI CLAIMS 2023 rankings - video 

VIDEO: 

NEW 2023 PATENT DATA RANKINGS HIGHLIGHT ESCALATING AREAS OF R&D ACTIVITY, ACCORDING TO AN ANNUAL PATENT STUDY BY DIGITAL SCIENCE COMPANY IFI CLAIMS.

view more 

CREDIT: DIGITAL SCIENCE / IFI CLAIMS.


New Haven, Conn., Jan. 9, 2024—U.S. patent grants declined 3.4% from 2022, the lowest level since 2019, and Samsung held onto the top spot for the second year in a row according to IFI CLAIMS Patent Services, world leader in tracking patent application and grant data.

IFI CLAIMS Patent Services is a Digital Science company that compiles and tracks data from the U.S. Patent and Trademark Office (USPTO) and other patent-issuing agencies around the globe. IFI translates its world-leading data into an annual U.S. Top 50 and IFI Global 250 patent rankings, providing valuable insights into companies’ R&D activity.

Other findings in IFI’s latest rankings include patent powerhouse chipmakers rising higher in 2023 and a new all-time high in U.S. patent applications. Qualcomm ascended into second place, while TSMC rose to third—according to the 2023 U.S. Top 50 Ranking—ahead of IBM, which had previously held the top spot for 29 years running, until last year when it was unseated by Samsung. U.S. patent applications turned up in 2023 to 418,111, a slight rise over 2022, but a new record, nonetheless.

“The backlog for patent applications at the USPTO has been growing over the last couple of years,” said Ronald Kratz, CEO of IFI CLAIMS Patent Services. “They now have more than 750,000 unexamined applications, which could explain why grants are down. But applications are at an all-time high, an encouraging sign of innovation in the U.S.”

To see the yearly rankings, trends, and insights published today from the world’s most trusted patent data provider, visit the IFI website.

An overview of IFI’s analysis:

  • 2023 Top 50, a list of the leading 50 recipients of U.S. grants
  • 2023 Global 250, a ranking of the largest active patent holders around the world
  • analysis of the Top 10 Fastest Growing Technologies, measured by patent application activity over the past five years


New 2023 patent data rankings highlight escalating areas of R&D activity, according to an annual patent study by Digital Science company IFI CLAIMS.

CREDIT

Digital Science / IFI CLAIMS

More patents to U.S. companies; fewer to companies in Japan, South Korea, China

The USPTO awarded slightly less than half of the total patent pie to U.S.-based companies, which was up 4.8% from the previous year. American corporations earned 149,522 patents, nearly four times as many as Japan (39,228), in second place. South KoreaChina, and Germany finished out the top five, all of them showing decreases in awards over the previous year. Japan (-15.6%), China (-12.5%), and Germany (-15%) dropped dramatically. As a result of China’s decline, it fell back down to fourth place from its third-place perch the previous year. Of the top ten countries earning patent grants, only the U.S., Taiwan, and Canada saw increases in 2023 over 2022.

Rank and patent filings

While Samsung retained its number one ranking, U.S. patent awards for the company decreased by 1.3% to 6,165 from 6,248 last year. Qualcomm climbed five rungs into second place with 3,854 patents, an increase of 47% over the previous year. And TSMC comes in third with 3,687 patents, up 22%. IBM’s ranking ticked down as its patent numbers declined in 2023 to 3,658 from 4,398 the previous year—a result of the company’s continued implementation of a strategy toward “more selective” patenting.

The biggest gainers in rank were VMWare, (+63), Snap (+34), and Capital One (+21). The most dramatic decline was recorded by HP (-25) as patent grants were cut in half compared to 2022. A side note for stock watchers following The Magnificent Seven, the tech companies Alphabet, Amazon, Apple, Meta, Microsoft, Nvidia, and Tesla that were responsible for the lion’s share of the S&P 500’s breathtaking surge: just four of them made IFI’s Top 50 cut.

“Intangible assets are becoming more and more valuable corporate holdings, but the balance sheet doesn’t exactly capture that,” said Kratz. “That’s why it’s important to dig into the details of the patent position for highly innovative companies.”

Fastest Growing Technologies: autonomous vehicles ride again

The fastest growing technology in 2023 is Autonomous Vehicles, which rose 38.3% over the past five years—the second year in a row that this technology has taken the pole position. IFI’s ranking is based on patent applications—a proxy for what is around the bend—and Toyota, Honda, and Waymo are the companies paving the way in the autonomous arena. Other technologies that are growing quickly: both electrical smoking devices (CAGR 35.8%) and conventional cigarettes (CAGR 23.2%), quantum computing (CAGR 23.5%), and laundry control systems (CAGR 21.6%).

“Unlike our other rankings, the Top 10 Fastest Growing Technologies is based on a five-year growth rate, not high patent count,” said Kratz. “It’s more of a window into which technologies are attracting R&D attention right now and which companies stand to benefit in the future from patent protection in those spaces.”

For active inventions, Panasonic and Japan remain on top

In 2023, Japanese electronics company Panasonic held first place on IFI’s Global 250 list with 94,337 patent families, followed by Samsung and Hitachi. A patent “family” is a term used to represent the group of patents held around the world to protect a single invention. As such, “family” is used to denote a single invention.

The number of Japanese companies holding spots on the list is 36.4%, more than a third. The U.S. and China each occupy roughly 20% of the placements with 52 and 51 companies, respectively. No U.S. company claimed a Top 10 spot in this ranking; the three highest appearances from American companies are IBM, coming in at 16, with 43,033 active patent families, followed by Microsoft (ranked 27), and GE (40).

Patent activity provides valuable insight into companies’ R&D activity for researchers, analysts, and investors. Often the true value of a company lies with its intellectual properties, so examining patent assets is a key tool in gauging the intangible assets of publicly traded companies. It speaks to productivity, technological efficiency and IP strategy, and frequently reveals technology trends and the competitive landscape within various industries.

To create your own analysis, visit the IFI CLAIMS Live 1000, a free tool which uses data from the top 1000 companies that received patents across multiple countries and patent jurisdictions. The tool shows live data and offers interactive features that allow users to create and sort their own lists using a variety of filters.


About IFI CLAIMS Patent Services

IFI CLAIMS Patent Services uses a proprietary data architecture to produce the industry’s most accurate patent database. The CLAIMS Direct platform allows for the easy integration of applications, other data sets, and analysis software. Headquartered in New Haven, Conn., with a satellite office in Barcelona, Spain, IFI CLAIMS is part of Digital Science, a digital research technology company based in London. For more information, visit www.ificlaims.com and follow IFI on LinkedIn.

About Digital Science

Digital Science is an AI-focused technology company providing innovative solutions to complex challenges faced by researchers, universities, funders, industry and publishers. We work in partnership to advance global research for the benefit of society. Through our brands – Altmetric, Dimensions, Figshare, ReadCube, Symplectic, IFI CLAIMS Patent Services, Overleaf, Writefull, OntoChem, Scismic and metaphacts – we believe when we solve problems together, we drive progress for all. Visit www.digital-science.com and follow @digitalsci on X or on LinkedIn.