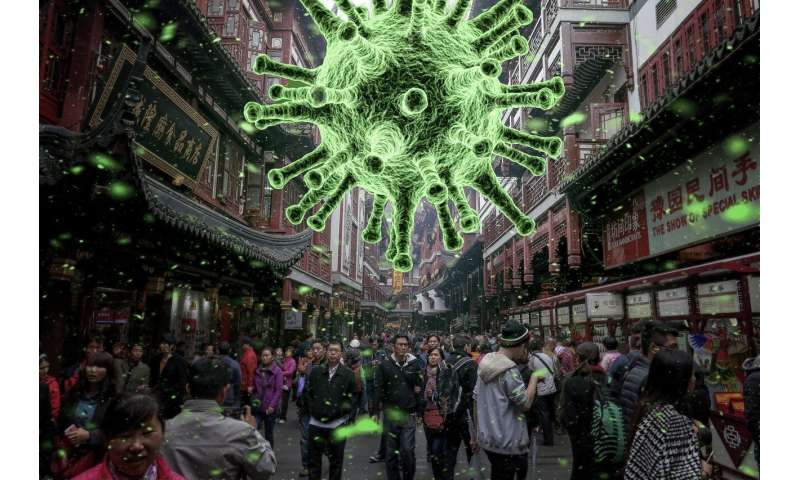
Credit: CC0 Public Domain
The WHO said Friday that coronavirus pandemic effects would be felt for decades as its emergency committee assessed the situation six months after sounding its top alarm over the outbreak.
The novel coronavirus has killed nearly 675,000 people and infected at least 17.3 million since it emerged in China last December, according to a tally from official sources compiled by AFP.
The World Health Organization's emergency committee, comprising 18 members and 12 advisers, is meeting for the fourth time over the COVID-19 crisis.
"It's sobering to think that six months ago, when you recommended I declare a public health emergency of international concern (PHEIC), there were less than 100 cases and no deaths outside China." WHO chief Tedros Adhanom Ghebreyesus said as the meeting began.
"The pandemic is a once-in-a-century health crisis, the effects of which will be felt for decades to come."
The committee can propose new recommendations or amend existing ones.
However, there is little doubt that the WHO will maintain the pandemic's status as a PHEIC—its highest level of alarm—first declared on January 30.
The WHO has been sharply criticised for the length of time it took to declare an international emergency.
The United States, which accused the organisation of being too close to China, officially began its withdrawal from the organisation in July.
The agency has also been criticised for recommendations deemed late or contradictory, in particular on wearing masks, or the modes of transmission of the virus.
Questions unanswered
"Many scientific questions have been resolved; many remain to be answered," Tedros said.
"Early results from serology studies are painting a consistent picture: most of the world's people remain susceptible to this virus, even in areas that have experienced severe outbreaks.
"Many countries that believed they were past the worst are now grappling with new outbreaks. Some that were less affected in the earliest weeks are now seeing escalating numbers of cases and deaths. And some that had large outbreaks have brought them under control."
The highly restrictive lockdowns enforced to deal with the pandemic earlier this year caused economic turmoil and an effective vaccine may be the only long-term solution to the highly contagious respiratory disease.
"Although vaccine development is happening at record speed, we must learn to live with this virus, and we must fight it with the tools we have," said Tedros.
© 2020 AFP
JUL 30, 2020
Report linking 5G to COVID-19 swiftly debunked
Related Stories

WHO's emergency panel reviews pandemic
JUL 31, 2020
The WHO said Friday that coronavirus pandemic effects would be felt for decades as its emergency committee assessed the situation six months after sounding its top alarm over the outbreak.
The novel coronavirus has killed nearly 675,000 people and infected at least 17.3 million since it emerged in China last December, according to a tally from official sources compiled by AFP.
The World Health Organization's emergency committee, comprising 18 members and 12 advisers, is meeting for the fourth time over the COVID-19 crisis.
"It's sobering to think that six months ago, when you recommended I declare a public health emergency of international concern (PHEIC), there were less than 100 cases and no deaths outside China." WHO chief Tedros Adhanom Ghebreyesus said as the meeting began.
"The pandemic is a once-in-a-century health crisis, the effects of which will be felt for decades to come."
The committee can propose new recommendations or amend existing ones.
However, there is little doubt that the WHO will maintain the pandemic's status as a PHEIC—its highest level of alarm—first declared on January 30.
The WHO has been sharply criticised for the length of time it took to declare an international emergency.
The United States, which accused the organisation of being too close to China, officially began its withdrawal from the organisation in July.
The agency has also been criticised for recommendations deemed late or contradictory, in particular on wearing masks, or the modes of transmission of the virus.
Questions unanswered
"Many scientific questions have been resolved; many remain to be answered," Tedros said.
"Early results from serology studies are painting a consistent picture: most of the world's people remain susceptible to this virus, even in areas that have experienced severe outbreaks.
"Many countries that believed they were past the worst are now grappling with new outbreaks. Some that were less affected in the earliest weeks are now seeing escalating numbers of cases and deaths. And some that had large outbreaks have brought them under control."
The highly restrictive lockdowns enforced to deal with the pandemic earlier this year caused economic turmoil and an effective vaccine may be the only long-term solution to the highly contagious respiratory disease.
"Although vaccine development is happening at record speed, we must learn to live with this virus, and we must fight it with the tools we have," said Tedros.
© 2020 AFP
JUL 30, 2020
Report linking 5G to COVID-19 swiftly debunked
Related Stories
WHO's emergency panel reviews pandemic
JUL 31, 2020


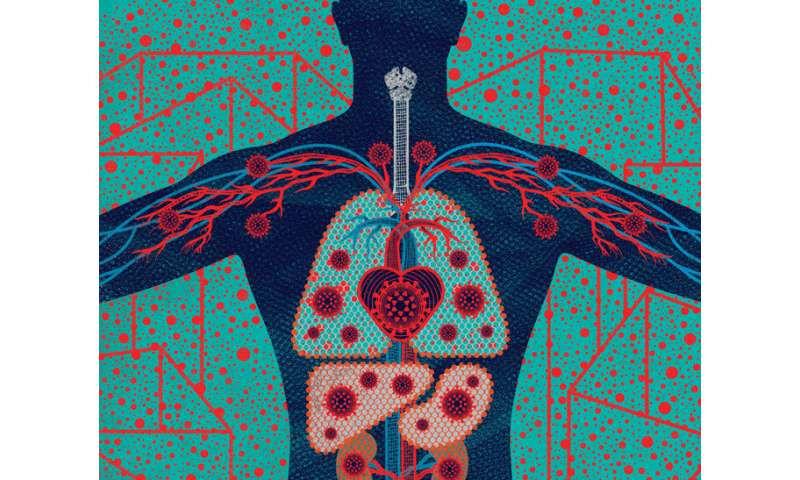

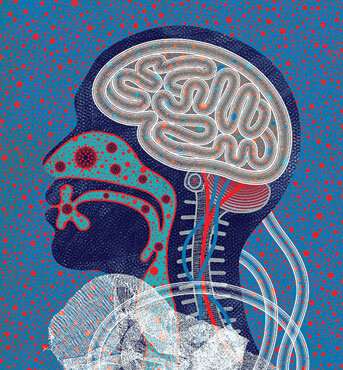
 From Head to “COVID Toes”: People with COVID-19 exhibit from none to many of these symptoms. Some symptoms (such as fever, cough, and loss of smell) are common, while others (such as sore throat, pink eye, and stroke) are rare. Credit: Illustration: Stephanie Koch. Concept: Jennifer Babik, M.D., Ph.D.
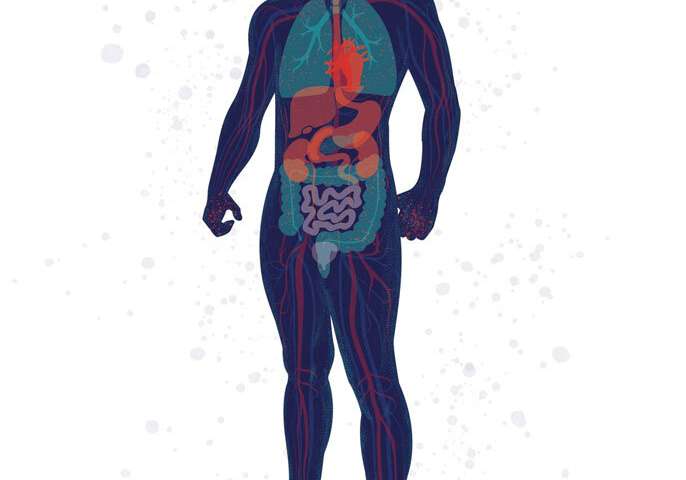
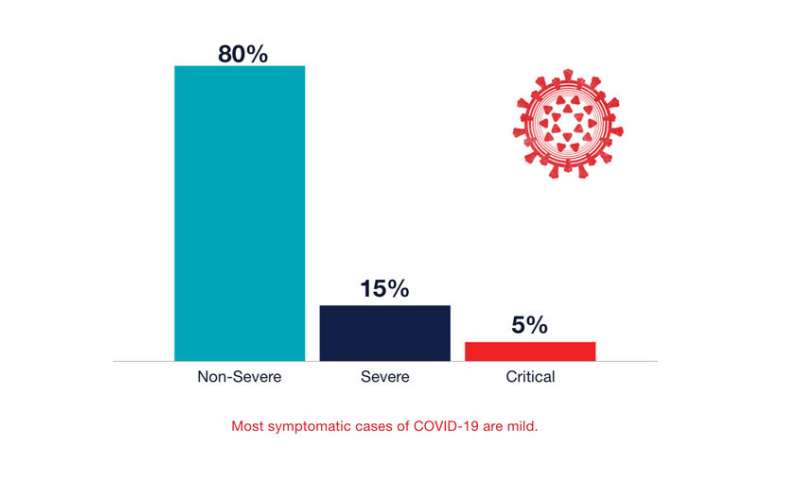 Most symptomatic cases of COVID-19 are mild. Credit: UCSF