Monday, October 26, 2020

Thousands of climate activists appeal to Brussels to withdraw farming policy


Issued on: 25/10/2020 -

A tractor harvests suger beet on September 20, 2019 in Vendin les Béthune, North of France. © Denis Charlet, AFP

Text by:Catherine BennettFollow

Thousands of climate activists have added their names to a new campaign spearheaded by Greta Thunberg, asking the European Commission to retract a farming policy that they say would make it impossible to reach the EU’s climate goals.

The Swedish climate activist Greta Thunberg has called on her followers to sign an open letter to EU leaders after the European Parliament on Friday endorsed a proposal for a new farming policy across the bloc.

The letter begins, “On Friday the 23rd of October, you let us down once again, in voting for a dirty deal, which betrays not only your commitments to the Paris Agreement, but also your commitments to justice and to democracy.”

The real story of today is not about the vote. It’s about the people who have not given up. There is the hope. And that will bring the change, eventually. #WithdrawTheCAP

A story of today by @GretaThunberg, @adelaidecharli2, @AnunaDe, @CamilleEtienne_ & mehttps://t.co/12GpuVDBoY— Luisa Neubauer (@Luisamneubauer) October 23, 2020

The Common Agricultural Policy, or CAP, sets out rules for farmers and agriculture across the European Union, and accounts for one third of the EU budget (€58.1 billion). The policy subsidises up to seven million farms across the EU. Current rules expire at the end of the year.

From #VoteThisCAPDown to #WithdrawTheCAP

The #WithdrawTheCAP campaign comes after Thunberg and other environmental activists urged the European Parliament to vote against the updated Common Agricultural Policy, flooding social media in the days preceding the vote with the hashtag #VoteThisCAPDown.

Dear MEPs, your vague distant climate targets will have no meaning if you fail to #VoteThisCAPdown and keep supporting the commercial lobby interests.
This is your chance to turn empty words into action. The eyes of future generations are upon you. No more excuses.#FututreOfCAP pic.twitter.com/Z60fWqnZd0— Greta Thunberg (@GretaThunberg) October 23, 2020

But the new policy was adopted with an overwhelming share of the vote, and activists are now training their sights on the European Commission, which has the power to withdraw the new policy and send EU officials back to the drawing board.

'Ecological destruction'

Environmental protesters say that the new CAP “fuels ecological destruction”. The biodiversity and bird charity BirdLife has called it an “extinction machine”. Even Agricultural Commissioner Janusz Wojciechowski issued a cautious warning prior to negotiations, suggesting on 19 October that some of the proposals would not allow the EU to reach climate objectives.


And just like that the European Parliament passes a death sentence for many species. It's official the CAP is not in line with the #EUGreenDeal, by the Commission's own admission.

Time to #WithdrawtheCAPhttps://t.co/uf81KDRGRe#FutureofCAP pic.twitter.com/H6oNwaTc80— Harriet Bradley (@HarrietBirdlife) October 23, 2020

European finance ministers and the agri-industry lobby resisted the inclusion of compulsory participation in eco-schemes in the bill, which are green agricultural projects that would receive a significant portion of EU funds through the CAP. Each European country would have to channel 20 percent of the money its farmers receive from the EU to these environmentally-friendly projects. Campaigners say however that that promise doesn’t go far enough, and want to boost the percentage of farmers’ payments going to eco-schemes to 50 percent.

“By putting targeted eco-schemes, programmes and also investments at the centre of this reform, we have assured a step towards a more sustainable and competitive agricultural sector,” said Ulrike Müller, the European Parliament’s rapporteur on CAP financing.

Exploitable loopholes

But the draft policy has loopholes that countries can exploit. The current policy will stand for a further two-year transition period before the new policy comes in, meaning that the new ambitious eco-schemes will not launch until 2023. Money that hasn’t been used towards environmentally-friendly projects within a set period of time won’t be carried over, but instead can then be put into non-green projects, with no environmental obligations. Critics also say the CAP scales down current requirements to protect certain types of land and for farmers to keep a certain percentage of their land out of production. Greenpeace said the policy represented a "death sentence for small farms and nature".

>> Click here to watch FRANCE 24'S Talking Europe show on making European farming sustainable

The #CAP needs to play its part in tackling climate change and biodiversity loss; the current CAP has been unable to deliver this kind of change. Ecoschemes and their funding are an important first step, but more steps must follow in agriculture and along the food chain.— Frans Timmermans (@TimmermansEU) October 24, 2020

The European Parliament has stated that the new farm policy is greener than the current one, pointing out that the new CAP provides more financial aid to farms who use sustainable and environmentally-friendly practices. It also says sanctions would be increased for those who violate environmental standards.

Environmental activists insist, however, that the European Parliament’s adoption of the new farm policy this week has now made the EU’s goal to achieve carbon neutrality by 2050 – as laid out by the 2015 Paris Agreement -- impossible to attain.


'€386bn ploughed into largely destructive practices' - environmental groups share dismay over divisive farm subsidies deal


Caroline O'Doherty
October 23 2020 

MEPs have voted for a multi-billion euro agricultural subsidies deal that farmers say will be create major challenges for the way they farm but environmentalists say will destroy nature.

The latest package of Common Agriculture Policy (CAP) measures will largely dictate farming practices across Europe until 2027.

Climate campaigners and environmental groups had urged radical reform of the CAP to ensure a move away from intensive farming practices that are high on greenhouse gas emissions, heavily polluting of soils and water sources and massively damaging to wildlife.

They said the deal voted through on Friday afternoon fell far short of those aims and would make it impossible for Europe to meet crucial emission reduction targets.

But farmers’ organisations said the deal would be demanding on the sector and require significant changes in farming practices.

Speaking in advance of Friday’s vote, Irish Farmers Association president Tim Cullinan said a provision to link 30pc of farm subsidies to environmental schemes would be challenging.

“All farmers already have to meet standards of good agricultural and environmental practices under current CAP rules,” he said.

“It means that all farmers will have to undertake additional environmental measures to have a chance of maintaining their payments.”

Minister for Agriculture Charlie McConalogue backed the deal ahead of the vote.

Green Party MEP Grace O’Sullivan, however, said the package served no-one well.

“This is not CAP reform. I'm beyond disappointed and baffled it passed, with all the right voices crying out against it – NGOs, scientists, even the EU Agriculture Commissioner and farmers on the ground.”

BirdWatch Ireland, which campaigns for healthy habitats for all wildlife, tweeted its dismay, saying: “€386billion of EU citizens’ money will be ploughed into largely destructive practices.”

The network of European environmental groups, the European Environmental Bureau, described the vote as “wasting public money on a fundamentally unsustainable and unfair agricultural policy”.

Friends of the Earth said it was a “historically bad week for the future of farming” that would perpetuate a system of “wrong policies and warped farming subsidies which mainly benefit industrial scale factory farms”.

“Now this failing system looks set to continue, spelling disaster for the environment and small farmers,” it said.

The bill for CAP represents a third of the EU’s entire budget. Talks on the implementation of the new package have to take place and there is a possibility that European Commissioners may seek to present fresh proposals to address the criticisms.
IRELAND
ESB seeks buyer for 2 million tonnes of coal ash


Moneypoint in Co Clare


Caroline O'Doherty
October 26 2020
Irish Independent

The ESB is trying to sell two million tonnes of ash from its coal-burning power plant at Moneypoint.

The ash is in landfill on the Co Clare site but the ESB wants to dig it up and sell it for use in cement production.

Otherwise, the power company is looking at lifelong maintenance of the landfill site as coal ash contains chemicals that must be carefully monitored.

ESB has sold fly ash, the powder-fine residue from coal burning, to cement firms in the past; but after 35 years of operation at Moneypoint, a massive excess has built up.

Around 1.8m tonnes of the landfill ash for sale is fly ash while the remaining 200,000 tonnes is 'bottom furnace' ash - larger pieces, not fully burnt.

The company has advertised for expressions of interest in buying the ash, inviting potential buyers to complete a pre-qualification questionnaire (PQQ), and has also put an extraction and haulage contract out to tender in case a buyer is found.

ESB stressed it did not have to remove the ash. "It can be safely retained in landfill," the company said.

"The PQQ is to assess demand in the marketplace for this type of ash. It is used in the cement industry and so it has some commercial value. ESB has received a licence from the Environmental Protection Agency to remove the ash - should we wish."

Dr Lisa O'Donoghue of University of Limerick, who investigates uses for industrial waste products, said there was a push for progress in this area as part of the drive for a no-waste 'circular economy'.

Finding uses for waste not only created fresh revenue streams and reduced the demand for virgin raw materials, but it also prevented landfilling, she said.

"The minute something goes into a landfill, it's a job for eternity," Dr O'Donoghue said.

"They're lined and they're protected so they're well managed but they're often called engineered management sites rather than landfill because they can't be left there and abandoned.

"They have to be maintained at an ongoing cost."


The spirit that created a nation of great Danes


Hand it to the Danes - they have a decent football team and the right attitude to life. Rated the #1 happiest nation, this Nordic territory is big on 'Janteloven' - a communal spirit, with an aversion to material boasting.


While taxes are among the highest in the world, a state that guarantees a social safety net has bred an entrepreneurial spirit where fear of financial failure doesn't halt innovation.


"We are not paying taxes," says Meik Wiking, head of the Happiness Research Institute. "We are investing in our society, we are purchasing quality of life." Hard to argue with that.


Irish Independent

Arctic Sea Ice is not freezing In October for the first time since measurements began, now having an unknown effect on weather development towards Winter
By Andrej Flis | Latest news | 26 OCTOBER 2020


Arctic sea ice melt season usually lasts from March till September. After reaching the minimum extent in September, sea ice starts to grow back in October. But this year, the growth is much slower than last year, with almost no growth in some places. How did this unusual situation happen and can it mean something for the weather towards Winter 2020/2021?
THE ARCTIC ICE GROWTH

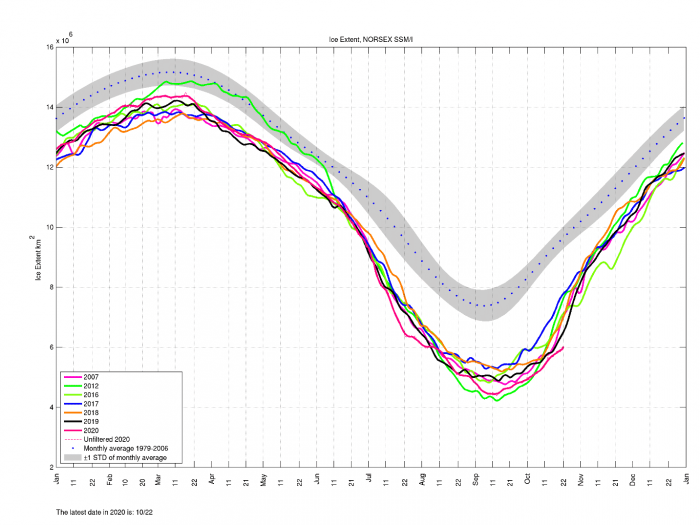
The Arctic sea ice seasonal cycle can be seen in the image below from the Arctic-ROOS system. It shows the Arctic sea ice extent change over a year. The melt season usually starts in March, after the peak ice extent is reached, lasting all the way to September. The graph shows the last few years of data, where we can see the 2020 Arctic ice extent was second-lowest, only behind 2012, which still holds the record for the lowest ice extent since measurements began.

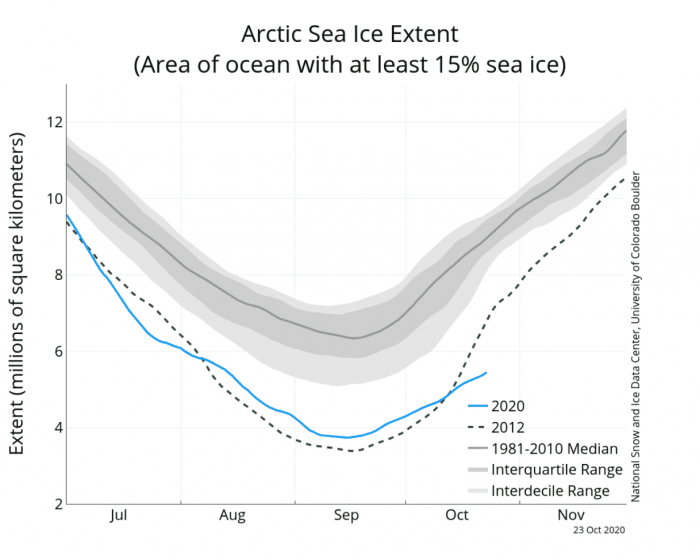
But comparing 2012 and 2020, we can see that this year we are also setting a new record, as the Arctic sea ice is not recovering as expected. The sea ice is refreezing back, but at a much slower rate than normal, meaning that some areas are severely falling behind.


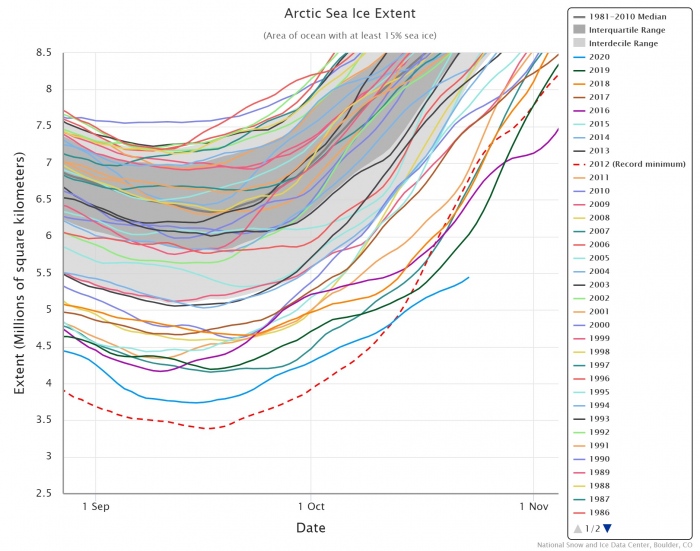
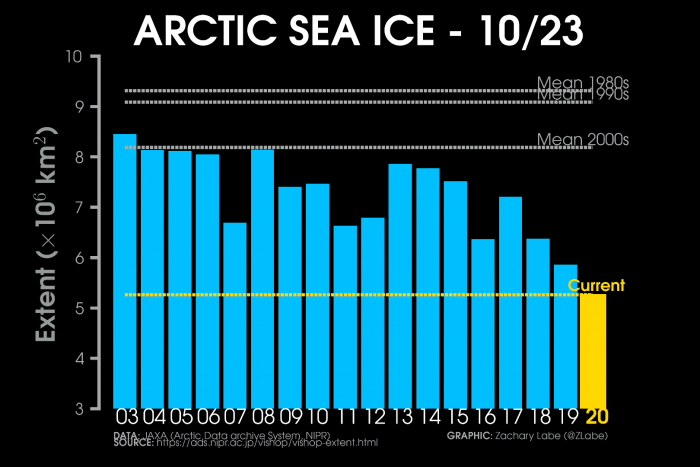
That is even more evident when we look at the comparison of all the years since the active satellite observations began in 1979. This year we observed the second-lowest Arctic sea ice extent on record. But because of the unusually low ice growth in October, the current ice extent is now the lowest for any October in the past 41 years.


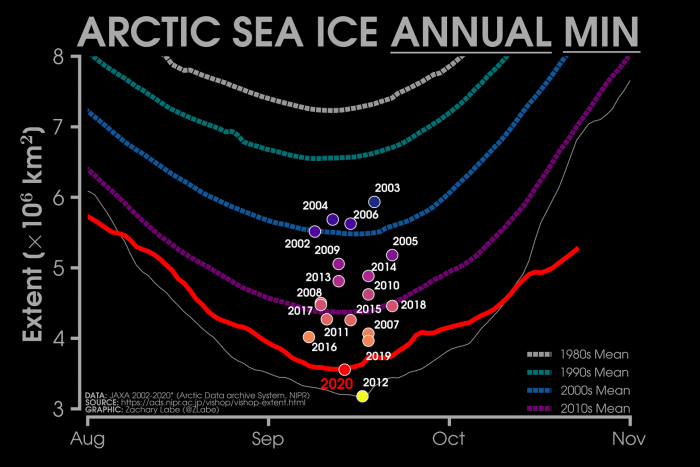
Comparing the minimum extent dates for the past 17 years also shows the 2020 minimum to be second lowest, trailing only the grand minimum of 2012. Graphic provided by Zachary Labe.


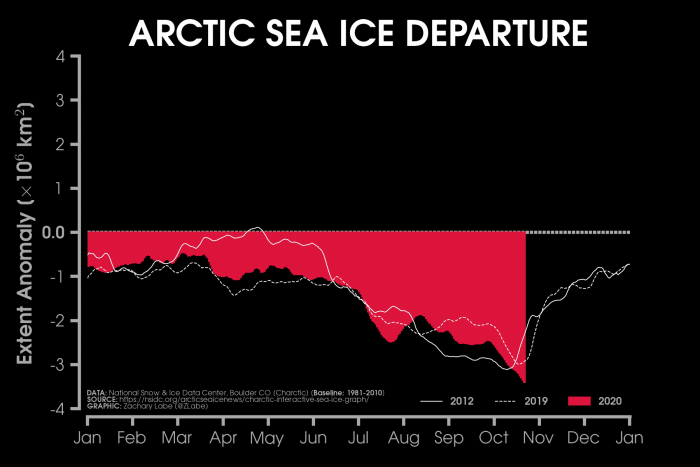
Comparing the years by the current date, we are well the lowest for this time of year. That is also evident by the second image, which shows the sea ice anomaly, compared to the long-term average. It shows the 2020 (red area) ice extent anomaly to continue to increase, while in the previous years (white lines), the anomaly already started to decrease by this point.


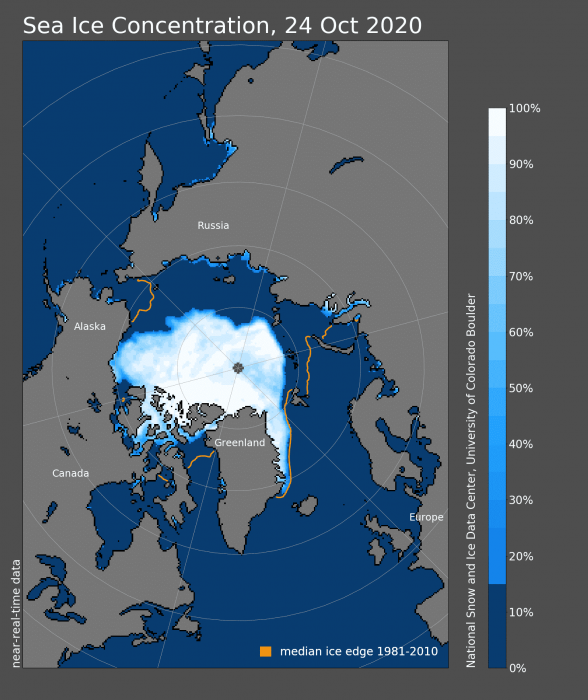
The analysis image by the National Snow and Ice Data Center (NSIDC) below, shows the current ice concentration and the average/normal long term extent in orange lines. Those orange lines show how far the sea ice should be reaching at this point in time, revealing a huge ice deficit.


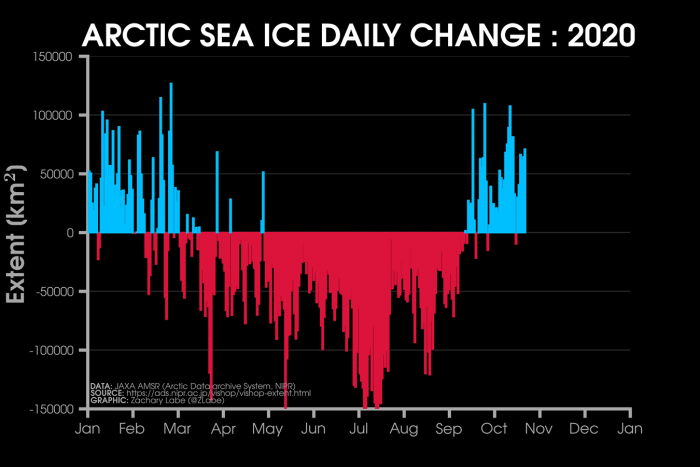
Growth has obviously begun since mid-September, but the rate was rather weak and is not increasing with time, evident by the recent daily increase rate on the image below. At this point, the daily growth should slowly increase over time, but we can see the daily growth area is not increasing and has rather been almost decreasing over time. The second image shows the October growth compared to previous years, where 2020 is severely trailing behind


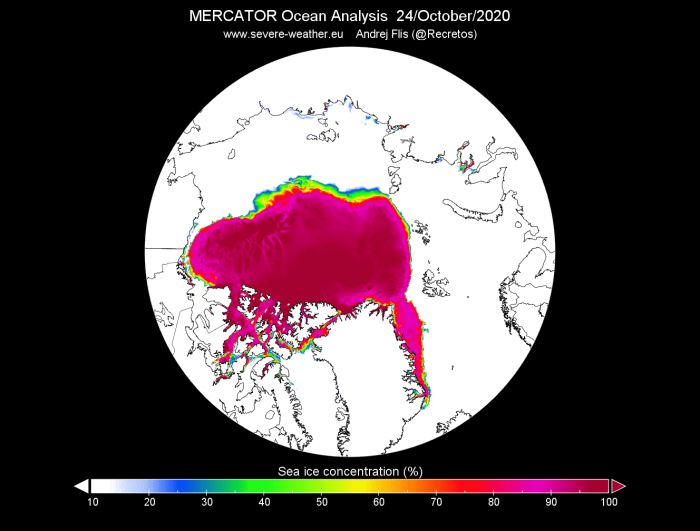
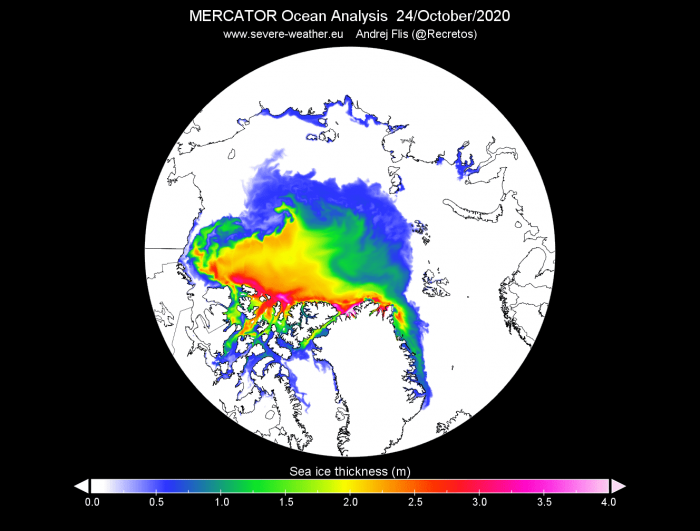
Images below show the current sea ice extent and thickness. We can see that the thickness shows a larger area than the concentration. That is because the concentration shows only the sea ice above 15% concentration. Anything below that means the ice is just too fractured and not compact enough.

So the sea ice thickness image reveals that there is thinner uncompacted ice around the edges, which falls below the 15% concentration threshold. This is usually normal because new sea ice is just starting to form on the edges and takes time to get more compact. But this year the ice is not compacting so fast, and we are now going to look at what is behind this unusual event.


THE VAST ARCTIC OCEAN

The Arctic region is in fact entirely an ocean and has no large-scale landmass. It is the smallest and shallowest of the world’s five major oceans, and also the coldest. It is also the only ocean smaller than the largest country in the world by area, Russia.

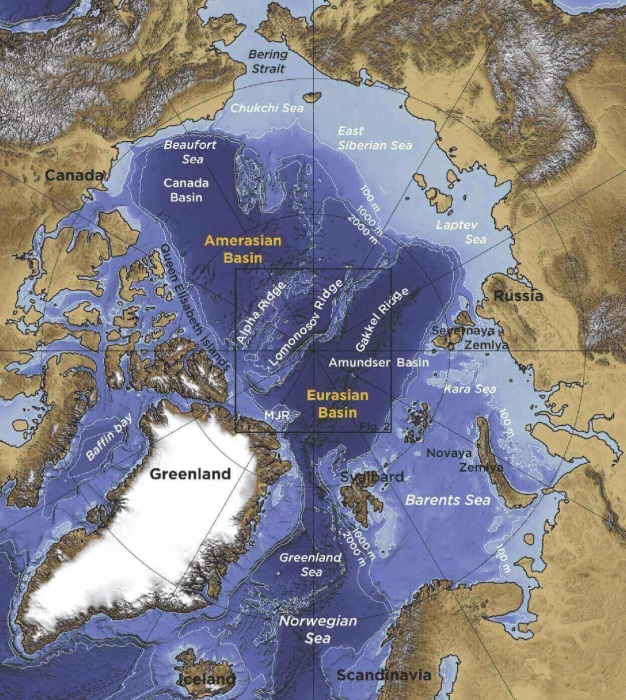
The image below shows the Arctic ocean, as it would look without water, revealing a very complex underwater terrain. To understand the current unusual sea ice anomalies, we need to understand the ocean where all the ice floats on. More specifically, we need to understand the state of the ocean in its eastern region, in the Kara Sea, Siberian Sea, and the Laptev Sea. The image below shows these regions in the Arctic Ocean, found on the side opposite to Greenland. The graphic is from one of the more recent Arctic Ocean studies.


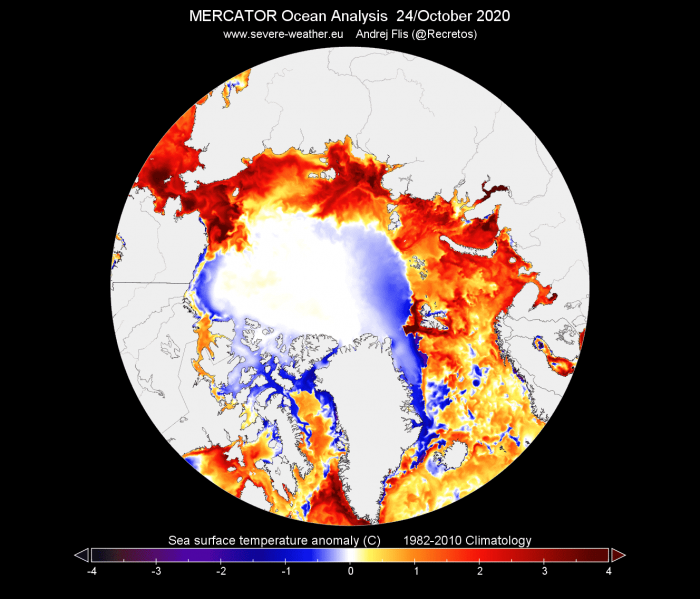
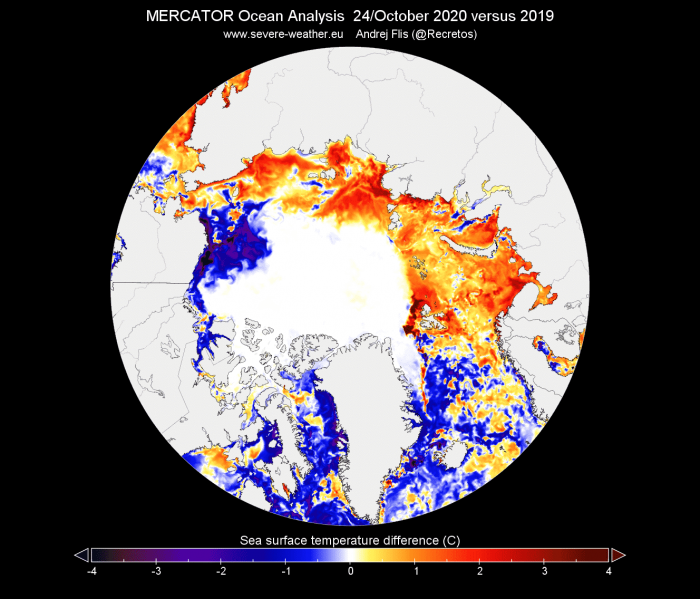
The image below is probably the most important one so far, as it shows the ocean surface temperature anomaly. It shows the ocean temperatures are currently well above normal around the entire Arctic ice sheet. Anomalies of over 2-3 degrees Celsius can be found across all the 3 critical ocean regions we mentioned above.


Compared to this time last year, the Atlantic side is actually colder this year, while the eastern Arctic Ocean is obviously much warmer than it was this time last year.


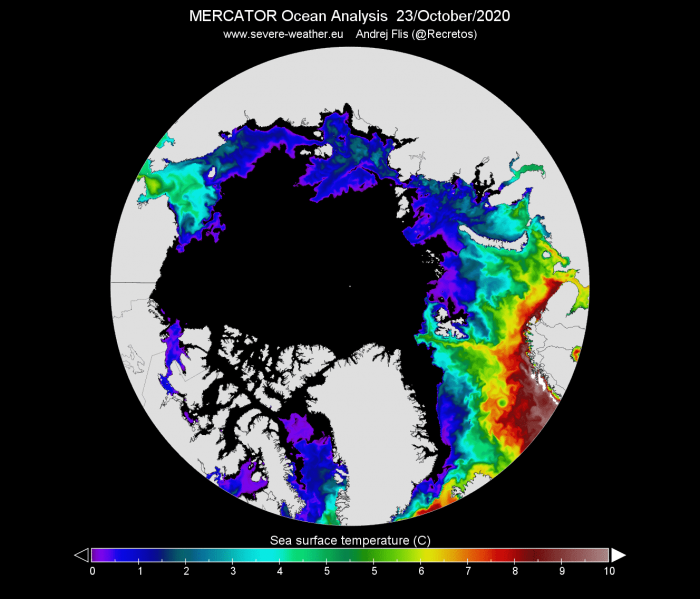
Also looking at the raw temperatures, we can see the eastern Arctic ocean is actually in positive surface temperatures, which means a low to zero chance of freezing over at this point. In normal conditions, almost the entire Arctic ocean should be at or below the freezing point – 0°C (black color) by the end of October.


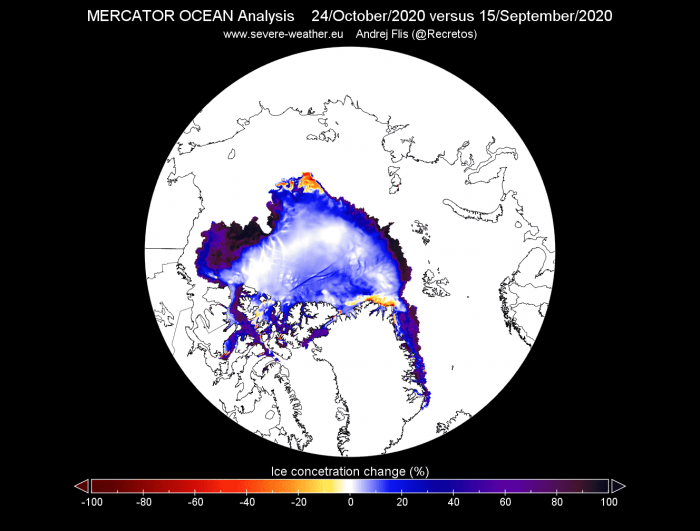
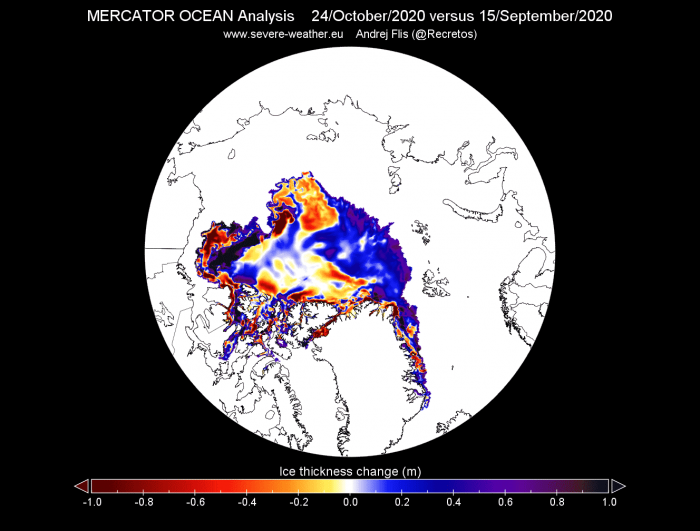
When comparing the current ice concentration and thickness with the lowest ice extent in mid-September, we can see the growth on the edges. But towards Siberia, we can actually see a reduced concentration and reduced thickness (red colors). Ocean and air temperatures were not yet right to allow rapid refreeze towards Siberia at present time.


But temperature is not the only factor here. Ocean salinity also plays a big role in the production of ice. The saltier the water, the colder it needs to get for ice to form. Think of salt being used on the roads to prevent ice buildup.

The image below shows the Arctic ocean salinity, where we can see the fresher water in blue colors, and saltier waters in brownish hues. Transport of saltier water is obvious from the North Atlantic into the Arctic Ocean, specifically towards the eastern parts. Interestingly, we can see the dark colors around the coastal areas, which is very fresh water. That is the freshwater discharge from the Siberian rivers.


We produced a short but very cool high-resolution video animation, which shows the Arctic ocean salinity in the past 5 months. You can see the ocean circulation, ocean currents, and the saltier water transport from the North Atlantic. Also note the freshwater entering the Arctic from the Siberian side, as the rivers discharge into the ocean, and note the freshwater increase during Summer, as melting ice makes the surface waters fresher.
Arctic Ocean salinity flow 2020 (click to play)
Arctic Ocean water salinity and surface currents during 2020 melt season - SWE /FA


SEA ICE ACROSS REGIONS

Many regions have regained ice since the lowest point in mid-September. But as we have shown above, the east Arctic Ocean is unusually warm and prevents fast sea-ice expansion.

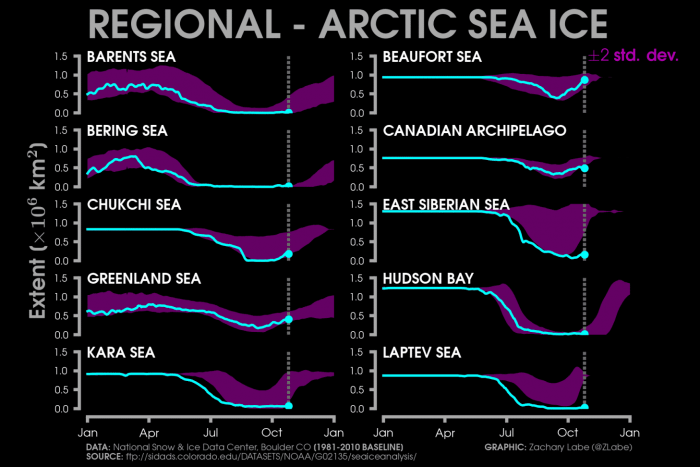
The image below shows the sea ice extent by various regions across the Arctic. While some regions normally start the freezing at a later date, there are 3 regions that stand out, as they should be much higher than they currently are. The Siberian Sea region, the Kara Sea, and the Laptev Sea. These are the regions that we have highlighted higher up in the article, which also face the biggest temperature anomalies.


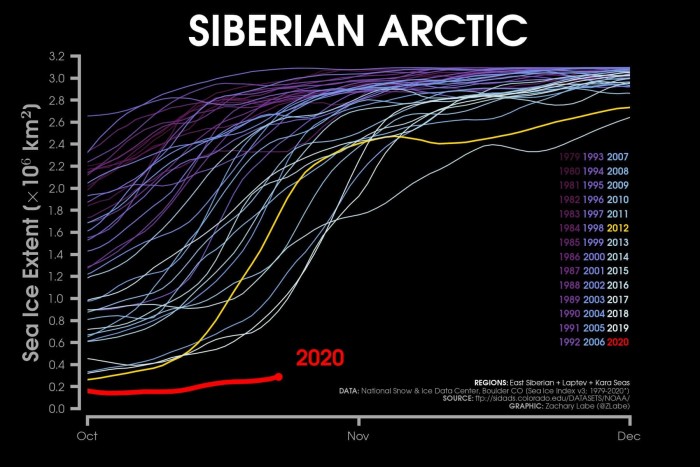
Looking at the Siberian Arctic region, it is struggling to increase the ice extent. It is running really unusually low for this time of year, having just a few % of the normal sea ice extent expected for this date.


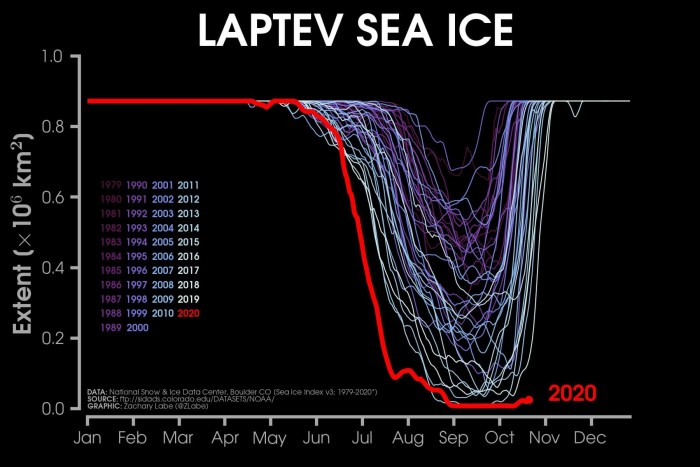
And of course, the Laptev Sea, which has been at record low levels for quite some time now. In the previous decade, the Laptev Sea has been entirely frozen over by this time of year, while this year it simply cannot lift off the ground.


But what is causing this unusual situation in the eastern Arctic Ocean? We have seen the ocean temperature anomalies and ocean salinity. But what has brought the Arctic Ocean into this state? Part of the answer lies in the Atmosphere, which is where we are heading next.

FROM THE OCEAN TO THE ATMOSPHERE

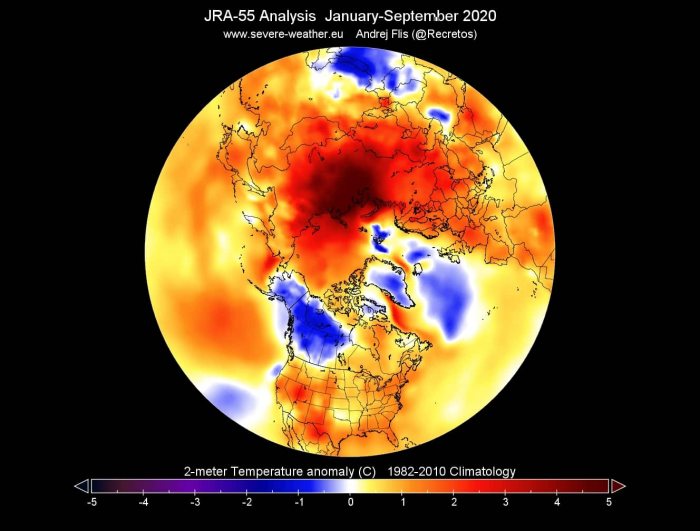
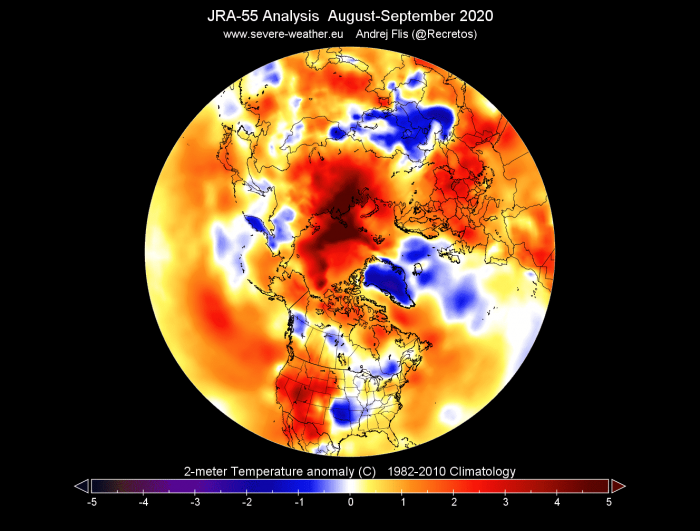
In the atmosphere, we usually always start with the temperatures. Looking at the January-September period, we can see that a hotspot has developed right over Siberia and the eastern Arctic Ocean. We can see a large area of temperatures 4-5°C above the long term average. We wrote about these Arctic heatwaves, which were ongoing since Spring.


A closer look at the August-September period reveals an even stronger hotspot, now expanded further into the Arctic Ocean, as the sea ice melted and more open water was exposed to the warmer weather.


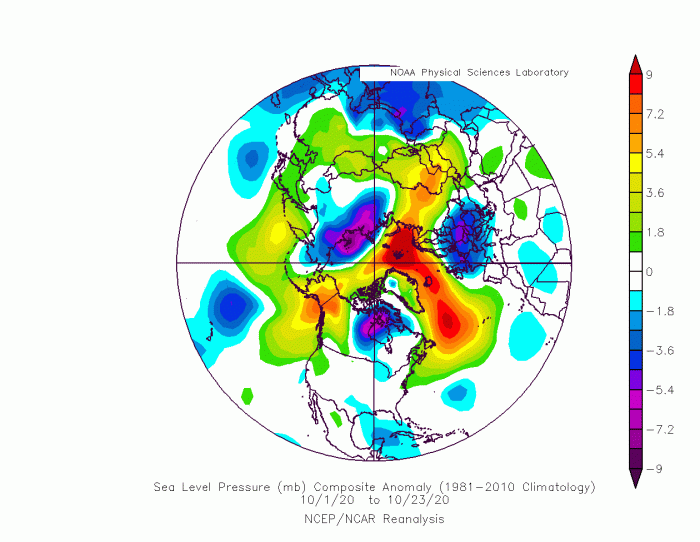
The reason behind this anomaly was a very specific pressure pattern. The October analysis so far, shows the high-pressure area dominating the Arctic region, while we can see a low-pressure system over the Siberian side.


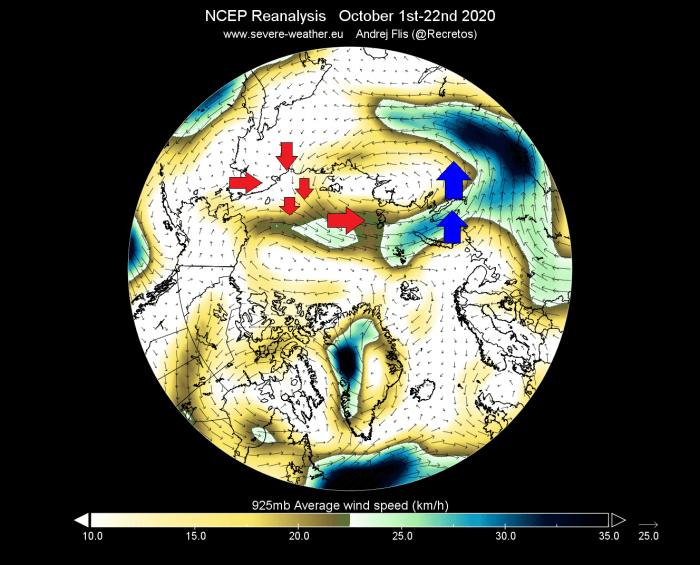
Such a pattern creates a very unique transpolar airflow over the eastern Arctic Ocean. The image below shows the average low-level wind flow in October so far. We can see the air transport across the Arctic, as warmer air enters the Arctic from one side, and cooler air leaving out on the other side.


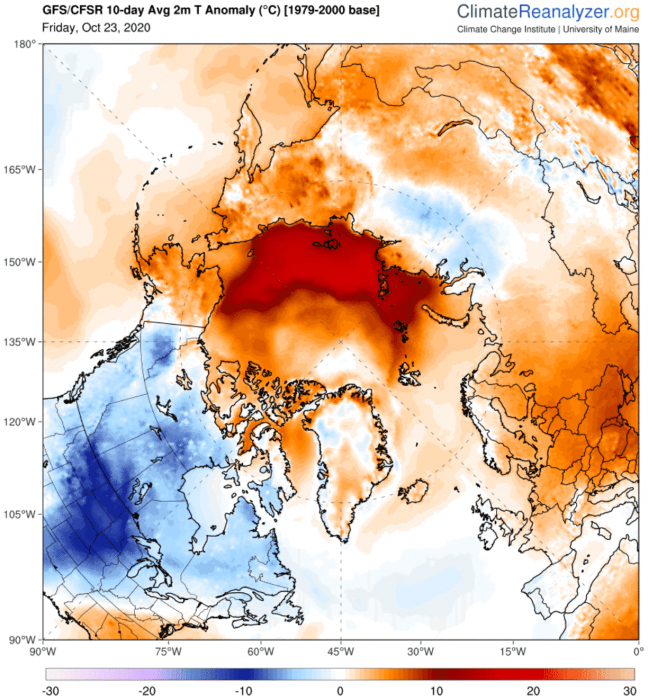
Looking at temperature anomalies in October so far, we can actually see a massive warm anomaly across the Siberian Arctic. That is where the warmer air was entering the region, replacing the colder air moving out into western Siberia.


The past 10 days specifically, have seen anomalies in excess of 15°C across the Siberian Arctic ocean. This, together with the warmer ocean waters, has been a large ice growth inhibitor so far in October.


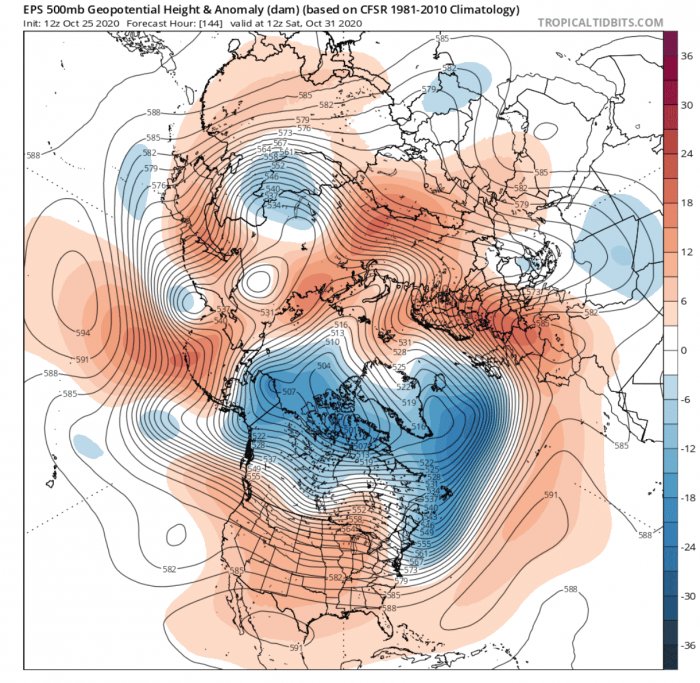
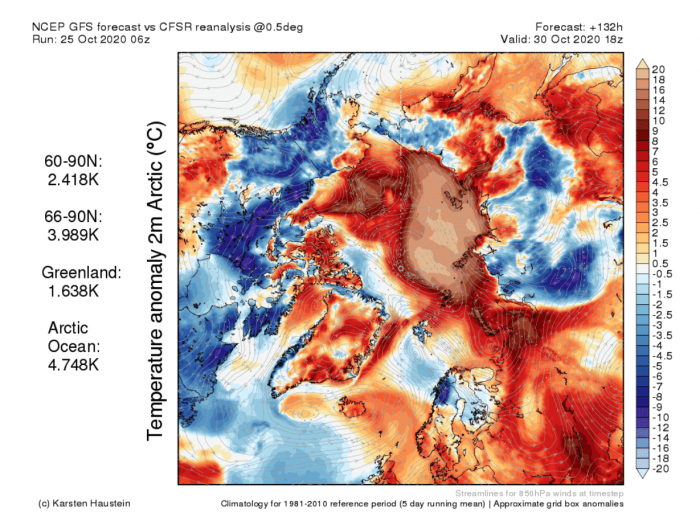
The forecast is not looking any better. The pressure pattern has now actually reversed, with lower pressure over the Arctic. But this will change the airflow direction, just bringing warmer air from another source region. The first image shows the pressure anomalies next weekend. The second image shows the wind direction and temperature anomalies, revealing a large scale warmer air transport into the Siberian Arctic.


But of course, this does not mean that +20°C temperatures will be measured across the Arctic in October. The normal temperatures for the Siberian region for example should be around -15°C. If the temperatures in this wave will be around 0 to -2°C, that is still 13-15°C above the long-term average.

This is what we are seeing on the last temperature image above. But still, such anomalies mean that the Arctic is not as cold as it is supposed to be at this point in time, creating inhibiting conditions for ice growth.

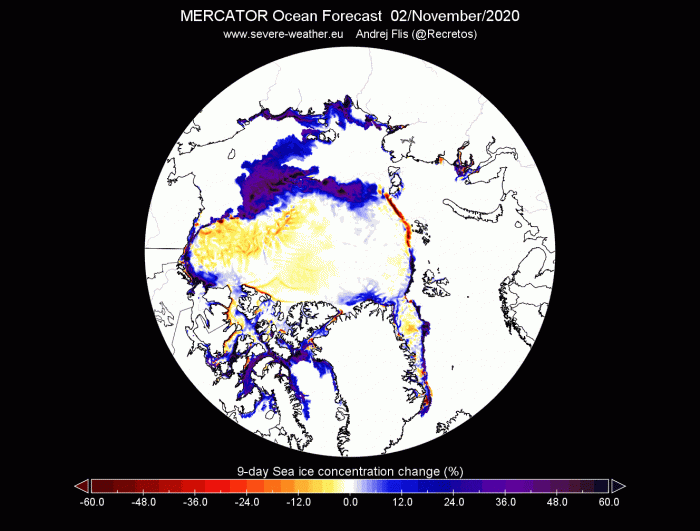
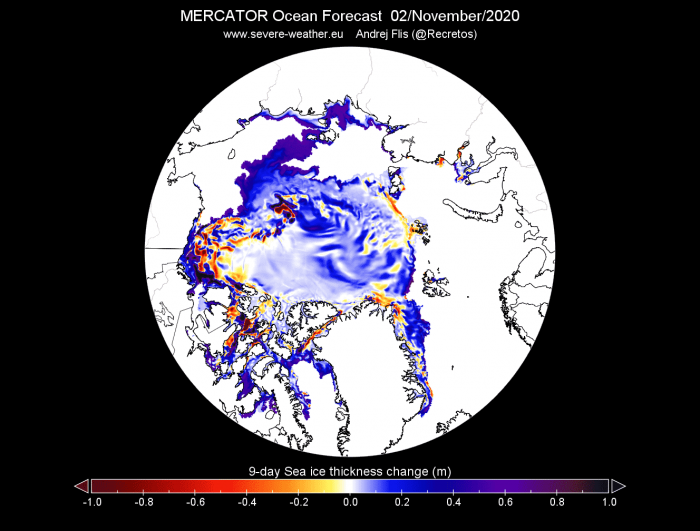
The images below show the forecast 9-day sea ice extent and thickness change. We can see the expansion of sea ice towards Siberia, but the Siberian Arctic and the Laptev sea are still running very ice-free.


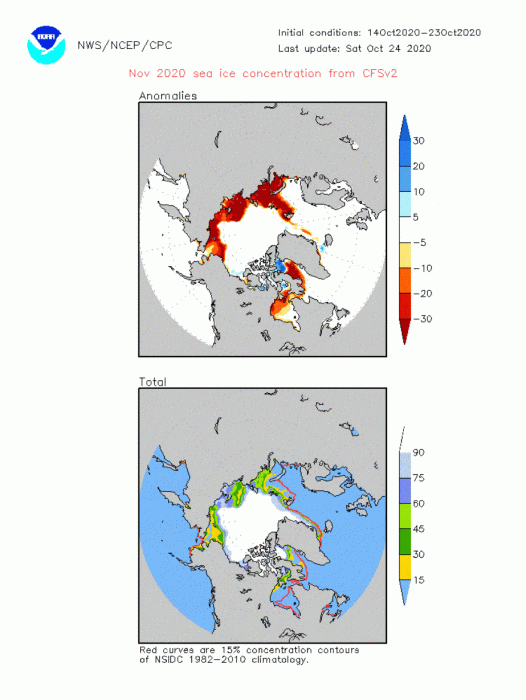
The CFSv2 model forecast for November 2020 shows the slow expansion of sea ice, with unusually low ice concentration (red colors) towards the Siberian side, extending into November.


SEA ICE AND WINTER 2020/2021

There is always a lot of debate about how the lack of sea ice affects weather development. A lot of studies have been made, and all point in a similar direction, of the sea ice deficit having an effect on the jet stream (and vice versa due to feedback mechanisms).

The jet stream is a large and powerful stream of air (wind) at around 8-11km (5-7mi) altitude. It flows west-to-east around the entire hemisphere, affecting the pressure systems, their strength, and thus shaping our weather at the surface.

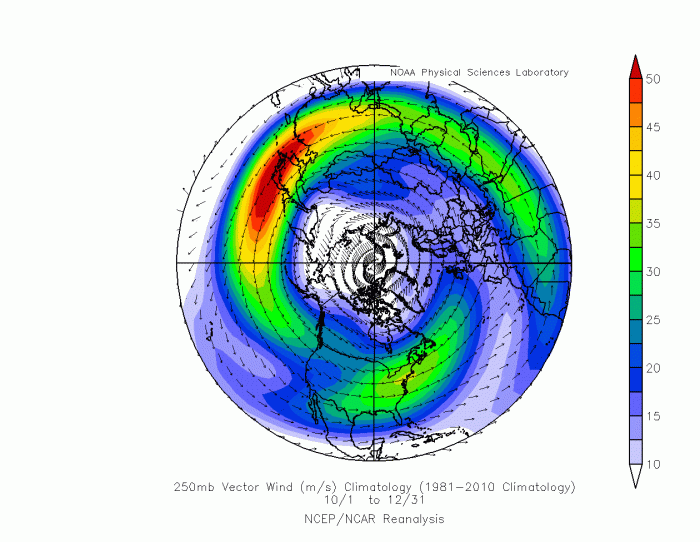
A perfect jet stream circles around the globe, as seen on the long term average image below. A west to east motion is called a zonal flow, which we can see on the image. If the motion is more north to south, that is called a meridional flow.


The secret of the jet stream is that it is fueled by the temperature difference between the cold arctic and the warmer southern/tropical regions. If the Arctic gets warmer, the temperature difference from the north to south decreases, and the jet stream can lose its strength.

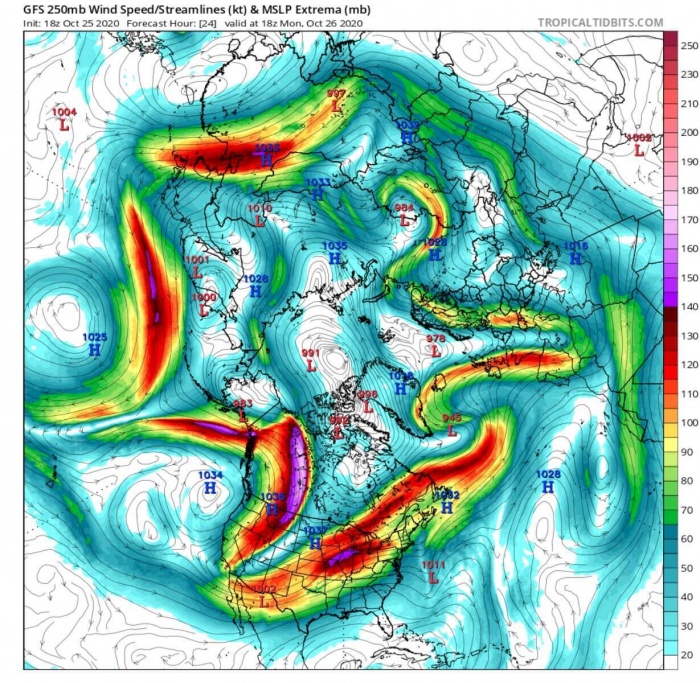
Below is an example of the jet stream in the forecast. Red-violet areas show stronger wind speeds at the 250mb level (~10.5km / 6.5mi). We can see that the strongest jet stream is positioned over the North Pacific, extending directly over North America, where a powerful cold air outbreak is ongoing.

The jet stream dropped down into the continental United States, unloading an Arctic airmass over a large part of the country. We can see that the jet stream is not perfectly in a zonal (west-east) flow, but is quite wavy and also meridional (north-south), especially over North America and Europe.


The general idea behind the sea ice melt is that it exposes more open waters. The ice-free open water can get warmer when exposed to the sun and constant higher than normal temperatures. This is something that we are observing this year. It means that the overall Arctic temperatures are getting warmer, potentially reducing the temperature difference between the north and south regions, and overall weakening the jet stream.

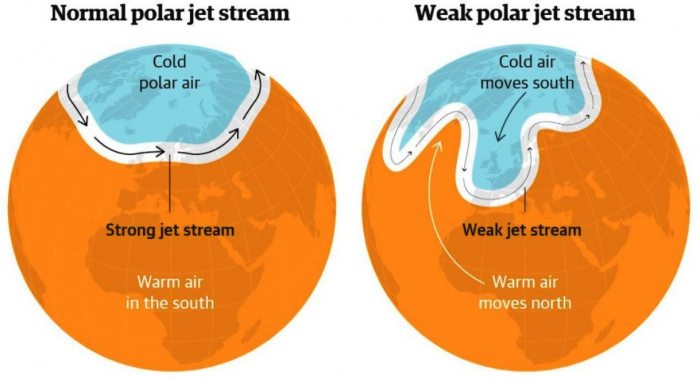
If the jet stream is weakened, it means that it can be easily disrupted and can change its flow from perfect west-east to more north-south. That can cause more dynamic weather and extremes, as colder air can move more freely from the north down, and warmer air from the south upwards.


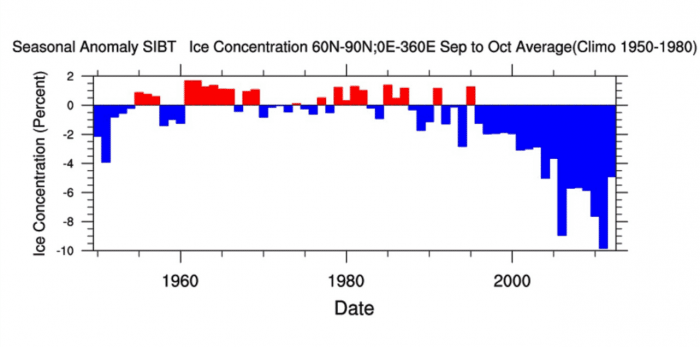
Looking at some past data, we produced two graphs. The first graph shows the Arctic sea ice concentration for the September-October period in the 70 years. We can see a pretty significant ice concentration decrease since the mid-’90s.


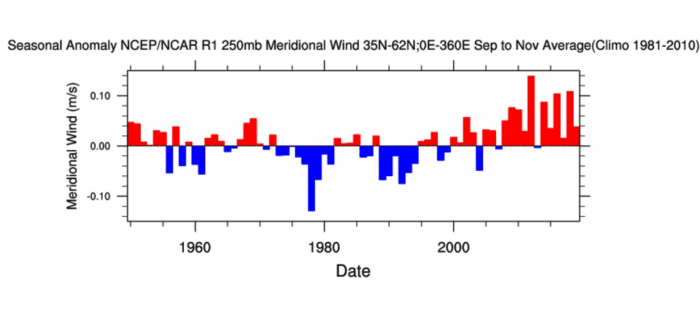
The second graph shows the meridional flow (north-south) in the jet stream in the Autumn period (Sep-Oct-Nov). Here we can also observe that there is more north-south meridional flow being detected in the jet stream circulation since the mid-’90s.


One could argue that this proves the jet stream is getting weaker or more wavy as the Arctic sea ice is reducing. But this needs more research, as it can go both ways. But it is an indication of a very likely and logical connection, that the jet stream is getting weaker or wavier as the sea ice is reducing.

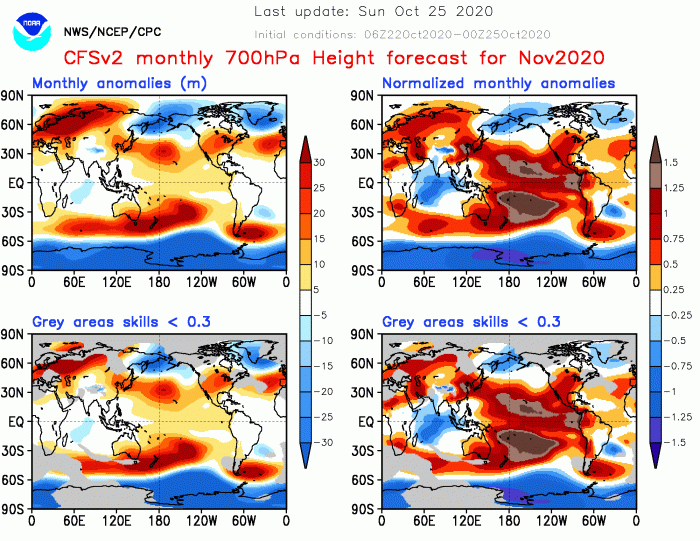
Looking at the November 2020 forecast by the CFSv2 model, we can see strong high and low-pressure systems, producing a very dynamic pattern. This will mean more north-south jet stream flow, with temperature extremes in both directions.


What about Winter 2020/2021? As we head towards winter, the connection/effect of the lack of sea ice is getting blurred or not so clear. There is a known effect on the jet stream, as we discussed. But when winter arrives, we have a lot of external factors that mask or reverse a potential sea ice effect.

The first factor is that by the time winter arrives, the Arctic sea ice is already regrown to a certain extent, not exposing so much (or none) open water. The second factor is the Stratospheric Polar Vortex. A strong polar vortex can influence the jet stream and potentially make it stronger, creating a more west-east flow and milder winter across North America and Europe.

But the strength of the polar vortex is also determined by the weather patterns, so here we have a very delicate feedback loop. The sea ice (or lack thereof) can influence the weather patterns, which affects the polar vortex, which then affects back at the jet stream and the weather patterns.


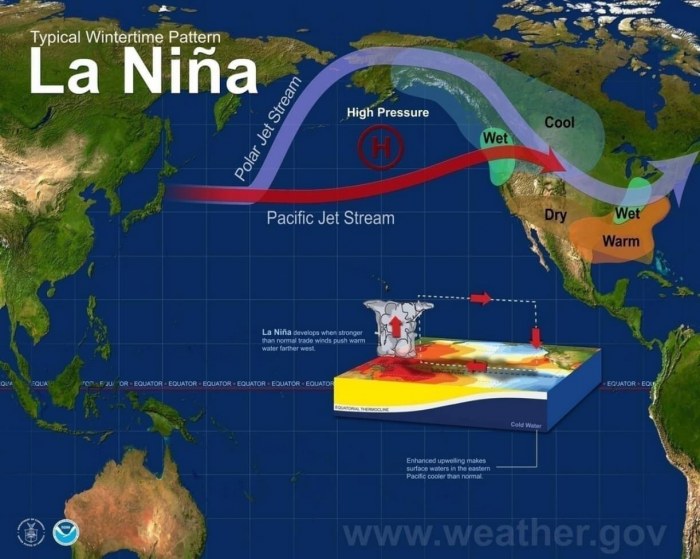
The third factor is the tropical ENSO region, with its developing La Nina phase. A La Nina has a very specific effect on the jet stream, which can override other potential effects from the sea ice. And it can also affect the polar vortex. The image below shows the typical La Nina influence on the jet stream over Canada and the United States during winter.


Sounds complicated? In fact, it is quite simple, as the main takeaway is that everything can influence everything to a varying degree. So the lack of sea ice has an effect on the jet stream, but it gets mixed towards winter with other global factors.

More often than not, a severe lack of sea ice would indicate a tendency for a higher pressure over the North Pole, which means that colder air could move more freely from the Arctic down into the mid-latitudes of the United States and/or Europe. But perhaps not doing it directly, with sea ice deficit being more as a mechanism to weaken the polar vortex, and thus weakening the overall jet stream and creating more north-south flow situations.

So we can know for sure that the current lack of sea ice will have an effect to some degree, but it is quite hard to tell how exactly. Even a small change or a shift in the current conditions can have a cascading effect towards winter, also known as the butterfly effect. Sometimes it is the small changes like this, that can cause a weather season to turn out different than expected, defying all the model forecasts.

We will keep a close eye on the long-range winter forecasts, searching for different trends and indications of potential jet stream fluctuations during Winter 2020/2021.

We wrote an entire article on the La Nina, what it is and what is its winter jet stream influence, so make sure to check it out:

La Nina watch: Exceptional cooling continues in the equatorial Pacific. La Nina now gradually intensifies, on time for Winter 2020/2021


Why Trump's latest COVID-19 comments have doctors furious


Spencer Platt/Getty Images

BY HOPE NGO/OCT. 26, 2020 

Here's a statistic we almost never see. Back in August, The Guardian reported that nearly 1,100 healthcare workers in the United States have died from COVID-19 and its complications. Many of the workers were Black, Latino, Asian/Pacific Islander, or Native American. And of those profiled, just over 30 percent were immigrants, born outside of the United States (via KHN). By the end of September, the National Nurses United reported that number had risen to more than 1,700.

"These deaths were avoidable and unnecessary due to government and employer willful inaction. Nurses and health care workers were forced to work without personal protective equipment they needed to do their job safely. It is immoral and unconscionable that they lost their lives," Zenei Cortez, R.N., one union president said (via Fierce Healthcare).

So it was jarring for physicians to hear President Donald Trump to take to the campaign trail during the weekend, and claim that "doctors get more money, and hospitals get more money" if they inflate COVID-19 death rates (via Twitter). Doctors were rendered speechless by the accusation, before medical associations came forward to defend their members.


ACEP: To imply that physicians inflate deaths from the pandemic is offensive


John Moore/Getty Images

The American College of Emergency Physicians released a statement saying, "On behalf of the nation's emergency physicians, ACEP is appalled by President Trump's reckless and false assertions that physicians are overcounting deaths related to COVID-19. Emergency physicians and other health care workers have risked their lives day in and day out for almost a year battling the greatest public health crisis in a generation—all while watching countless patients die alone, going to work without sufficient protection equipment, and struggling with crushing anxiety about getting sick or spreading the virus to their loved ones."

The statement continued, "To imply that emergency physicians would inflate the number of deaths from this pandemic to gain financially is offensive, especially as many are actually under unprecedented financial strain as they continue to bear the brunt of COVID-19."


Health care workers are struggling financially: ACP


John Moore/Getty Images

The American College of Physicians pointed out that the death toll wasn't over-reported, but in fact, the opposite was true. "ACP notes that several recent studies suggest that the actual number of people who have died from COVID-19 is much higher than the terrible toll of 220,000 deaths officially attributed to the virus. Alleging that COVID-19 deaths instead are overcounted undermines the work by physicians and public health authorities to remind the public of the seriousness of the pandemic and to recommend steps to reduce transmission of the virus, cases, and deaths."

The group continued in its statement, "ACP has been aggressively advocating on behalf of internists and their patients during the COVID-19 pandemic to support their need for adequate PPE, for appropriate funding and payments to help sustain their practices so they can continue to provide patient care, and has called for following evidence-based science in fighting the pandemic. In reality, many internists and other physicians are struggling financially during this time but continue to put themselves and their families and loved ones at risk in the name of their profession and duty to their patients and communities."

Physicians and patients are making sacrifices: AMA


John Moore/Getty Images

The American Medical Association also reacted strongly to the allegations, saying, "At a time when physicians and other health care professionals are providing care to a number of COVID-19 patients amidst a third wave, there is misinformation about how patients are counted. Let's be clear physicians are not inflating the number of COVID-19 patients. Research published in JAMA and in CDC reports indicate that the US had significantly more deaths in 2020 than in previous years (excess deaths). Physicians and patients are making remarkable sacrifices and we continue urging all to wear a mask, physical distance, and wash your hands to reduce suffering, illness, and death."

Per The New York Times, the number of new coronavirus cases hit a daily high of 78,702 cases over the weekend — and now more than 8.7 million have been infected with coronavirus; over 225,000 people have died. Some of the worst spikes have been seen in rural counties, with states like Illinois, Tennessee, New Mexico, Nebraska, and Utah reaching new records.

It's exhausting to have a president working against us: doctors


Scott Eisen/Getty Images

Doctors have taken to Twitter to express their anger over the president's campaign remarks. One tweeted, "TBH most of us took pay cuts." Another said: "For the first time ever, last spring I was scared to go to work. I was scared of being infected, infecting my family, of what was happening to my patients and whether hospitals had the capacity to care for them. This is what HCWs are concerned about, not cheating the system." A third healthcare worker tweeted: "I can't describe to you how inaccurate, dangerous, and vile this is. It's just... wrong."

Perhaps the most heartbreaking words came from one public health expert who said: "For healthcare workers, it's really exhausting to have a president constantly working against us — instead of with us — in the middle of a pandemic."


Read More: https://www.thelist.com/267347/why-trumps-latest-covid-19-comments-have-doctors-furious/?utm_campaign=clip


1 in 12 parents say their teen has attended a demonstration about racism or police reform

The majority of parents support teen's involvement with demonstrations; Black parents more likely to discuss racism and police brutality in-depth with teens, new national poll suggests.

MICHIGAN MEDICINE - UNIVERSITY OF MICHIGAN

Research News

IMAGE

IMAGE: PARENTS' TOP CONCERN INVOLVING TEENS PARTICIPATING IN DEMONSTRATIONS IS THEIR TEEN'S SAFETY. view more 

CREDIT: C.S. MOTT CHILDREN'S HOSPITAL NATIONAL POLL ON CHILDREN'S HEALTH AT MICHIGAN MEDICINE

ANN ARBOR, Mich. -- A growing number of demonstrators taking to the streets to protest police brutality and racial injustice may include teenagers, a new national poll suggests.

One in 12 parents say their teen has attended an event about racism or police reform this year, according to the C.S. Mott Children's Hospital National Poll on Children's Health at Michigan Medicine.

And while many parents are addressing the national issue with their children at home, the Mott Poll report indicates racial differences between families when it comes to these interactions.

Three quarters of parents say they've talked with their teen about the ongoing protests. But Black parents are more likely than white parents to report in-depth discussions (39% vs 29%) and to say their teen has attended an event about racism (16% vs 6%).

"Many families are engaging around the topic of racism and what's been happening in the country over recent months, with one in three white parents and two in five Black parents having deep conversations about the protests with their teens," says Mott Poll co-director Sarah Clark, M.P.H.

"Parents may have seen their teen showing a more complex interest in the world around them and a substantial number of these young people appear to have moved beyond discussion to taking action."

Meanwhile, 43% of parents surveyed have had some discussion with teens and 27% say they've had minimal or no conversations about the demonstrations with their kids.

Concerns about teen's safety at demonstrations

The vast majority of parents whose teen attended a demonstration or other event about systemic racism supported their teen's involvement (55 % enthusiastically and 38 % with some reservations); 5% of parents disapproved and 2% did not know about the teen's attendance, according to the report.

White parents are nearly twice as likely than Black parents (57% vs 31%) to believe teens do not belong at these demonstrations.

Parents' top concern is their teen's safety: 73% of parents worry the demonstrators may become violent while 58% are concerned the police may use force against protesters. Concern about demonstrators becoming violent is higher among white parents (76% vs 62%), while concern about police use of force is more common among Black parents (77% vs 49%).

Almost half of parents (45%) say they are worried that their teen does not understand the risks of participating in demonstrations. This includes concern that teens attending demonstrations could get arrested (39%) and don't know their legal rights (35%).

"We saw substantial racial differences involving views on who might instigate violence at a demonstration," Clark says. "Black parents are much more concerned than white parents about the use of force by police while white parents are more concerned about the demonstrators becoming violent.

"This may reflect parents' own experiences, as well as the influence of media portrayals of the demonstrations and the events leading up to them."

More white parents than Black parents believe that teens are too immature to understand the real challenges that police face (46% vs 21%) and that demonstrations show a lack of respect toward police (46% vs 13%).

Black parents were also more likely to say the topic is stressful for their teen, who may have a higher risk of encountering police brutality. Half of Black parents say thinking about police brutality and racism causes stress for their child compared to a quarter of white parents.

"The higher stress level reported by Black parents is understandable. The demonstrations highlighted numerous Black victims of police violence, and Black teens may see themselves at risk," says Clark. "Many Black parents have difficult conversations with their children from early on about how racism may impact their lives.

"Our poll findings reflect families' different lived experiences and perspectives. These experiences will likely shape parents' views on their teens being involved in demonstrations and other actions to address systemic racism."

The national-representative poll is based on 1,025 responses from parents of teens 13-18 years who answered questions about their views on teen involvement in demonstrations.

###


Concrete structure's lifespan extended by a carbon textile

Construction costs reduced by 40%, while improving fire resistance

NATIONAL RESEARCH COUNCIL OF SCIENCE & TECHNOLOGY

Research News

IMAGE

IMAGE: FAILURE TEST OF A CONCRETE SLAB STRENGTHENED WITH TRM PANEL view more 

CREDIT: KOREA INSTITUTE OF CIVIL ENGINEERING AND BUILDING TECHNOLOGY (KICT)

The Korea Institute of Civil Engineering and Building Technology (KICT) has announced the development of an effective structural strengthening method using a noncombustible carbon textile grid and cement mortar, which can double the load-bearing capacities of structurally deficient concrete structures and increase their usable lifespan by threefold.

More than 90% of infrastructures in South Korea, such as bridges and tunnels, as well as residential buildings were initially constructed out of concrete. For deteriorated or structurally deficient concrete structures in need of structural strengthening, carbon fiber sheets are typically applied to the surface of the concrete structure using organic adhesives. However, organic adhesives are susceptible to fire and cannot be applied to structures with wet surfaces. These carbon fiber sheets may detach and fall from the structure if they are exposed to moisture.

A research team in KICT, led by Dr. Hyeong-Yeol Kim, has developed an effective as well as efficient strengthening method for deteriorated concrete structures. With the developed method, thin precast textile reinforced mortar (TRM) panels, which are made of a carbon textile grid and a thin layer of cement mortar, are used. Furthermore, the TRM strengthening method can be applied in the form of cast-in-place construction. Employing KICT's method, 20 mm-thick TRM panels are attached to the surface of the existing structure, and then the space between the existing structure and the panels is filled with cement grout, with the cement grout serving as the adhesive.

Both the carbon textile and cement mortar are noncombustible materials that have a high resistance to fire, meaning that they can be effectively used to strengthen concrete buildings that may be exposed to fire hazards. The construction method can also be applied to wet surfaces as well as in the winter, and the panels do not fall off even in the event of water ingress. Additionally, unlike steel reinforcing bars, the carbon textile does not corrode, and thus it can be effectively used to strengthen highway facilities and parking buildings, where deicing agents are often used, as well as to strengthen offshore concrete structures that are exposed to a chloride-rich environment.

A failure test conducted in KICT indicates that the failure load of concrete structures strengthened with the TRC panel increased by at least 1.5 times compared to that of an unstrengthened structure. Furthermore, the chloride resistance of the TRM panel has been evaluated in order to assess its service life in a chloride-rich environment. The durability test and analysis of the TRM panel indicates that the lifespan of the panel is more than 100 years. This increase can be attributed to the cement mortar, developed by KICT, which contains 50% ground granulated blast furnace slag, an industrial byproduct generated at ironworks. The cement mortar, which has a higher fire resistance than conventional cement mortar, is also advantageous because its cost is half that of conventional mortar. In terms of economical efficiency, the newly developed method can reduce construction costs by about 40% compared to existing carbon sheet attachment methods.

The newly developed strengthening method uses thin TRM panels that are very versatile and can be used as building facades, repair and strengthening materials, and in other applications. In the future, if the panels can be fabricated with thermal insulators, it is expected that they will replace building insulation materials that are susceptible to fires.

Dr. Kim said, "For easier production and shipping, the TRM panels are manufactured in a relatively small size of 1 m by 2 m and must be connected at the construction site. A method for effectively connecting the panels is currently being developed, and performance tests of the method will be conducted by the end of 2020."

###

The Korea Institute of Civil Engineering and Building Technology (KICT) is a government sponsored research institute established to contribute to the development of Korea's construction industry and national economic growth by developing source and practical technology in the fields of construction and national land management.

This research project is funded by the Ministry of Science and ICT (MSIT) (FY 2018-2020). The outcomes of this project were published in the international journal Materials in September 2020, and the developed strengthening technology was registered at the European Patent Office (EP 3 486 403 B1) in August 2020.

- Journal Paper

Strengthening of Concrete Element with Precast Textile Reinforced Concrete Panel and Grouting Material. Published date: September 1, 2020.

Materials 2020, 13(17), 3856; https://doi.org/10.3390/ma13173856

- Patent

Concrete Structure Reinforcement Method Using an Embedded Grid, and Related Repairing and Strengthening Method. European Patent Office: Publication No. EP3486403B1. Published date: Aug. 20, 2020.

Disclaimer: AAAS and E


Liver cancer diagnoses and deaths impacted by geography and household income

WILEY

Research News

An analysis of information from a large U.S. cancer database indicates that patients with liver cancer from rural regions and lower income households often have more advanced cancer at the time of diagnosis and face a higher risk of death compared with other patients. The findings are published early online in CANCER, a peer-reviewed journal of the American Cancer Society (ACS).

Screening for liver cancer is important for detecting tumors at an early stage, when treatment is most effective. To explore the impact of different factors on liver cancer stage at the time of diagnosis and on survival of patients with the disease, Robert J. Wong, MD, MS, of the Veterans Affairs Palo Alto Health Care System and Stanford University School of Medicine, and his colleagues analyzed the most recently updated Surveillance, Epidemiology and End Results (SEER) cancer database from the National Cancer Institute. This database includes information from 21 U.S. regions, representing approximately 35 percent of the U.S. population.

From 2004 to 2017, there were 83,237 adults with liver cancer, among which 49.1 percent had localized disease at the time of diagnosis and 14.4 percent had advanced disease that had spread.

The team found that compared with patients in large metro areas with a population of more than 1 million people, patients in more rural regions had 10 percent higher odds of having advanced liver cancer at the time of diagnosis and 5 percent higher odds of dying. Also, compared with patients with an annual household income of at least $70,000, patients with an annual household income below $40,000 had 15 percent higher odds of having advanced cancer at the time of diagnosis and 23 percent higher odds of dying.

"While our study could not specifically investigate the reasons for the worse liver cancer outcomes, we hypothesize that patients living in more rural regions and among lower income households likely experience healthcare disparities leading to sub-optimal access to high quality liver disease care, including timely receipt of liver cancer surveillance and access to liver disease specialists," said Dr. Wong. "Our study highlights the need to focus on understanding the drivers of poor liver cancer outcomes among underserved and vulnerable populations, including those in rural geographic regions or among low income households, so that targeted quality improvement interventions can more specifically address the needs of these populations. We also hope that our findings will raise greater awareness of challenges and limited resources that contribute to sub-optimal liver disease care experienced by patients from low-income and rural households."

October is Liver Cancer Awareness Month.

###

Additional Information

NOTE: The information contained in this release is protected by copyright. Please include journal attribution in all coverage. A free abstract of this article will be available via the Cancer News Room upon online publication. For more information or to obtain a PDF of any study, please contact:

Dawn Peters +1 781-388-8408 (US)
newsroom@wiley.com
Follow us on Twitter @WileyNews

Full Citation:

"Hepatocellular carcinoma patients from more rural and lower income households have more advanced tumor stage at diagnosis and significantly higher mortality." Robert J. Wong, Donghee Kim, Aijaz Ahmed, and Ashwani K. Singal. CANCER; Published Online: October 26, 2020 (DOI: 10.1002/cncr.33211).

URL Upon Publication: http://doi.wiley.com/10.1002/cncr.33211

Author Contact: Laura C. Hutcheson, of the VA Palo Alto Health Care System's Public Affairs Office, at Laura.Hutcheson@va.gov or +1 650-493-5000, ext. 65402

About the Journal

CANCER is a peer-reviewed publication of the American Cancer Society integrating scientific information from worldwide sources for all oncologic specialties. The objective of CANCER is to provide an interdisciplinary forum for the exchange of information among oncologic disciplines concerned with the etiology, course, and treatment of human cancer. CANCER is published on behalf of the American Cancer Society by Wiley and can be accessed online.

Follow us on Twitter @JournalCancer

About Wiley

Wiley drives the world forward with research and education. Through publishing, platforms and services, we help students, researchers, universities, and corporations to achieve their goals in an ever-changing world. For more than 200 years, we have delivered consistent performance to all of our stakeholders. The Company's website can be accessed at http://www.wiley.com.