It’s possible that I shall make an ass of myself. But in that case one can always get out of it with a little dialectic. I have, of course, so worded my proposition as to be right either way (K.Marx, Letter to F.Engels on the Indian Mutiny)
Sunday, March 19, 2023
Battle Over Nuclear's Role In Renewable Energy Goals Continues
The battle over nuclear energy's role in the EU's renewable energy future is far from over, with Germany, Spain, and other EU countries fighting to keep nuclear energy from counting when it comes to calculating renewable energy targets, a letter seen by Reuters suggests.
France has made it clear that low-carbon hydrogen derived from nuclear energy should indeed count toward the bloc's renewable energy tarts. Spain, Germany, Denmark, Austria, Ireland, Luxembourg, and Portugal, strongly disagree. On Thursday, the group sent a letter to the rotating EU presidency, arguing that renewable targets should not include nuclear.
The EU is working towards establishing new renewable energy targets, but the stalemate over nuclear's role is hindering progress.
"Taking into account low-carbon hydrogen and low-carbon fuels in the 2030 (renewable energy) targets would decrease the ambition and slow down renewables deployment, which in turn would jeopardize the achievement of the climate targets," the letter reads in part.
The group has argued that while nuclear might be low-carbon, it is not renewable.
France relies on nuclear energy for 70% of its power, and any goals that don't include nuclear energy are unlikely to gain France's support—a reality that could result in a permanent stalemate when it comes to resetting the bloc's renewable targets. In December, nuclear power generation went a long way in alleviating a strain on its electricity grid as temperatures dropped below freezing—but avoiding power cuts as many had warned leading up to the colder weather.
France struggled last fall with nuclear power as more than half of its reactors were offline due to maintenance. Some argued at the time that France was in a tight spot with energy supply because of its slow rollout of renewable energy.
Another disagreement that is currently in the way of reaching a new renewable deal is Germany's balking at the car emissions agreement.
Electrification of Canada’s commercial vehicles may yield benefits earlier rather than later – report
Valentina Ruiz Leotaud | March 19, 2023 | Cat 795 AC mining truck on trolley at Boliden Aitik mine.
A recent report by Deloitte Canada makes a case for decarbonizing commercial vehicles as a measure that is eventually less expensive than maintaining internal combustion vehicles and that has a greater impact on emissions reductions than doing so on passenger vehicles.
According to the firm, a commercial vehicle can emit up to 21 times more CO2 than a light-duty passenger vehicle.
“Electric vehicles are expected to play a significant role in enabling companies to decarbonize their commercial fleets and reduce emissions at a competitive cost,” the report reads. “According to the International Energy Agency’s projections, EVs will comprise nearly 100% of commercial vehicle sales by 2050 in a net-zero scenario—compared to just 0.1% in 2020.”
In the view of the experts at Deloitte, it is important for organizations looking to reduce their emissions to move quickly when it comes to electrification. They believe that operators that are already working to electrify their fleets are better positioned to capture an important competitive advantage—and more market share—as their business customers increasingly shift to more carbon-efficient commercial transport providers to reduce their Scope 3 emissions.
Switching to EVs is also seen as a way to shelter companies from fluctuating gas and diesel prices, particularly considering the impacts of geopolitical events such as the war in Ukraine.
Also, electricity is cheaper than diesel per gigajoule of energy across most of Canada, except in Ontario, New Brunswick, Nova Scotia, and Prince Edward Island.
The higher energy efficiency of EVs means they should be much cheaper to operate, even in jurisdictions with high electricity prices like Ontario or low fuel prices like Alberta. Carbon tax
Savings connected to electrification are also related to the fact that Canada’s carbon tax is expected to continue to increase this decade, from $50 per tonne of CO2e in 2022 to $170 per tonne by 2030 (from 13 to 46 cents per litre). This means fuel prices are expected to rise more quickly than electricity prices over the same period.
“Organizations that are working to transform their fleet’s power source today will minimize the disruptive impacts of these regulatory changes on their businesses in the years to come,” the dossier notes.
The authors of the report do recognize that the transformation attached to electrification involves investing significant capital into vehicles and charging infrastructure. However, they do recommend that operators take advantage of the $3 billion in EV grants and incentives currently offered by Canada’s federal and provincial governments, particularly taking into account that these grants and incentives are both time-bound, expiring by 2027, and capped.
“Those who wait may find that the funds have been exhausted, requiring them to bear the full cost of their electrification efforts,” the dossier reads. “Taking early action also helps ensure that partnerships with EV manufacturers can be established to secure the vehicles and infrastructure required at a time when EV demand is outpacing supply. In addition, first movers can ally early with local utility companies to attain additional power supply that may be needed for on-site charging infrastructure.” Maintenance
In addition to considerations around charging infrastructure, rethinking and redesigning fleet operations, routing, and networks to account for things such as charging times and how extreme temperatures affect the performance and durability of EV batteries, Deloitte suggests thinking about the costs of operating electric vehicles.
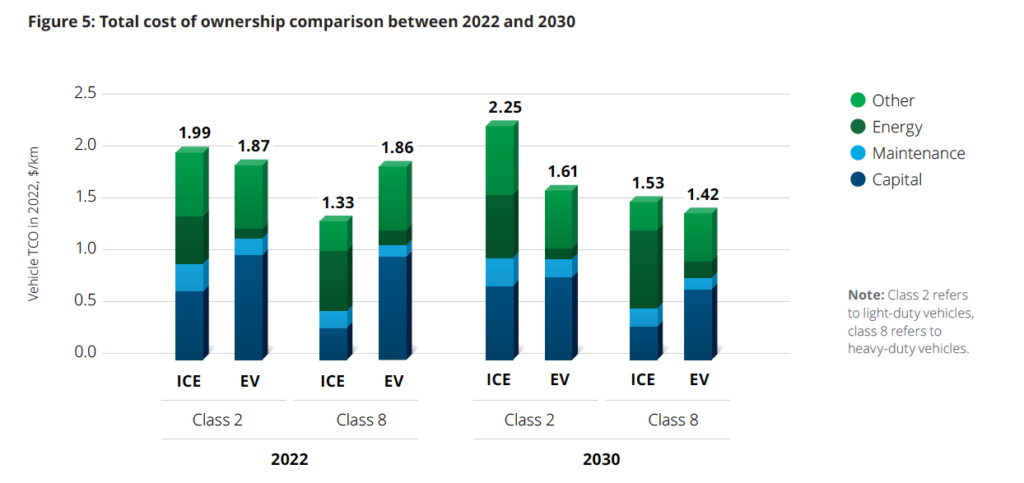
“EVs that require larger batteries to move large payloads or travel longer distances on a single charge cost significantly more than ICE vehicles; currently, a battery-electric class 8 truck can be up to four times more expensive than its diesel equivalent,” the dossier states. However, “as battery-electric technology costs are expected to decline, most class 8 commercial EVs are likely to reach TCO price parity by 2030.” The report notes that heavy-duty industries looking into electrification should also keep in mind that maintenance costs for EV trucks are 30% to 40% lower than those for traditional trucks.
(Graph by Deloitte).
“EV maintenance costs are lower than those of internal combustion engine (ICE) vehicles, helped by the fact that an EV drivetrain contains around 20 moving parts—compared to more than 2,000 moving parts in a typical ICE drivetrain,” the document points out. “The total cost of ownership (TCO) for some EVs is already lower than ICE vehicles.”
Finally, the market analyst believes that technological improvements should contribute to lower capital costs and the TCO over time, particularly taking into account that battery prices have steadily declined as manufacturing processes have improved and new battery chemistries identified.
“According to BloombergNEF, average battery pack prices could drop to $100/kWh by 2024, which would put the TCO of many EV models on par with their ICE equivalents,” the report states. “In addition, improving battery energy density means that new EVs will require less battery power to travel the same distance as older EVs—which translates to fewer battery cells and lower vehicle prices.”
BC
$10 billion Nisga'a-led LNG project gets green light to enter environmental review
Eva Clayton, president of the Nisga’a Nation, said the sooner the hydro power grid can be upgraded to help electrify LNG projects the better
Author of the article:Gordon Hoekstra Published Mar 19, 2023 •
Eva Clayton, president of the Nisga’a Nation.
PHOTO BY SEAN KILPATRICK /The Canadian Press
The Nisga’a-led $10-billion Ksi Lisims LNG project has been given the greenlight to enter the province’s environmental review process.
The decision on the export facility in northwest B.C. was announced by the B.C. Environmental Assessment Office last week, just days after the B.C. government gave final approval to the $2.4-billion Haisla Nation’s Cedar LNG project.
The Nisga’a’s project partners include a consortium of Canadian gas producers, Rockies LNG, and Houston, Tex.-based Western LNG.
The decision on Ksi Lisims kicks off a process that will set out how the review will take place, including the federal government’s role, and what will go into a final application and decision. The assessment process could take up to 18 months or more.
The recent LNG announcements highlight the increasing Indigenous involvement in major resource projects in B.C., and the benefits that can flow from the projects to First Nations.
But the prospect of more liquefied natural gas projects — which tap into B.C.’s vast northeast natural gas reserves for export to overseas markets — also raises significant questions on how the B.C. government will reach its legislated greenhouse gas emission targets.
Both projects tout themselves as achieving “net-zero” emissions, in part, by tapping into the B.C. Hydro’s power grid, but critics, which include First Nations, note the project will also increase emissions with increased natural gas extraction in northeast B.C.
Eva Clayton, president of the Nisga’a Nation, said the sooner the hydro power grid can be upgraded to help electrify LNG projects the better.
Without electricity, LNG plants, which liquefy gas for transport on ships, use the gas itself to power the equipment and significantly increases GHG emissions.
“I am pleased to see Premier (David) Eby’s remarks about the new LNG framework recognizing what we have long known: that economic reconciliation and net-zero LNG development go hand in hand,” Clayton said in a written statement.
Following approval of Cedar LNG last week, Eby announced a new strategy that will put a cap on all emissions from the oil and gas sector including from LNG production. It is meant to ensure B.C. meets its 2030 emissions reduction target for the sector.
He rejected the premise that responding to the climate crisis means always saying no to projects.
Ksi Lisims LNG estimates that if its facility is electrified annual GHG production would be under 200,000 tonnes a year, 0.3 per cent of B.C.’s annual emissions.
Without electrification, or if construction of the needed 95-kilometre power line is delayed, emissions would be up to 1.9 million tonnes a year, or nearly three per cent of annual emissions.
Those emissions would be in addition to millions of tonnes from the Cedar LNG project and the much larger LNG Canada, which is expected to be in operation in 2024.
While some First Nations in northwest B.C. have been supportive of the Ksi Lisims project, the Lax Kw’alaams has called for the environmental assessment application to be terminated.
“The project would induce the breach of B.C.’s legislated climate targets and would cause extraordinarily adverse effects to Lax Kw’alaams rights as proposed,” the First Nation said in a letter to the assessment office this month.
Environmental groups have long cited concerns that LNG projects will prevent B.C. from hitting its climate targets.
Wilderness Committee climate campaigner Peter McCartney said it’s impossible to keep approving new climate pollution and meet GHG emission reduction targets.
“The province has very clear commitments to reduce its greenhouse gas emissions, which these facilities are going to make it much harder to do, whether they’re led by First Nations or not,” observed McCartney.
British Columbia’s decision this week to toughen emissions standards for new liquefied natural gas (LNG) projects creates one of the most robust climate plans in North America, but sets a high hurdle for the industry even as many countries look to Canada to become a global supplier of gas.
As part of a new energy action framework, the western Canadian province will require proposed LNG projects that are going through or entering the environmental assessment process to have a credible plan to be net-zero emissions by 2030.
While the tougher regulation will not impact the huge Shell-led LNG Canada project already under construction, a proposed export terminal adjoining the small-scale Tilbury LNG facility and the early-stage Ksi Lisims LNG project in northern B.C. will fall under the new rule.
Canada is the world’s sixth-largest gas producer and its west coast LNG industry has seen revived interest as the world tries to secure alternatives to Russian gas supply following the invasion of Ukraine.
The province will start exporting 14 million tonnes per annum (MTPA) when LNG Canada enters service in 2025.
“That (net-zero requirement) is a very high bar and a high hurdle to pass,” said Mark Zacharias, executive director of think-tank Clean Energy Canada, adding the new framework rounds out B.C.’s plan to cut emissions 40% below 2005 levels by 2030.
“The B.C. roadmap to 2030 is probably North America’s strongest climate plan but what was missing until now was answers on dealing with oil and gas. This fills in the missing gaps.”
Ksi Lisims, proposed as a 12-MTPA plant, will achieve net zero through a fully electrified facility that utilizes renewable hydropower and carbon offsetting, spokesperson Rebecca Scott said.
FortisBC, one of the companies behind the Tilbury Marine Jetty project, said it welcomed the clarity the framework provides for LNG development and “looked forward to engaging with the government” on the 2030 guidelines.
B.C. released its energy action framework alongside a positive environmental assessment for the C$3-billion ($2.2 billion) Cedar LNG project, a joint venture between Haisla First Nation and Pembina Pipeline Corp.
The province said it will sign an agreement with the Haisla Nation to explore ways to lower emissions to near zero by 2030.
29dk2902l
OIL AND GAS CAP
B.C.’s new regulations also include an oil and gas emissions cap and plans to accelerate the electrification of the economy.
Tristan Goodman, CEO of the Explorers and Producers Association of Canada, said the framework is generally “constructive and positive”, but the industry had some concerns about how the cap would be implemented.
“The message from the province is ‘We believe we can develop natural gas and move forward broadly on Indigenous reconciliation while also meeting out climate ambitions’,” Goodman said. “That’s good, but the concern lies in the details.”
TC Energy, which is building the Coastal GasLink pipeline that will supply LNG Canada and Cedar LNG, said in a statement on Wednesday it was “carefully reviewing” the framework.
Cedar LNG Receives B.C. Environmental Approval and Signs Memorandum of Understanding with ARC Resources Ltd.
NASA's Roman Telescope: How James Webb's successor will map universe with colossal amounts of data NASA's next big space telescope will be the Nancy Grace Roman Space Telescope -
The James Webb Space Telescope is continuing to unravel the beauty and mystery of the cosmos since delivering its first images in July last year - but the mission to deploy the next big space telescope is already well underway.
The Nancy Grace Roman Space Telescope will be the next big space telescope to launch following the deployment of the latest NASA telescope, which itself was the successor to the still-active Hubble telescope.
Roman’s launch will usher in "a new age for astronomy," one of the European Space Agency (ESA) scientists working on the project told Euronews Next; it will gather more data than any other NASA mission launched before, and attempt to answer some of the biggest questions in astrophysics.
Scheduled to launch by 2027 at the latest, it will be able to capture "a more panoramic view of the universe and to allow more statistical studies," explained Marco Sirianni, ESA’s Science Operations Development Manager who is working on the project with NASA.
While a NASA-led mission, ESA is contributing some of the technology and expertise to the mission, in return for access to the unprecedented amount of data that it will deliver. How will Roman differ from Hubble and James Webb?
While Hubble and Webb are extremely good at zooming in to get a detailed look at small parts of the sky, Roman is going to have a much wider field of view.
It will be able to create infrared images that are 200 times larger than Hubble while providing the same rich level of detail with its similarly sized 2.4-metre diameter mirror.
So while it will be able to produce "exquisite" images, the likes of which we have gotten used to from Hubble and Webb, it is mainly "going to be a telescope dedicated for surveys," said Sirianni.
"In order to look for the star population in a nearby galaxy, which is very large for the field of view of Hubble, we have to stitch and do mosaics of very different shots. With Roman, we can take a picture of the full galaxy in one single shot," he says.
For example, a recent “mosaic" of our neighbouring galaxy Andromeda was put together with 400 individual images taken by Hubble. Roman will be able paint the same vast picture with the same level of detail with just two images. And these much larger images means there will be an unprecedented amount of data collected.
"Just to give you an idea, in 30 years of Hubble operating we have gathered something like 170 terabytes of data," explained Sirianni. "For Webb, we expect in five years to have 1,000 terabytes. And for the 5 years nominal life for Roman we expect to have 20,000 terabytes".
Ultimately, it will gather data on billions of galaxies to create a "3D model of the universe". Answering cosmic mysteries
With this panoramic view of the universe, NASA and its partners are hoping to answer some of the biggest questions facing astrophysics.
One of the goals is to test Albert Einstein’s theory of general relativity, which is well tested against the scale of our solar system for example, but less so on larger cosmological scales.
Visible matter within the universe should, according to the theory, slow down the expansion of the universe, so scientists attribute the speed of expansion of the universe to a mysterious component - dark energy - which they believe makes up roughly 68 per cent of the universe.
Roman will give us data that can accurately measure the position and distance of millions of galaxies and will help us to understand the expansion rate of the universe in different areas.
Ultimately, the results will tell us if Einstein's theory of gravity needs modification.
Exoplanet census
Another of Roman’s top goals is to spot thousands of new exoplanets within our galaxy, using a technique called gravitational microlensing.
"If two stars align to each other, the one in front will distort and magnify the light of the star behind. And if the star in the foreground has a planet, we will see the impact of that planet on the light of the star behind it," said Sirianni.
Given Roman will count billions of stars, it will provide a "very good census of how many stars will have exoplanets," he added.
Not only will it spot new exoplanets, but Roman will carry a second main instrument - called a coronagraph - which aims to image exoplanets that are close to their parent star. "This is a very difficult technique because the starlight has to be suppressed - it is orders of magnitude brighter than the objects that you want to study, the nearby planet," said Sirianni.
The coronagraph on Roman will attempt to directly capture large planets similar to Jupiter, conducting live corrections to improve image quality.
It will be a demonstration instrument - and if it proves to work, it will form the baseline for the technology to be used on future space observatories that will be attempting to directly image Earth-like planets in the habitable zone of their parent star.
ESA's contribution to Roman
ESA is contributing three key pieces of technology to the Roman mission, in return for access to the data and a seat at the table during the mission.
The space agency will provide "star trackers," small telescopes in the spacecraft that constantly determine its position in the sky by tracking stars. Then it will provide batteries to help power the spacecraft before its solar panels are deployed.
And finally, it will also supply detectors for the coronagraph onboard.
Furthermore, ESA’s own mission to measure the expansion of the universe and reveal more about dark energy is launching this summer.
The Euclid space telescope will gather the information that will then be complementary to the data gathered by Roman.
Like ESA’s contribution to Roman, NASA is making small contributions to the Euclid mission too.
A perspective view across Maat Mons on Venus, based on Magellan radar data. Credit: NASA/JPL
Venus is almost the same size, mass and density as Earth. So it should be generating heat in its interior (by the decay of radioactive elements) at much the same rate as the Earth does. On Earth, one of the main ways in which this heat leaks out is via volcanic eruptions. During an average year, at least 50 volcanoes erupt.
But despite decades of looking, we've not seen clear signs of volcanic eruptions on Venus—until now. A new study by geophysicist Robert Herrick of the University of Alaska, Fairbanks, which he reported this week at the Lunar & Planetary Science Conference in Houston and published in the journal Science, has at last caught one of the planet's volcanoes in the act.
It's not straightforward to study Venus's surface because it has a dense atmosphere including an unbroken cloud layer at a height of 45-65km that is opaque to most wavelengths of radiation, including visible light. The only way to get a detailed view of the ground from above the clouds is by radar directed downward from an orbiting spacecraft.
A technique known as aperture synthesis is used to build up an image of the surface. This combines the varying strength of the radar echos bounced back from the ground—including the time delay between transmission and receipt, plus slight shifts in frequency corresponding to whether the spacecraft is getting closer to or further from the origin of a particular echo. The resulting image looks rather like a black and white photograph, except that the brighter areas usually correspond to rougher surfaces and the darker areas to smoother surfaces.
Venus seen in ultraviolet light by Japan’s Akatsuki spacecraft in December 2016. The surface cannot be seen. Credit: ISAS/JAXA
NASA's Magellan probe orbited Venus from August 1990 to October 1994 and used this sort of radar technique to map the planet's surface with a spatial resolution of about a hundred meters at best. It showed that over 80% of the surface is covered by lava flows, but just how recently the youngest of them were erupted, and whether any eruptions continue today, remained a mystery for the next three decades.
There have been various hints of activity provided by spacecraft peering into, and sometimes through, the clouds—suggesting that the rocks there are so young that their minerals have not yet been altered by reaction with the acidic atmosphere and so are freshly erupted lava. Thermal anomalies that could correspond to active lava flows have also been detected, as have temporary local hiccups in the atmospheric sulfur dioxide concentration—another potential sign of volcanic eruptions. But none of these was fully convincing.
Volcanic vent spotted
140 km wide Magellan radar image of Venus showing lava flows (bright because they are rough) that have begun to encroach on an older impact crater. Credit: NASA/JPL
The new study now seems to have settled the matter, by revealing changes on the surface that really have to be a result of volcanic activity. The authors spent hundreds of hours comparing Magellan radar images of parts of Venus that had been imaged more than once to look for new or changed features on the surface.
They concentrated on the most promising volcanic regions, and eventually spotted an example where details on an image recorded in October 1991 are different to those on an image from February of the same year. The changes they saw are best explained by a volcanic eruption within that time window.
Using radar images to verify surface changes is tricky because the appearance of even an unchanging surface can differ according to surface slopes and direction of view. However, the researchers performed simulations to verify that the observed changes could not result from these things.
Close-ups of the active volcanic vent north of the summit of Maat Mons in February and October 1991. Between those dates the vent enlarged and changed shape, and new lava flows seem to emerged. Credit: NASA/JPL
The paired images show an initially near circular volcanic crater about 1.5km across that between February and October doubled in size by extending eastwards. It also became shallower, and the authors suggest that the crater is a volcanic vent that partially collapsed and was largely filled by fresh lava during October.
There are probably also new lava flows extending several kilometers down slope, northwards of the crater, which either flooded over the crater rim or leaked out of an associated fissure. The active crater sits high on Maat Mons, one of Venus's largest volcanoes whose summit is 5km above the surrounding plains.
Future missions
Most planetary scientists already expected Venus to be volcanically active. The focus of attention will now surely turn to how often, and at how many sites, are eruptions occurring on Venus. The biggest surprise in all this is that it took so long for someone to find the evidence for surface changes that had been lurking in the Magellan data for 30 years.
Maat Mons. The arrow points to the location of the volcanic vent that erupted in 1991, which is too small to show up at this scale. Credit: NASA/JPL
The likelihood of finding and studying ongoing volcanism is one of the main drivers for NASA's Veritas mission and Esa's EnVision mission (both approved in 2021). Each will carry a better imaging radar than Magellan. EnVision is intended to reach its orbit about Venus in 2034. Originally Veritas should have been there several years beforehand, but there have been delays to the schedule.
With NASA's DaVinci mission likely to arrive year or two ahead of them, providing optical images from below the clouds during its descent, we are in for an exciting time about ten years from now.
Giants and dwarfs: The curious ‘island effect’ that makes species vulnerable to extinction The Komodo dragon is a well-known example of a phenomenon referred to as the ‘island effect.’ - Copyright Max Letek
From dwarf hippos to oversized mice, island-dwelling animals have evolved in extraordinary ways.
The dodo - a giant flightless pigeon - is a well-known example of a phenomenon referred to as the ‘island effect.’
One consequence of the ‘island effect’ is animals going one way or the other, evolving into either giants or dwarfs.
A new study has also now found that these curious creatures are at a higher risk of extinction than other animals.
Here’s why many island species have died out and where you can still see the ones in existence today. What is the island effect?
Mammals, birds, reptiles, and some amphibians living on islands have been shown to evolve in radically different ways to their mainland relatives.
According to the ‘island rule,’ small species tend to evolve to be much bigger while larger species shrink.
Around 10,000 years ago, islands in the Mediterranean were covered in dwarf hippos and elephants.
At the other end of the scale, the dodo of Mauritius and the Komodo dragon are examples of oversized species.
A 2021 study found that extent of animal dwarfism or gigantism depends partly on the size and isolation of the island.
Smaller, more remote islands resulted in more pronounced size changes in species.
The study also found that factors such as limited resources and space were a major cause of animals downsizing as they adapted to smaller habitats.
On the other hand, lower competition and the lack of predators meant species were often freed from evolutionary restrictions in size.
What island effect animals exist today?
Although many island species are now extinct, there are several you can still find today.
On the Philippine island of Mindoro there is a diminutive buffalo that measures 21 per cent the size of its closest continental relative.
Nearby islands are home to a spotted deer that is 26 per cent the size of its mainland equivalent.
In Jamaica’s Hutia, a giant rodent measures four and a half times its closest mainland relative.
Island giants and dwarfs are at a greater risk of extinction
According to a recent study published in the journal Science, the plus sized and pint sized island creatures are subject to an elevated extinction risk.
After examining 1,231 existing species and 350 extinct ones over the last 23 million years, the researchers found that those with the most dramatic size changes had the highest extinction risk.
This threat is also increasing, the report found, endangering some of the world’s most fascinating species.
The arrival of human settlers on islands raised the extinction rate by more than ten times.
People bring diseases and invasive predators, disrupting island ecosystems. Through hunting and habitat destruction, humans also imperil island species.
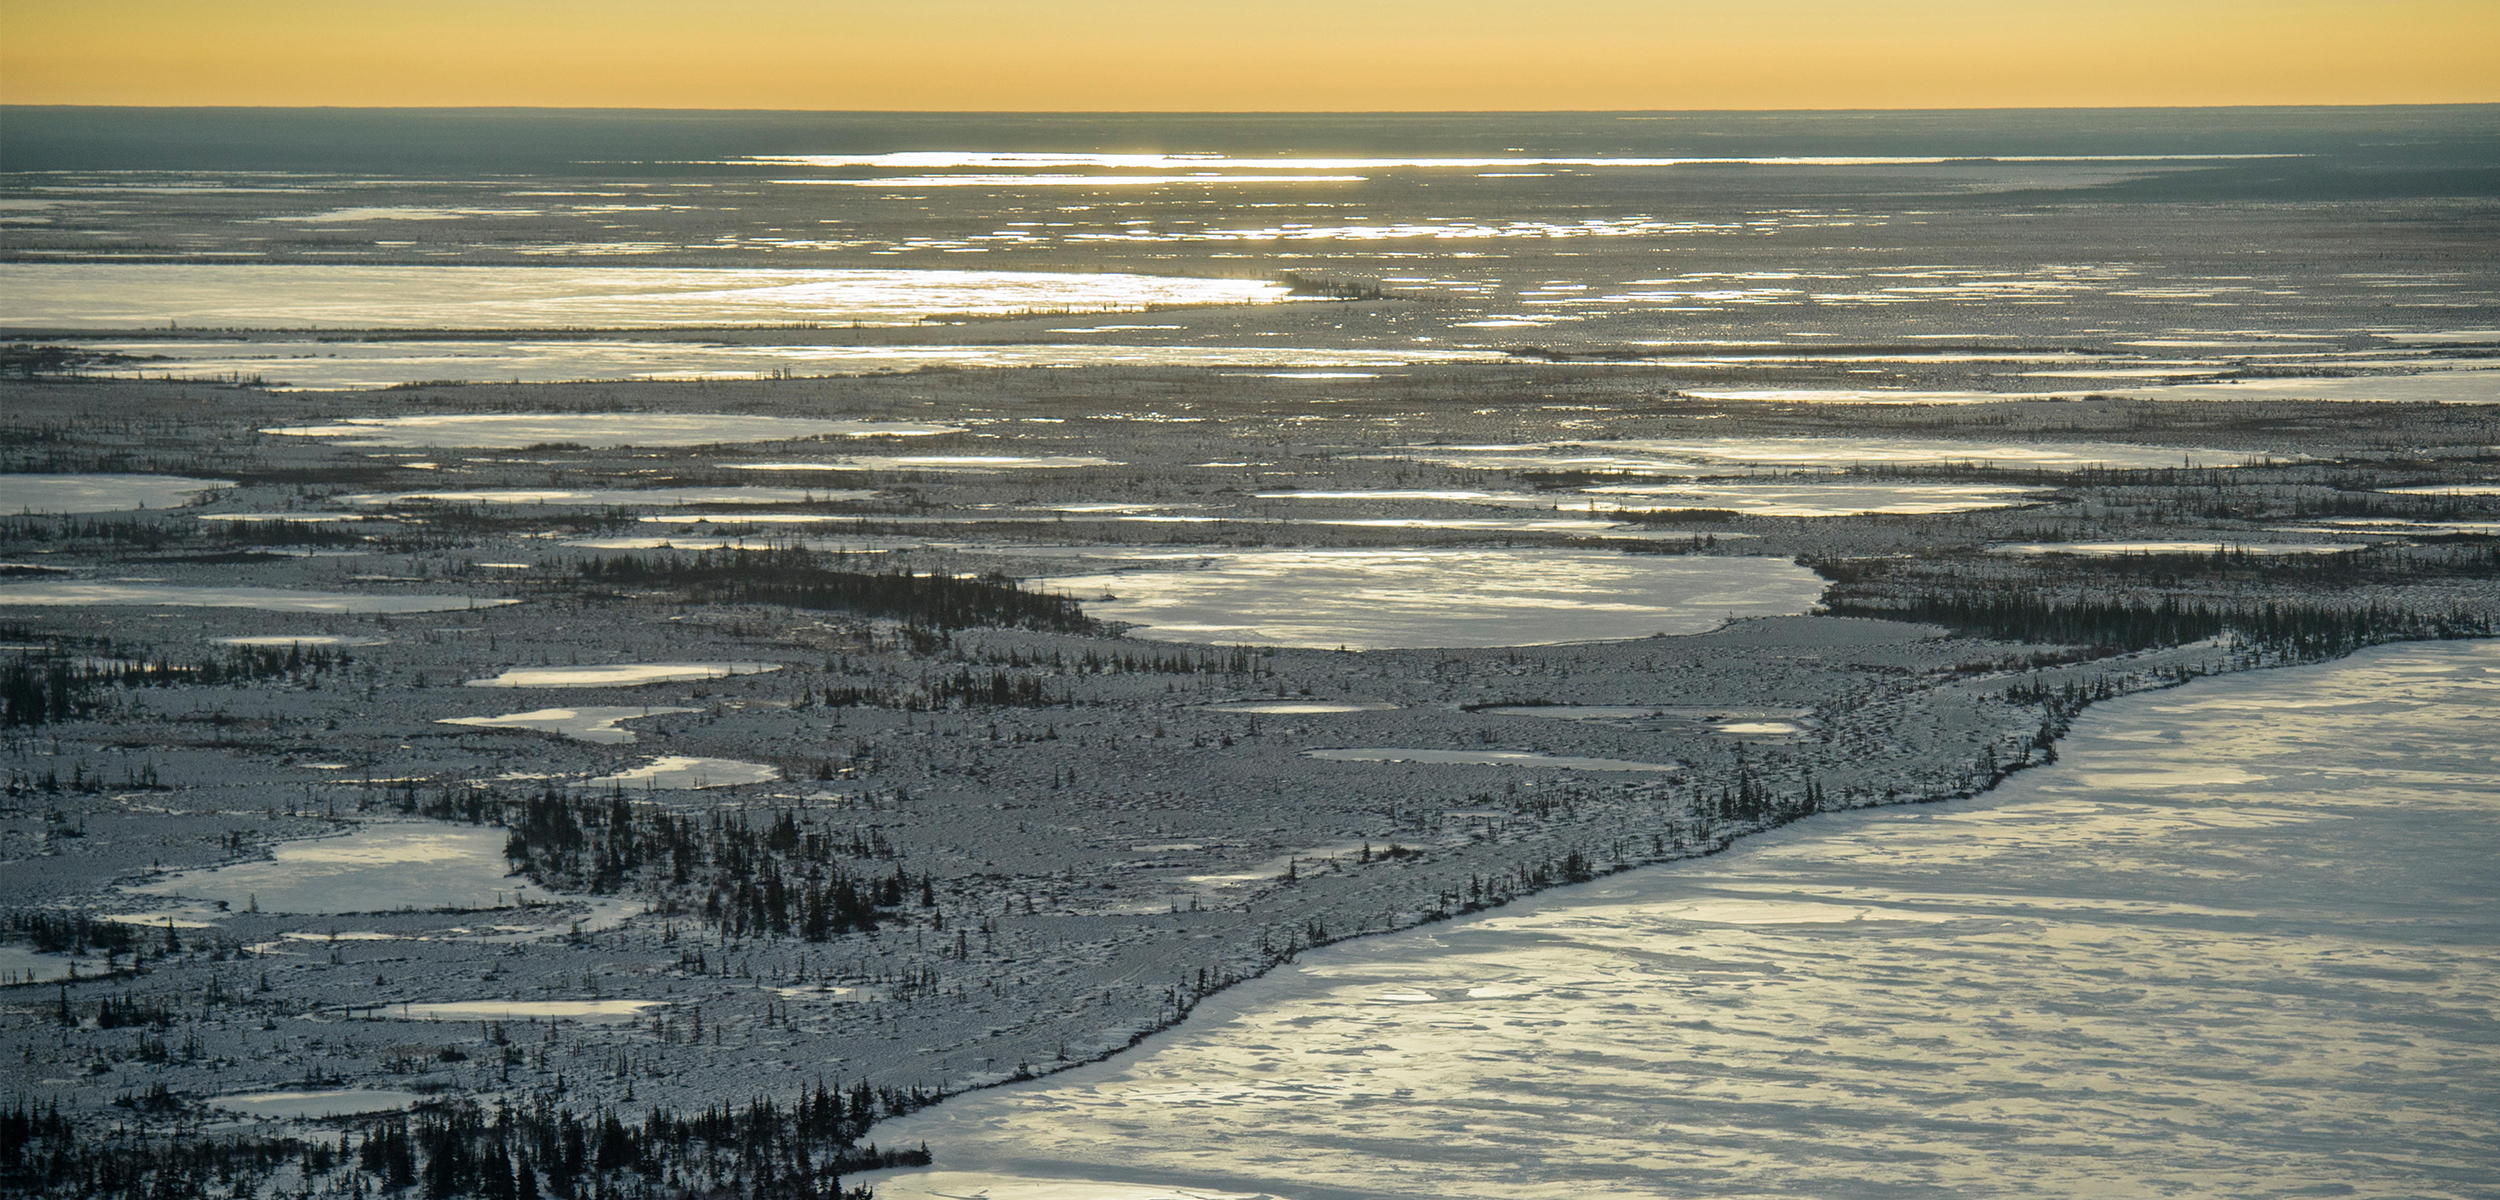
The Toxic Threat in Thawing Permafrost Scientists are tracking neurotoxic methylmercury production in North America’s largest peatland. Much mercury is locked away inside permafrost. As the ground thaws, this toxin threatens to emerge.
Covering nearly the same area as Norway, the Hudson Bay Lowlands in northern Ontario and Manitoba is home to the southernmost continuous expanse of permafrost in North America. Compared with many marine waterways this far south, Hudson Bay stays frozen late into the summer, its ice-covered surface reflecting sunlight and keeping the surrounding area cold.
The influence of Hudson Bay on the weather is crazy, says Adam Kirkwood, a graduate student at Carleton University in Ottawa, Ontario. “It can be sunny and 20 °C one day in August, and then half an hour later there’s a wicked wind coming in from the bay—it’s 5 °, and you’re putting on all your layers, and you’re still freezing cold. And when it’s neither of those two things,” he says, “it’s very, very buggy.”
Trapped in all that permafrost is 30 billion tonnes of carbon. It’s an unfathomable amount, says Kirkwood. With global warming, the permafrost is thawing, threatening to release a “carbon bomb” of heat-trapping methane gas to the atmosphere. But there’s something else lurking in the permafrost, too. Something that has the potential to be more immediately dangerous to the people and wildlife living in the area: mercury.
Wildfires and volcanoes belch mercury and since the Industrial Revolution so, too, do coal-burning power plants and factories. Warm air currents carry mercury in its inorganic heavy metal form to the Arctic where it settles into the soil and vegetation before being safely locked away in the deeply frozen permafrost.
In its inorganic form, mercury is less threatening to people. But as the permafrost thaws, says Kirkwood, mercury is finding its way into the soil and into the regions’ many ponds, rivers, and lakes. Once there, microbes can convert inorganic mercury into the form to be concerned about: neurotoxic methylmercury.
For the Indigenous peoples of northern Ontario who have lived off the peatlands for thousands of years—hunting caribou, catching fish, and gathering native plants—the lurking threat poses a risk to their way of life.
So for the past six years, Kirkwood has been coming to this remote environment every summer, helicoptering in to drill thick cores of peat and bringing them back to his lab for analysis. On these trips, Kirkwood often has help from Sam Hunter, a self-taught independent scientist from Peawanuck, Ontario.
Back in the 1970s, Hunter saw how scientists studying the Hudson Bay Lowlands used Indigenous peoples as guides, but didn’t involve them in their research. Now, he says, there’s a co-management process—he accompanies researchers on their fieldwork and helps bring their findings back to local communities. Bringing together outside scientists and traditional knowledge is important, he says, because Indigenous peoples have seen firsthand how the permafrost is changing.
“Walking on permafrost is like walking on really hard ground, like gravel,” says Hunter. When there’s permafrost, he says, “there’s all kinds of flora. There’s berries, vegetation that animals feed on. We collect wild tea.”
But once the permafrost thaws, he says, “the environment turns into a swampland. … You can’t even walk, you’d sink.” Along with the disappearing permafrost “go the animals. They move higher and higher into the Arctic. Muskox has disappeared and a few shorebirds we used to have—they’re moving north.”
Methylmercury seeping out of the permafrost is the latest water-quality issue First Nations communities in the region have faced. Closer to the Manitoba border, industrial mercury pollution from the 1960s still affects 90 percent of the Anishinaabe community Grassy Narrows. Many First Nations communities across Canada still lack clean drinking water. In the absence of government support for water-quality testing, Hunter has trained three community members in Peawanuck to test their water and fish.
Whether all of the mercury idling in the permafrost will become a significant threat to locals hinges on the answers to a few outstanding questions—questions Kirkwood aims to answer.
A decade ago, scientists discovered that certain microbes with a specific gene can convert inorganic mercury into toxic methylmercury. Scientists know some microbes have this ability and others don’t, but efforts to relate the abundance of microbes with mercury methylating potential to the amount of methylmercury in the environment have been unsuccessful. That’s led scientists studying mercury cycling, like Andrea Bravo at the Institute of Marine Sciences in Spain, to theorize that there’s more at play dictating the pace of methylmercury production, like the complex relationships between the entire community of microbes in the soil.
That’s where Kirkwood’s research comes in. By drilling and taking core samples of the permafrost, then measuring the amount of inorganic mercury while at the same time sequencing the DNA of everything in the soil, he hopes to better understand how methylmercury gets produced in thawing permafrost. Once he knows that, he can figure out where the threat is largest by looking at where mercury methylating microbes and inorganic mercury overlap.
“It’s a hot topic, a timely research question,” says Bravo, who isn’t involved in Kirkwood’s research. “We are suddenly having a surface of soil that was not reactive before, and it’s becoming reactive. … We don’t know how much mercury is coming from this permafrost.”
Bravo points out there are still many unknowns in efforts to gauge the mercury threat. For one, it’s still not yet possible to accurately predict methylmercury levels in freshwater waterways or the ocean based on land sources. Despite global research efforts, “we still don’t understand the process completely,” she says. “We’ve put in a lot of effort, but we aren’t there yet.”
So far, Kirkwood’s initial findings show reason for hope. Previous Arctic-scale estimates of inorganic mercury abundance have vastly overestimated how much mercury is being stored in the Hudson Bay Lowlands. Kirkwood’s cores show mercury levels 10 times lower. But that doesn’t mean all is well. In thermokarst fens, meltwater ponds created when iceberg-like permafrost chunks thaw, methylmercury levels are higher than in the surroundings. As more permafrost thaws and these ponds connect, methylmercury production will likely increase. And if this mercury reaches the bay, biomagnification could cause it to build up to high concentrations, making its way up the food chain from algae to the tissue of fish that people catch and eat.
One of the things Hunter says he’s been told by the scientists who come up from the south is that the polar bear is the barometer for climate change. “And I don’t agree with that. I think the barometer for climate change is the palsa, the melting permafrost,” he says. “And I think that we need to understand what’s coming out of the ground now.”
Mind-Bending Animation Shows How The Universe Would Look if We Could See Gamma Rays
Most of the light streaming through the Universe is invisible to human eyes. Beyond the mid-range wavelengths we can see, there's a whole cosmos shining in high- and low-energy radiation.
But we humans are clever little animals and have managed to build instruments that can see the light we cannot. One of these is NASA's Fermi Gamma-ray Space Telescope, an observatory hanging out in low-Earth orbit, monitoring the sky for gamma rays, the highest-energy light in the Universe.
Fermi constantly surveils the entire sky, observing gamma-ray sources and how they change over time, providing astronomers with a map of the various producers of gamma radiation that we can detect. This data is compiled into a catalog that scientists can use to probe the production of gamma radiation.
The animation represents a year of fluctuating gamma radiation from 1,525 sources, represented by pulsing purple circles, collected between February 2022 and February 2023, with each frame representing three days' worth of observations. The larger the circle, the brighter the gamma radiation.
The yellow circle, meanwhile, represents the apparent path of the Sun across the sky for that time period.
"We were inspired to put this database together by astronomers who study galaxies and wanted to compare visible and gamma-ray light curves over long time scales," says astrophysicist Daniel Kocevski of NASA's Marshall Space Flight Center in Huntsville.
"We were getting requests to process one object at a time. Now the scientific community has access to all the analyzed data for the whole catalog."
Fermi's field of view, with the plane of the Milky Way stretching across the center. (NASA's Marshall Space Flight Center/Daniel Kocevski)
Most of the flashing lights you see come from a type of galaxy known as blazars. These are a subset of quasar galaxies. A quasar is a galaxy with an extremely active nucleus, meaning the supermassive black hole is guzzling down material at a tremendous rate. This material is heated up by the extreme activity around the black hole so that it blares across space. Quasars emit the brightest light in the Universe.
Some of these quasars have jets of plasma launched from the galactic nucleus. As the black hole feeds, some of the material swirling around it is diverted and accelerated along the magnetic field lines outside the event horizon. When it reaches the poles, this material is launched into space at high speeds, often approaching the speed of light in a vacuum.
A blazar is a quasar whose jet is pointed at, or nearly at, Earth. Because of this orientation, the light appears even brighter across the entire spectrum. Blazars are known sources of gamma radiation, but their light fluctuates on pretty short timescales; their fluctuations can help astronomers study how these giants feed.
Combined with other data, they can also help answer questions about the Universe. For instance, only recently have detections of neutrinos made by observatories such as IceCube in Antarctica been traced back to blazar galaxies.
Blazars represent over 90 percent of the gamma-ray sources in the new addition to the Fermi gamma-ray catalog. The other objects emitting gamma radiation include a type of neutron star called pulsars, the tattered remnants of material leftover by supernova explosions, and binary systems such as binary neutron stars.
And there's the gamma-ray glow of the plane of the Milky Way galaxy, represented in the animation by a blobby orange band stretching across the center of the image. There, brighter color represents a more radiant glow.
The long-period observations will hopefully provide deeper insight into some of the phenomena associated with gamma-ray sources. For instance, tracing a neutrino to a brighter period of a blazar's activity could help narrow down the processes that produce these mysterious particles.
"Having the historical light curve database," says astrophysicist Michela Negro of the University of Maryland, Baltimore County, and NASA's Goddard Space Flight Center, "could lead to new multimessenger insights into past events."
And we get a hint of how we might see the Universe if we had alien eyes.


 that have begun to encroach on an older impact crater. Credit: NASA/JPL")