Monday, October 05, 2020

Ice discharge in the North Pacific set off series of climate events during last ice age

by Oregon State University
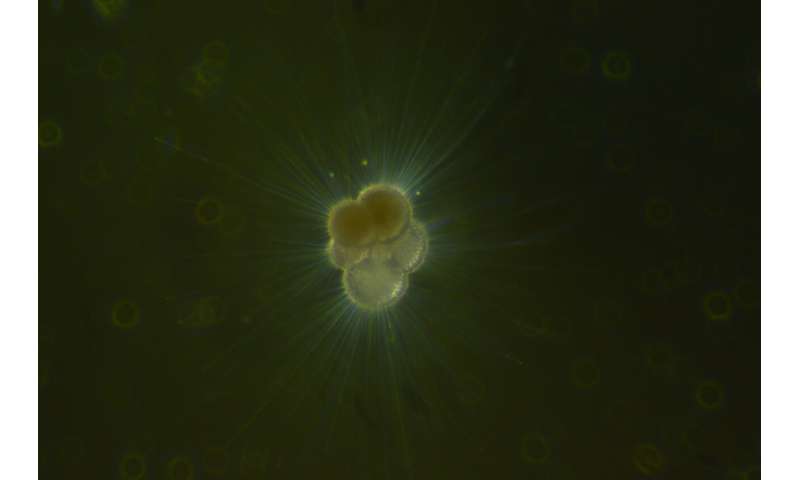
Living planktic foraminifera from the North Pacific. Credit: Jennifer Fehrenbacher, Oregon State University

Repeated catastrophic ice discharges from western North America into the North Pacific contributed to, and perhaps triggered, hemispheric-scale changes in the Earth's climate during the last ice age, new research published online today in Science reveals.

The discovery provides new insight into the impact rapidly melting ice flowing into the North Pacific may have on the climate across the planet, said Maureen Walczak, a paleoclimatologist in Oregon State University's College of Earth, Ocean, and Atmospheric Sciences and the study's lead author.

"Understanding how the ocean has interacted with glacial ice in the past helps us predict what could happen next," Walczak said.

The Cordilleran ice sheet once covered large portions of western North America from Alaska to Washington state and western Montana. Radiocarbon dating and analyses of the marine sediment record revealed that recurrent episodes of discharge from this ice sheet over the past 42,000 years were early events in a chain reaction of disturbances to the global climate. These disturbances triggered changes in deep ocean circulation and retreat of ice sheets in the North Atlantic.

The findings challenge theories that those massive, globally-reaching disturbances originated in the North Atlantic as rapid ice loss from the Laurentide ice sheet, another massive ice sheet that covered much of Canada and the northern United States, including the upper Midwest and Northeast. The Laurentide ice loss events are known as Heinrich Events.

"The outcome of this research was unexpected. The data irrevocably says that the Pacific ice goes first, with Heinrich Events and other changes following in a rhythm. The Pacific Ocean sets the drum beat," Walczak said. "This is a paradigm shift in our thinking about how these events are connected."

To gain insight into the climate history of the North Pacific, an international team of researchers collected and analyzed sediment cores from the northern Gulf of Alaska that were recovered by drilling as part of the International Ocean Discovery Program.
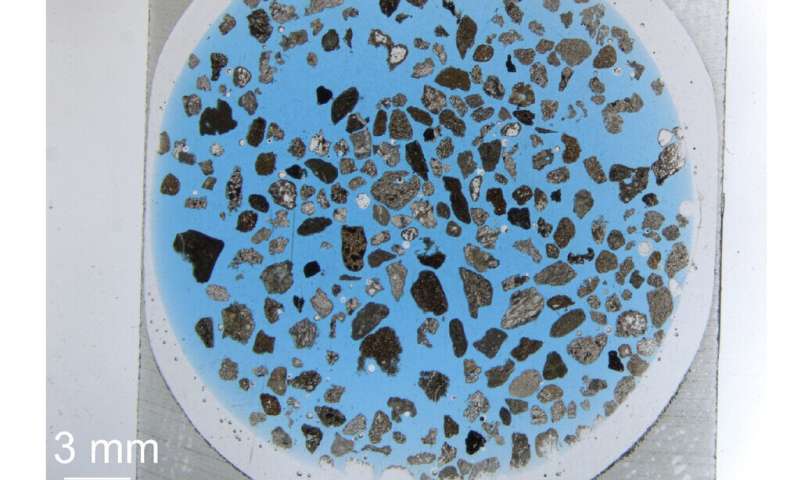
Epoxy sand grain mounts of iceberg rafted debris in sample 341_19E14H2W_100 in cross polarized light and plane light. Credit: Gina M. Carney (Appalachian State University)

"Getting these new insights took years of work. We first mapped the seafloor and recovered short sediment cores in 2004, drilled longer cores in 2013 and had 16 years of painstaking laboratory work involving several Ph.D. students," said Alan Mix, the project's principal investigator and co-author of the paper.


"This was a virtually unknown area when we started, and now it offers among the most detailed and best-dated long records of ocean change on the planet during the ice age," said Mix, a distinguished professor in OSU's College of Earth, Ocean, and Atmospheric Sciences.

Researchers measured radioactive isotopes of carbon using two particle accelerators to establish the chronology of events and also added meticulous counts of small rocks dropped by icebergs known as ice-rafted debris.

The research team traced the source of the ice-rafted debris back to purges of massive ice streams emanating from the Cordilleran ice sheet, which covered northern Washington, most of British Columbia and southern Alaska from about 70,000 to 17,000 years ago.

Dirty icebergs broke off from surging ice streams and drifted northward in ocean currents, carrying and eventually dropping their load of sand, pebbles and gravel, leaving a record of rapid ice retreat buried in the deep sea like sunken treasure.

The authors of the study named these Alaskan iceberg dumps "Siku Events" after the Inuit word for ice. The big surprise, discovered by combining the record of glacial debris with the radiocarbon chronology, was that Siku Events immediately preceded Heinrich events, which are a similar type of ice purge in the North Atlantic.

Scientists have been aware of Heinrich Events, from similar evidence of ice-rafted debris in the North Atlantic, for more than 30 years but the trigger for those events has never been convincingly explained, the researchers said.
 
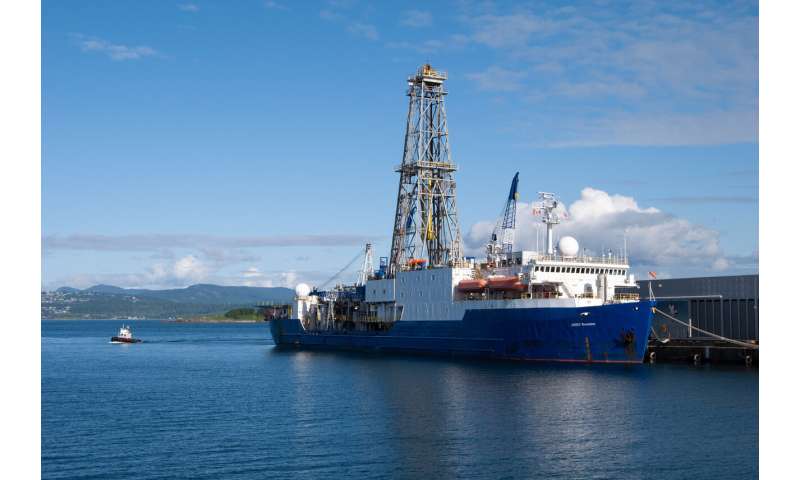
Research vessel JOIDES Resolution in port in Victoria, British Columbia, prior to Integrated Ocean Drilling Program's Expedition 341, to investigate the Southern Alaska Continental Margin. Credit: A.L. Slagle

It makes sense for the Pacific Ocean to be involved in major planetary changes, Mix said. The Pacific Ocean is connected to the rest of the world by large-scale atmospheric circulation and physically around Antarctica, and during times of high sea level, through the Bering Strait and the Arctic Ocean to the North Atlantic.

"The Pacific Ocean is the largest exchangeable reservoir of heat and water and carbon dioxide on Earth, simply because of its massive size," he said. "It really is the 800-pound gorilla in the zoo of climate beasts."

Today the ice that remains along the coast of Alaska is mostly retreating and may be gone within this century as the climate warms. The melting ice will drain to the Pacific and the Arctic, contributing to sea level rise and impacting the balance of buoyant fresh and dense salty water in the ocean, much as it did in the past.

If the current ice melt follows patterns of the past, and happens quickly, it could contribute to the retreat of distant glacial systems in the North Atlantic and the Arctic.

"This is yet another reason that it is prudent to slow down warming by reducing our fossil-fuel use," Mix said.

"The new findings are likely to fuel increased interest in the North Pacific, an area that has not been as well-studied as other parts of the planet," Walczak said.

One thing that remains unclear is why the discharges from the Cordilleran ice sheet occurred. Researchers also would like to better understand the relationship between the discharges of the Cordilleran and the other climate events.

"Why did the other ice sheets respond to the retreat of the Cordilleran? How fast do the dominoes fall in this sequence of events?" Walczak asked. Those are among the questions the research team is continuing to investigate.


Explore further
Freshwater flowing into the North Pacific plays key role in North America's climate
More information: M.H. Walczak el al., "Phasing of millennial-scale climate variability in the Pacific and Atlantic Oceans," Science (2020). 
Journal information: Science

Provided by Oregon State University
Alien species to increase by 36% worldwide by 2050

by University College London
Egyptian goose (Alopochen aegyptiaca) originally from Africa and now established in Central and Western Europe. Credit: Professor Tim Blackburn, UCL

The number of alien (non-native) species, particularly insects, arthropods and birds, is expected to increase globally by 36% by the middle of this century, compared to 2005, finds new research by an international team involving UCL.

Published in Global Change Biology, the study also predicts the arrival of around 2,500 new alien species in Europe, which translates to an increase of 64% for the continent over the 45-year period.


The research team led by the German Senckenberg Biodiversity and Climate Research Centre hope it should be possible to reduce this number with stricter biosecurity regulations.

Alien species are those that humans have moved around the world to places where they do not naturally occur. More than 35,000 such species had been recorded by 2005 (the date of the most recent comprehensive global catalogue). Some of these aliens can go on to become invasive, with damaging impacts to ecosystems and economies. Alien species are one of the main drivers of extinctions of animals and plants.

Co-author Professor Tim Blackburn (UCL Centre for Biodiversity & Environment Research and the Institute of Zoology, ZSL) said: "Our study predicts that alien species will continue to be added to ecosystems at high rates through the next few decades, which is concerning as this could contribute to harmful biodiversity change and extinction.

"But we are not helpless bystanders: with a concerted global effort to combat this, it should be possible to slow down or reverse this trend."

For the study, the research team developed a mathematical model to calculate for the first time how many more aliens would be expected by 2050, based on estimated sizes of source pools (the species that could end up becoming invasive) and dynamics of historical invasions, under a 'business-as-usual' scenario that assumes a continuation of current trends.

The model predicts a 36% increase in the number of alien plant and animal species worldwide by 2050, compared to 2005 levels.
Box tree moth, native to east Asia and now found across Europe. Credit: Professor Tim Blackburn, UCL

The study identifies high levels of variation between regions. The largest increase is expected in Europe, where the number of alien species will increase by 64% by the middle of the century. Additional alien hotspots are predicted to include temperate latitudes of Asia, North America, and South America. The lowest relative increase in alien species is expected in Australia.


Europe will also see the largest increase in absolute numbers of alien species, with around 2,500 new aliens predicted.

Lead author Dr. Hanno Seebens (Senckenberg Biodiversity and Climate Research Centre, Germany) said: "These will primarily include rather inconspicuous new arrivals such as insects, molluscs, and crustaceans. In contrast, there will be very few new alien mammal species such as the well-known raccoon."

Co-author Dr. Franz Essl (University of Vienna) added: "Increases are expected to be particularly large for insects and other arthropods, such as arachnids and crustaceans. We predict the number of aliens from these groups to increase in every region of the world by the middle of the century—by almost 120% in the temperate latitudes of Asia."

The study also predicts that the rate of arrival of alien species will continue to increase, at least in some animal groups. Globally, by 2050, alien arthropod and bird species in particular will arrive faster than before, compared to the period 1960—2005. In Europe, the rate of new alien arrivals is expected to increase for all plant and animal groups except mammals.

Neither a reversal nor even a slowdown in the spread of alien species is in sight, as global trade and transport are expected to increase in the coming decades, allowing many species to infiltrate new habitats as stowaways.

Dr. Seebens said: "We will not be able to entirely prevent the introduction of alien species, as this would mean severe restrictions in international trade.

"However, stricter regulations and their rigorous enforcement could greatly slow the flow of new species. The benefits of such measures have been shown in some parts of the world. Regulations are still comparatively lax in Europe, and so there is great potential here for new measures to curtail the arrival of new aliens."

Explore further
Disease-spreading ticks keep marching north as weather stays warmer

by Robert Langreth, Bloomberg News
 
Credit: Pixabay/CC0 Public Domain

Ticks are among nature's most hardy survivors. They've been around for at least 100 million years and used to feast on dinosaur blood. Their bodies contain anti-freeze to help them survive cold weather and their two front legs have carbon dioxide and infrared sensors to help detect when a warm-blooded mammal is approaching. Tiny hairs on their legs increases friction and allows ticks to latch onto animals that brush by. And blacklegged ticks, which spread the most disease in the U.S., are notoriously un-picky eaters, happy to ingest the blood of numerous mammals and birds, making them perfect for spreading disease from one species to the next.

Blacklegged ticks and their counterparts abroad used to be confined to certain climates, especially milder and humid temperate zones such as coastal New England. Now, they're present in places farther north where they didn't use to appear.

Researchers in Sweden were astonished when, in the 1990s, they discovered ticks creeping up the Baltic Coast and into the sparsely populated Northland. The disease-ridden prehistoric creatures brought north new cases of Lyme disease and other ailments. By 2009, the critters had reached the edge of the Arctic Circle.

In the mountains of the Czech Republic, ticks are now present above 1,100 meters of elevation; prior to the 1980s they apparently hadn't been able to survive much above 700 meters. In the U.S., they have spread north and west from their strongholds in southern New England and Upper Midwest to the far northern reaches of Minnesota and northern New England.

And from there, they've just kept going. In eastern Canada, government researchers have found that ticks are encroaching north at a rate of up to 50 kilometers a year, bringing disease with them.

The relentless northward march is closely linked to mild winters and warming summers that gave ticks more opportunity to find hosts. Understanding ticks' migration and their concurrent climb to ever higher latitudes and altitudes has grown from a passing curiosity to an obsession for Richard Ostfeld, a 65-year-old disease ecologist at the Cary Institute of Ecosystem Studies in Millbrook, New York. He's immersed himself in the study of ticks for almost three decades—and has spent the last decade looking at how climate affects tick survival.

"We should all be very worried," says Ostfeld, about the long-term risks of tick-borne disease. "This is a growing public health threat that we need to get under control because the longer it is allowed to spread unabated, the harder it is to reign back in."

While broad correlation between ticks' spread and global warming is clear, predicting where they will go next as the climate changes is surprisingly daunting, as is proving cause and effect. Little is known about the precise details of what weather conditions kill ticks in the field, and, complicating matters, tick populations bounce up and down naturally for a plethora of reasons, such as the abundance of acorns that their rodent hosts feed on. Predicting where ticks will spread next, "is super important," says Ostfeld, "because where ticks go so too goes tick-borne illness."


In the U.S., those illnesses have more than doubled in recent years, to more than 47,000 cases in 2018 from 22,000 cases in 2004. Lyme Disease accounts for the bulk of this, but numerous lesser-known tick ailments are on the rise as well, including flu-like anaplasmosis and babesiosis, a malaria-like infection of red blood cells. Ticks can also transmit Powassan virus, the rare microbe that killed former North Carolina Senator Kay Hagan last year. The U.S. Centers for Disease Control and Prevention lists 16 bacterial, viral and protozoan diseases that are transmitted by ticks in the U.S. alone, with several more that are mainly present in other parts of the world. And more are being discovered all the time.

In the woods just beyond Ostfeld's office, a team of six researchers is conducting one of the first-ever rigorously controlled field experiments designed specifically to investigate ticks and climate change. They are artificially warming plots of soil and, over the next year, ticks are being placed at various life stages inside fabric bags to see at what temperatures and in which environments they are able to thrive and under which conditions they tend to start dying off. The number of variables is immense—everything from snow-cover, to relative humidity, to the activity of host mammals can affect tick survival.

The complexity of it all keeps Ostfeld up a night. But if this, and other experiments in North Carolina and two other locations in upstate New York succeed, it will provide some of the first reliable data that climate modelers can use to predict where tick-borne diseases are going to pop up in the future.

Ticks' reclusive lifestyle make them hard to study. They eat just three times in their lifespan of two years but spend as much 20% of their lives looking for meals. This process, called questing, involves standing on the edge of a leaf or blade of grass and sticking two hairy legs out ready to grab onto any mammal that happens to brush by. But most of the time, as far as researchers can tell, ticks spend their existence "doing pretty much nothing," says Ostfeld.

Perhaps a tick's most brilliant arsenal is how it renders its victim oblivious to its bite. When a tick sinks its pincerlike jaws and a barbed needle-like appendage called a hypostome into animal flesh, it releases a hospital-style drip of substances, including analgesics to stop the pain, antihistamines and anti-inflammatories to make sure it doesn't itch or swell, and anticoagulants to keep the blood flowing for days. The blacklegged tick, the primary disease-spreading tick species in the Northeast and Midwest, is especially good at undetected gorging.

Not so long ago, Lyme disease was rarely seen in Canada. Now, there are around 2,000 cases a year. Tick populations are "expanding northward all the time" in a pattern consistent with climate change being a driver, says Nicholas Ogden, a research scientist at the Public Health Agency of Canada. Longer warm seasons are giving ticks better chances to find hosts and complete their life cycle, he says "We are going to see more and more of Canada become suitable for ticks," he predicts.

While most research has focused on the blacklegged tick and its European relative, other species of ticks are also roaming into previously colder climes, including the so-called lone star tick, which is linked to red-meat allergy and can spread rare but potentially deadly Heartland virus as well as ehrlichiosis, a flu-like bacterial illness. Long thought of as a southeastern tick, it has made big inroads into Long Island and southern New England in recent years. In July, researchers at the University of Illinois found to their surprise that lone star ticks harboring the Heartland virus had inched north and become established within 60 miles of Chicago, according to research published in Emerging Infectious Diseases.

There's more to the spread of tick habitat and tick diseases than climate, of course. Forest fragmentation, growing deer populations, natural adaptation to colder climates, and ever-expanding suburbs all play a role, making the impact of climate change difficult to parse out. Some researchers argue the role of climate is overstated and that the northern spread is mostly explained by these other factors. "We have no idea what the changes in the weather might do to ticks," says Sam Telford, and epidemiologist and tick researcher at Tufts University. And warming could be neutral or good for some hard-hit regions now, if ticks are driven north out of population centers. "The data isn't really there."

That's where Ostfeld's work comes in. His field experiment on tick survival and climate change, designed with researchers at New York University and Washington State University, doesn't look like much at first glance. It sits in an unassuming patch of leafy woods a few yards behind the parking lot at the Cary Institute of Ecosystem Studies, 80 miles north of New York City. There, two patches of leaf-covered-soil, each roughly one square meter in size, have been divided into 90 squares like a big outdoor checkerboard. Thirty-eight of the squares are covered with tick-containing nylon fabric bags that extend down into soil cores scooped out with a golf hole cutting tool. Other squares contain a variety of temperature, relative humidity and soil moisture sensors that log the precise environmental conditions at all times.

The two patches are exquisitely designed to be essentially identical except for one thing: in one of the patches, the soil is heated with 110 evenly spaced heat probes in buried in the soil and connected to a 24-volt-solar powered battery. That will bring the temperature of the soil up by 2.5 degrees Celsius, about as much as this part of the country is expected to warm in the next 50 years.

"We know almost nothing about whether the ticks get killed outright by cold snaps in winter, hot spells in summer flooding events, or drought," says Ostfeld.

Even though ticks can't be eliminated, knowing where they are likely to spread diseases next could help public health authorities to alert local residents and doctors. Lyme disease is easily treatable with antibiotics if detected early, but if it's missed, the bacterium can spread throughout the body and cause complications ranging from arthritis to neurological complications. And this worst-case scenario is more likely to occur in locales that haven't experienced much Lyme disease or other tick-borne ailments.

"That is one of the consequences of climate change. It spreads in communities that have never experienced it before," Ostfeld says.


Explore further Lone Star ticks in Illinois can carry, transmit Heartland virus

Journal information: Emerging Infectious Diseases

©2020 Bloomberg News
Distributed by Tribune Content Agency, LLC.

Spinach: Chemistry experiments show potential to power fuel cells

by Rebecca Basu, American University


"Eat your spinach," is a common refrain from many people's childhoods. Spinach, the hearty, green vegetable chock full of nutrients, doesn't just provide energy in humans. It also has potential to help power fuel cells, according to a new paper by researchers in AU's Department of Chemistry. Spinach, when converted from its leafy, edible form into carbon nanosheets, acts as a catalyst for an oxygen reduction reaction in fuel cells and metal-air batteries.

An oxygen reduction reaction is one of two reactions in fuel cells and metal-air batteries and is usually the slower one that limits the energy output of these devices. Researchers have long known that certain carbon materials can catalyze the reaction. But those carbon-based catalysts don't always perform as good or better than the traditional platinum-based catalysts. The AU researchers wanted to find an inexpensive and less toxic preparation method for an efficient catalyst by using readily available natural resources. They tackled this challenge by using spinach.

"This work suggests that sustainable catalysts can be made for an oxygen reduction reaction from natural resources," said Prof. Shouzhong Zou, chemistry professor at AU and the paper's lead author. "The method we tested can produce highly active, carbon-based catalysts from spinach, which is a renewable biomass. In fact, we believe it outperforms commercial platinum catalysts in both activity and stability. The catalysts are potentially applicable in hydrogen fuel cells and metal-air batteries." Zou's former post-doctoral students Xiaojun Liu and Wenyue Li and undergraduate student Casey Culhane are the paper's co-authors.

Catalysts accelerate an oxygen reduction reaction to produce sufficient current and create energy. Among the practical applications for the research are fuel cells and metal-air batteries, which power electric vehicles and types of military gear. Researchers are making progress in the lab and in prototypes with catalysts derived from plants or plant products such as cattail grass or rice. Zou's work is the first demonstration using spinach as a material for preparing oxygen reduction reaction-catalysts. Spinach is a good candidate for this work because it survives in low temperatures, is abundant and easy to grow, and is rich in iron and nitrogen that are essential for this type of catalyst.

Zou and his students created and tested the catalysts, which are spinach-derived carbon nanosheets. Carbon nanosheets are like a piece of paper with the thickness on a nanometer scale, a thousand times thinner than a piece of human hair. To create the nanosheets, the researchers put the spinach through a multi-step process that included both low- and high-tech methods, including washing, juicing and freeze-drying the spinach, manually grinding it into a fine powder with a mortar and pestle, and "doping" the resulting carbon nanosheet with extra nitrogen to improve its performance. The measurements showed that the spinach-derived catalysts performed better than platinum-based catalysts that can be expensive and lose their potency over time.

The next step for the researchers is to put the catalysts from the lab simulation into prototype devices, such as hydrogen fuel cells, to see how they perform and to develop catalysts from other plants. Zou would like to also improve sustainability by reducing the energy consumption needed for the process.


Explore furtherNew material to surpass traditional oxygen reduction reaction catalysts
More information: Xiaojun Liu et al, Spinach-Derived Porous Carbon Nanosheets as High-Performance Catalysts for Oxygen Reduction Reaction, ACS Omega (2020). DOI: 10.1021/acsomega.0c02673
Journal information: ACS Omega


Provided by American University


Scientist maps carbon dioxide emissions for entire US to improve environmental policy-making
by Northern Arizona University
Emissions map of entire U.S. landscape at high space- and time-resolution with details on economic sector, fuel and combustion process. Credit: Northern Arizona University

With intense wildfires in the western U.S. and frequent, intense hurricanes in the Gulf of Mexico, the nation is again affected by extreme weather-related events resulting from climate change. In response, cities, states and regions across the country are developing policies to reduce their emissions of greenhouse gases, chiefly carbon dioxide (CO2). Even though many state and local governments are committed to these goals, however, the emissions data they have to work with is often too general and too expensive to provide a useful baseline and target the most effective policy.


Professor Kevin Gurney of Northern Arizona University's School of Informatics, Computing, and Cyber Systems today published results in the Journal of Geophysical Research detailing greenhouse gas emissions across the entire U.S. landscape at high space- and time-resolution with details on economic sector, fuel and combustion process.

Gurney, who specializes in atmospheric science, ecology and public policy, has spent the past several years developing a standardized system, as part of the Vulcan Project, that quantifies and visualizes greenhouse gases emitted across the entire country down to individual power plants, neighborhoods and roadways, identifying problem areas and enabling better decisions about where to cut emissions most effectively. Leading up to the nationwide study, Gurney produced emissions maps of several different large cities, including the Los Angeles megacity, Indianapolis, the Washington, D.C./Baltimore metropolitan area and Salt Lake City.

Funded by NASA, Gurney developed the high-resolution emissions map as an effective tool for scientific and policy applications. His goal is to provide policymakers across the nation with a means to strategically address problem areas instead of taking an inefficient, costly approach.

"We're providing U.S. policymakers at national, state and local scales with a scalpel instead of a hammer. Policies that might be relevant to California are possibly less relevant for Chicago or New York. They need to have information that reflects their unique conditions but follows a rigorous, standardized scientific approach. In this way, they can have confidence in the numbers which, in turn, will stimulate smart investment in reducing emissions."

One of the strengths of Gurney's approach is validation by atmospheric monitoring of CO2 from ground-based and satellite instruments.

"By synthesizing the detail of building and road-scale emissions with the independence and accuracy of atmospheric monitoring," Gurney said, "we have the best possible estimate of emissions with the most policy-relevant detail."

Through characterization of CO2 emissions across the entire US landscape every kilometer, from coast to coast, Gurney points out that the system offers every US city an inventory on emissions. "By extracting all cities in the US from our data product, we can offer every city a consistent and comprehensive assessment of their emissions. Like the US weather forecasting system, this problem is best solved with a single systemic approach and shared with city stakeholders so they can do what they know how to do better than anyone—reduce emissions in ways that meet their individual needs," Gurney said.


Explore further

More information: Kevin R. Gurney et al, The Vulcan Version 3.0 High‐Resolution Fossil Fuel CO2 Emissions for the United States, Journal of Geophysical Research: Atmospheres (2020). DOI: 10.1029/2020JD032974
There's a giant 'Green Banana' off Florida's coast, and researchers have finally gotten to the bottom of it

by Chris Perkins, Sun Sentinel
  
Credit: CC0 Public Domain

If you haven't heard of the "Green Banana blue hole" you might imagine a tropical cocktail you can order in Key West, or a dessert you ordered after a night on Bourbon Street.

Forget that. This Green Banana is actually a mysterious sink hole. More specifically, it's a huge, underwater cavern off the coast of Florida that humans had never fully explored—until last month.

Scientists say the Green Banana could hold clues to the formation of toxic red tides, algae blooms that are devastating to Florida's shoreline, and the extent of the aquifer that supplies the state with most of its drinking water.

Maybe even the origins of life.

Blue holes—sink holes that form under water—are not unusual in the Gulf of Mexico. In the mid-1970s, a boat captain sailing about 60 miles west of Sarasota spotted one about 160 feet under water, and an unripe banana peel floating above it. It became known as the Green Banana.

Scientists believe it may have formed more than 10,000 years ago when a sink hole opened to form a cavern 265 feet deep and 425 feet below the surface of the Gulf, further than typical scuba divers are capable of reaching.

It's not just the depth of the Green Banana that's a challenge for explorers. It's wide base created by an hourglass shape had never been fully explored until advanced diver Marty Watson did it in August with a team of scientists and researchers.

"What's it like?" Watson asked. "I'm not an astronaut, but it's got to be the closest thing in the world next to it."

Blue holes are thought to be ecological hot spots whose nutrients help supply the food chain around the world. It starts with the phytoplankton that feed on those nutrients, which attracts fish that feed on phytoplankton, which attracts bigger fish that feed on those fish, and so on.

Marine life including sharks, sea turtles, corals, sponges and schools of fish have been spotted near blue holes.

Before Watson's dive, no research team had the capability or technology to fully explore the mysterious Green Banana, unlike blue holes in China or Mexico.

But researchers from Florida Atlantic University's Harbor Branch Oceanographic Institute joined a team from Georgia Tech, the Mote Marine Laboratory and Aquarium, the U.S. Geological Society and NOAA's Office of Ocean Exploration and Research to explore the Green Banana.


"It's advantageous to have something like this in our own backyard where you can study all the crazy organisms and potentially learn about life early on earth, or life on other planets," said FAU professor Dr. Jordon Beckler.

The team used technical divers and a benthic lander, a 600-pound submersible that houses multiple scientific instruments, to explore Green Banana's lower ring.

Researchers explored another blue hole near Green Banana, named Amberjack, last year. The sulfide-rich water at the bottom of Amberjack was dominated by archaea microbes, part of the organisms of all life on Earth.

Scientists say it's unusual to have one species dominating an underwater area.

"It suggests to us that there's something very special and unique about this microbe that is letting it really thrive in this low-oxygen, high-sulfide bottom water of Amberjack hole," said Dr. Nastassia Patin, who works for the National Oceanic and Atmospheric Administration and was involved in the Amberjack project when she was on the team at Georgia Tech.

Amberjack was fascinating, to say the least.

"Amberjack is very large system," said Watson, who also dove to the bottom of that 350-foot deep blue hole. "I would say that at the bottom it's as big as a football stadium, or close."

Scientists want to know if there's something special about the sediment at the rim of Green Banana, and one thing they want to know is whether the organisms that feed on the sulfide release nutrients that fertilize red tide or other algae. Analysis of Green Banana's water and sediment samples won't be complete for weeks.

"For me, I'm a geochemist," Beckler said, "and we are trying to understand how water and rocks interact, and how the oceans on earth and the atmosphere all sort of evolved over the last four to six billion years. And when you have these crazy microenvironments like the blue holes, where it's not just fully oxygenated like the rest of the ocean, it also serves as a potential proxy for what the earth looked like back in the day."

Researchers hope to launch a second trip to the bottom of the Green Banana next May.


Explore further
Mysterious 450-foot 'blue hole' off Florida has researchers looking for signs of life

©2020 Sun Sentinel (Fort Lauderdale, Fla.)
Distributed by Tribune Content Agency, LLC.
147 shares

Beirut explosion was one of the largest non-nuclear blasts in history, new analysis shows

by University of Sheffield
Engineers used footage from 16 videos on social media to estimate the yield of the 2020 Beirut explosion. Credit: Shock Waves

The explosion in the Port of Beirut was one of the biggest non-nuclear blasts in history—releasing enough energy in a matter of milliseconds to power more than 100 homes for a year—according to a new assessment of the disaster by engineers from the University of Sheffield.

Researchers behind the study, from the University's Blast and Impact Engineering Research Group, hope that the new assessment can be used to provide policymakers and the public with more accurate information on the blast, as well as to help first responders prepare for future disasters and save lives.

After analyzing videos of the explosion posted on social media, the team of researchers has been able to estimate the power of the blast by tracking how the explosion's shockwave spread through the city.

The new assessment by the Sheffield engineers, which is published in the journal Shock Waves, found that the size of the explosion was the equivalent of between 500-1100 tons of TNT—around 1/20th of the size of the atomic bomb that was used on Hiroshima on 6 August 1945 and is one of the largest non-nuclear explosions ever recorded.

The explosion also released—in a matter of milliseconds—the equivalent of around 1GWh of energy. This is equal to the hourly energy generated by three million solar panels or 400 wind turbines.


The engineers hope that by releasing a more accurate assessment of the blast, including an insight into how the shockwave traveled, it could be used to help with future disaster response planning. The data could be used by first responders to help predict the likely injuries and structural damage at various distances from a blast in future emergency situations.

Dr. Sam Rigby, senior lecturer in blast and impact engineering at the University of Sheffield, said: "The disaster that hit Beirut this summer was devastating and we hope that nothing like that ever happens again. This was an unprecedented event because never before has such a large explosion been so well documented. The reason why we decided to analyze the explosion is because as engineers it's our jobs to use the skills and resources we have at our disposal to solve problems and ultimately to help people. After seeing the events unfold, we wanted to use our expertise in blast engineering to help understand what had happened in Beirut and provide data that could be used to help prepare for, and save lives in such events should they ever happen again. By understanding more about the power of large scale accidental explosions like the one that occurred in Beirut, we can develop more accurate predictions of how different buildings will be affected, and the types of injuries there are likely to be at different distances from the blast."

The new analysis—"Preliminary yield estimation of the 2020 Beirut explosion using video footage from social media"—is published in Shock Waves.


Explore further NASA maps Beirut blast damage


More information: S. E. Rigby et al. Preliminary yield estimation of the 2020 Beirut explosion using video footage from social media, Shock Waves (2020). 
Researchers probe memory of the Venus flytrap

by National Institutes of Natural Sciences
Sensory hairs of the Venus flytrap (Dionaea muscipula). Credit: NIBB

The carnivorous plant Venus flytrap (Dionaea muscipula) captures and digests small animals and absorbs nutrients with its characteristic insectivorous leaves. Six sensory hairs on the inner surface of each leaf sense a visiting prey and cause the trap to close. A single contact event with a sensory hair is not sufficient, but a second contact within 30 seconds will induce the trap to close quickly and ensnare the unlucky prey. Thus, Venus flytraps store the memory of the first stimulus for about 30 seconds. But how does a plant memorize anything when it has no brain or nervous system?


In 1988, Dr. Dieter Hodick and Dr. Andreas Sievers from the Botanical Institute at the University of Bonn, Germany speculated that changes in calcium ions might be involved in the memory of the Venus flytrap. However, lacking the technological means to measure calcium concentrations without damaging the cells, they were unable to explore this possibility.

Now, in a study to be published in Nature Plants, a graduate student Mr. Hiraku Suda and Professor Mitsuyasu Hasebe of the National Institute for Basic Biology (NIBB) in Okazaki, Japan, together with their colleagues, have succeeded in visualizing intracellular calcium concentrations in the Venus flytrap and have demonstrated that its short-term memory can indeed be explained by changes in calcium concentration.

The research team first established a genetic transformation method for the Venus flytrap. They then introduced the gene encoding the intracellular calcium sensor protein GCaMP6, which emits green fluorescence when bound to calcium, into the insectivorous plant, allowing them to visualize changes in intracellular calcium concentrations for the first time.

Play VIDEO 
Visualization of the changes in intracellular calcium concentration of the Venus flytrap, using the fluorescent GCaMP6 calcium sensor, following stimulation with a needle. Credit: NIBB

Mr. Hiraku Suda, the first author of the article says, "I tried so many experiments over two and a half years but all failed. The Venus flytrap was such an attractive system that I did not give up. I finally noticed that foreign DNA integrated with high efficiency into the Venus flytrap grown in the dark. It was a small but indispensable clue."

Using these transgenic Venus flytrap plants, the research team stimulated a single sensory hair with a needle and measured the changes in calcium levels within the leaf in detail.

Whereas the first stimulation increased the intracellular calcium concentration in the leaf blade, the second stimulus further raised the calcium ion concentration. These results revealed that the trap only closes when the intracellular calcium concentration exceeds a certain threshold.
Visualization of the changes in intracellular calcium concentration of the Venus flytrap, using the fluorescent GCaMP6 calcium sensor, following stimulation with a needle. Credit: NIBB

In addition, it became clear that the intracellular calcium concentration decreased with the passage of time after the initial burst brought upon by the first stimulation. If the interval between the first and second stimuli sensed by sensory hairs exceeded about 30 seconds, the trap would not close, as the intracellular calcium concentration did not exceed the signaling threshold, despite the administration of two stimuli. Therefore, the memory of the Venus flytrap can be assigned to changes in intracellular calcium concentrations.

"This is the first step towards revealing the evolution of plant movement and carnivory, as well as the underlying mechanisms. Many plants and animals have interesting but unexplored biological peculiarities. The Center for the Development of New Model Organisms at NIBB is gathering the technical know-how to study such marvelous organisms," said Professor and Vice-Director General Mitsuyasu Hasebe from NIBB, who led the research team.


Explore further
Biomechanical analyses and computer simulations reveal the Venus flytrap snapping mechanisms
More information: Calcium dynamics during trap closure visualized in transgenic Venus flytrap, Nature Plants (2020). DOI: 10.1038/s41477-020-00773-1

Journal information: Nature Plants

Provided by National Institutes of Natural Sciences
Dust dampens albedo effect, spurs snowmelt in the heights of the Himalayas

by Pacific Northwest National Laboratory
Credit: CC0 Public Domain

Dust blowing onto high mountains in the western Himalayas is a bigger factor than previously thought in hastening the melting of snow there, researchers show in a study published Oct. 5 in Nature Climate Change.


That's because dust—lots of it in the Himalayas—absorbs sunlight, heating the snow that surrounds it.

"It turns out that dust blowing hundreds of miles from parts of Africa and Asia and landing at very high elevations has a broad impact on the snow cycle in a region that is home to one of the largest masses of snow and ice on Earth," said Yun Qian, atmospheric scientist at the U.S. Department of Energy's Pacific Northwest National Laboratory.

Qian and Chandan Sarangi, formerly a postdoctoral associate at PNNL and now at the Indian Institute of Technology Madras in India, are corresponding authors of the study.

More than 700 million people in southeast Asia, as well as parts of China and India, depend on melting snow in the Himalayas for much of their freshwater needs in summer and early fall, driving the urgency of scientists ferreting out the factors that influence earlier snowmelt in the region.

In a study funded by NASA, scientists analyzed some of the most detailed satellite images ever taken of the Himalayas to measure aerosols, elevation, and surface characteristics such as the presence of dust or pollution on snow.

Of dust, soot, sun and snow: The albedo effect

Dark objects on or in snow absorb sunlight more effectively than pure white snow, whose reflectivity fends off sunlight so forcefully that snow can be blinding on a bright, sunny day. But snow near an object that absorbs sunlight—like snow on a dark-colored car where some of the roof is exposed—heats up and melts faster than pristine snow.

Scientists use the word "albedo" to discuss how well a surface reflects sunlight. Dirty snow has a low albedo, while pure snow has a high albedo. Dust and soot lower snow's albedo, causing the snow to absorb more light, heating up and melting snow faster.

The albedo effect at high elevations is crucial to life for millions of people who rely on snowmelt for their drinking water. Darker, dirtier snow melts faster than pure snow, changing the timing and amount of snowmelt and affecting agriculture and other aspects of life.

Play
VIDEO
 Dust has a lot of clout in the western Himalayas, absorbing sunlight and melting snow, according to new findings published in Nature Climate Change. The process plays an important role in the timing of snowmelt in the region, where more than 700 million people depend on melting snow in the Himalayas for much of their freshwater needs in summer and early fall. Credit: Graham Bourque | PNNL

The powerful effect of dirty snow


The team found that dust plays a much larger role melting snow than soot and other forms of pollution, known as black carbon, at elevations above 4,500 meters. Below that, black carbon dominates.

It's a surprise for scientists, who note that far more studies have explored the role of black carbon than dust in snowmelt.

The dust blows into the western Himalayas from the west—from the Thar Desert in northwestern India, from Saudi Arabia and even from the Sahara in Africa. The dust comes in winds thousands of feet high, at what scientists call elevated aerosol layers.

While desert dust is natural, the scientists say that its prevalence in the Himalayas is not without human influence. Increasing temperatures have changed atmospheric circulation, affecting the winds that can carry dust hundreds or thousands of miles. Changing land-use patterns and increasing development have reduced vegetation, liberating dust that otherwise would have been tied to the land.

Qian was one of the first scientists to develop sophisticated modeling tools to analyze how impurities like dust and soot affect the rate at which snow melts. He did that early work more than a decade ago in the mountains of the U.S. West.

"It's likely that these results translate to other high mountain chains, including the Rockies, Sierras and Cascades in North America and several mountain chains in Asia, such as the Caucuses and Urals," Qian said.

Much of the data for the study comes from satellite images obtained by multiple NASA instruments, including NASA's Cloud-Aerosol Lidar and Infrared Pathfinder Satellite Observations (CALIPSO), OMI (Ozone Monitoring Instrument), and MODIS (Moderate Resolution Imaging Spectroradiometer). These instruments can detect dust and other aerosols in the atmosphere, and measure snow coverage and albedo, from hundreds of miles above Earth. Equipped with data from these and other sources, the PNNL team did extensive computer modeling of the processes at work.

Dust with staying power

Dust particles usually stay in snow longer than black carbon, the scientists noted. Dust is usually a little bit bigger; it's not as easily blown off the snow and it doesn't fall through snow as easily. There's also a lot more of it.

"The snow in the western Himalayas is receding rapidly. We need to understand why this is happening, and we need to understand the implications," said Sarangi. "We've shown that dust can be a big contributor to the accelerated snowmelt. Hundreds of millions of people in the region rely on snow for their drinking water—we need to consider factors like dust seriously to understand what's happening."

Qian notes that as the climate warms and snow lines move higher, scientists expect the role of dust to become even more pronounced in the Himalayas—a region that, aside from the Arctic and Antarctic regions, contains the biggest mass of snow and ice on the planet.

Explore further Snow in the Andes as clean as Canadian Arctic: study

More information: Dust dominates high-altitude snow darkening and melt over high-mountain Asia, Nature Climate Change (2020). 
Study shows that African herbivores that eat mixed diets or migrate have more stable populations

  
A herd of impala, Kruger National Park, South Africa. Credit: Carla Staver

A pair of researchers, one with Yale University, the other the University of the Witwatersrand, reports that African herbivores that eat mixed diets or migrate have more stable populations than do those who eat just one food and do not migrate. In their paper published in the journal Science Advances, A. Carla Staver and Gareth Hempson describe two theories to predict population stability for African herbivores, how they tested their theories, and what they found.

As the researchers note, African savannas host the world's largest megafaunal communities, but as they also note, populations of most of the endemic species are in decline due to a host of factors including diseases, drought and human encroachment. And while these factors have been extensively studied, one that has not is animals' diets. In the savannah, there is more to eat than just grass: there are also small trees and shrubs, and some animals diversify their diet by eating from more than one source. In this new effort, Staver and Hempson theorized that those animals with more diverse diets likely had more stable populations than those that did not. They also suspected that another factor might be in play: whether animals moved to new locations to find food, a form of migration.

To test their theories, the researchers obtained and analyzed herbivore population data from 18 preserves across the African continent. They compared those animals that fed on just one type of plant to those with a more varied diet. They found that animals that fed on both grasses and shrubs, such as the impala, maintained population levels better than animals such as buffalos, which fed only on grass. They also found that animals such as the wildebeest that travel to find new food sources also maintained their populations better than did those that did not migrate and fed on a single food source. The researchers also found that body size did not appear to play a role in helping to preserve population levels. They suggest that diet be included as a population stability factor by animal management teams.

This is a talk Carla Staver gave at the annual meeting of the Ecological Society of America in August about this work. Credit: Carla Staver as presenter (with Gareth Hempson as a co-author on the talk)


Explore further

More information: A. Carla Staver et al. Seasonal dietary changes increase the abundances of savanna herbivore species, Science Advances (2020).

Journal information: Science Advances

© 2020 Science X Network