Tuesday, July 13, 2021

Carbon Positive or Carbon Negative? 
Net-Zero or Carbon Neutral? 
I'm Confused.
It's time to have a big virtual convention and agree on some basic terms.

By Lloyd Alter
Published July 9, 2021 
TREEHUGGER
Fact checked by
Haley Mast


Fine Art Images/Heritage Images/Getty Images

Treehugger Voices

I have never understood exactly what net-zero means. I don't even know how to type it: does it have a hyphen or not? I have mentioned this before, usually attracting comments like this: "What a bunch of nonsense. By definition 'net' means the positive and the negative together when added up becomes zero. This is unsubstantiated drivel." Our fact-checking and definitions team has their take:


What is Net-Zero

Net-zero is a scenario in which human-caused greenhouse gas emissions are reduced as much as possible, with those that remain being balanced out by the removal of greenhouse gas emissions from the atmosphere.

So some people are pretty sure they know what it means, yet reading the recent report—"Net-zero buildings: Where do we stand?"—published by the World Business Council for Sustainable Development (WBCSD), it was clear that they weren't quite sure either.

WCABC

In fact, it is one of the key actions for decarbonization: to "define net-zero buildings." They worry about the lack of information and definitions for all the terms we are throwing around.

"There is a lack of global consensus on methodological assumptions and definitions of net-zero proportionate to required GHG emissions reductions, removals, offsetting, and established explicit targets to support this. These barriers need to be addressed rapidly at scale if we are to have the impact we need."


My colleague Sami Grover is confused as well, writing "Multinational Insurer Aims for Net-Zero, But What Does Net-Zero Really Mean?," noting that "net zero is becoming increasingly hard to pin down."

Grover writes:

"Ultimately, those of us who care about climate are going to have to do much better than net-zero. And we’ll have to keep an eye on whether the term itself is helping us, or hindering us, in that pursuit."

We need a convention.

Sanford Fleming demonstrating time zones. Canada Archives

I am not going to try and come up with a definition, if the WBCSD and Grover can't, then whatever I write will be, as my commenter noted, a bunch of drivel. Instead, in the manner of the Convention du Mètre of 1875 where 17 nations agreed to standardize and use the metric system, or the General Time Convention of 1883 in Chicago, which determined that "the sun will be requested to rise and set by railroad time," I am calling for a grand, memorable meeting.1


Put everyone together in one room or on one big Zoom call and figure this one out. And while they are at it, there is a long list of terms that should be clarified and resolved. I have used Google N-gram to try and see which is most popular; it is hard because the Y-axis changes all the time and there are so many zeros, but you can see what's trending and what's not.

Carbon Negative
Google N-gram

Usually defined as going beyond net-zero. In a building, it would mean removing more carbon dioxide from the air than were generated in upfront carbon emissions and operating emissions. Don't ask me why it isn't hyphenated.


When passive house designer Andrew Michler showed me his new project that was built of wood and straw and covered with solar panels, I suggested that it might well be carbon negative. He admonished me: "No it isn't, there isn't a carbon negative building in the world today, you will never know until it has finished its useful life and you know where the wood went, was it reused or burned or landfilled? Solar panels only last 25 years, and have a huge amount of embodied carbon. We will all be dead before we know if it is carbon negative."

Carbon Positive
Google Ngram

This is a term I first heard when writing about an Australian project; it means the same thing as carbon negative, but is, well, not so negative, positive sounds so much better. It appears that Ed Mazria of Architecture 2030 has picked it up, writing a recent article titled "CarbonPositive: Accelerating the 2030 Challenge to 2021." I like positivity better than negativity; if I am at the convention I will vote for this.

Carbon Neutral
Google Ngram

I don't know where this came from, but it smells like net-zero to me. The diplomats at the European Parliament, who probably like neutrality better than zero, try to define it:


"Carbon neutrality means having a balance between emitting carbon and absorbing carbon from the atmosphere in carbon sinks. Removing carbon oxide from the atmosphere and then storing it is known as carbon sequestration. In order to achieve net zero emissions, all worldwide greenhouse gas (GHG) emissions will have to be counterbalanced by carbon sequestration."


Yup, it's net-zero—without the hyphen. And it's not going anywhere.

Climate Positive

This sounds like advertising jargon to me. In fact, Fast Company attributes it to a Swedish burger chain in "If you’re going to eat meat, try this “climate positive” burger." They define it as "an activity goes beyond achieving net zero carbon emissions to actually create an environmental benefit by removing additional carbon dioxide from the atmosphere." I think we can ignore it.

Embodied Carbon


This is a particular bête noir of mine, I think it is a terrible name, It's not embodied, it's in the air already, As Elrond Burrell notes, it is burped, vomited, spiked, it's gone. That's why I wrote "Let's Rename 'Embodied Carbon' to 'Upfront Carbon Emissions'" in 2019.

WBCSD

That discussion with Burrell was fruitful, and I believe the start of a larger discussion: Upfront carbon is now an accepted term for those emissions in green, making the products and constructing the building. The World Green Building Council uses it this way as well. I do not know if it is universal, but it should be.

Let's get together and figure this out.
Passivhaus Conference in Vienna. Passive House Institute

Conferences are fun; I am in that crowd cycling around Vienna after a Passivhaus conference a few years ago. Flying is a problem, and so is Covid-19 right now, so perhaps it has to be virtual or powered by all that green hydrogen everyone is talking about.


But we need to come to some common definitions of all these terms, starting with net-zero.
Miracles and mirages: The double-faced perspectives of just energy transition in India
SARTHAK SHUKLA

Getty

GREEN ENERGY
JUST TRANSITION
NET ZERO

Recently, the Indian oil refining giant of Reliance Industries announced its mega plan to invest US $10.1 billion in green energy over the next three years to achieve the net-zero target of carbon-neutrality.

This has further pushed forward the debate around efforts to address climate change by transforming our energy systems from being fossil-dependent to ones based on renewable sources of energy. However, there are certain undercurrents and latent developments which hinder the prospects of a clean energy transition. A pattern which is emerging and is widely claimed to be a welcome step, is announcements of going green by prominent state-owned players of the fossil fuel regime.

These include the National Thermal Power Corporation, the Government of India’s thermal power company, which announced a renewed target of installing 60 gigawatts (GW) renewable energy by 2032, up by almost 50 percent from the previous 32 GW target set in October 2020. The second company is the state-owned coal mining company, the Coal India Limited, which announced two wholly owned subsidiaries recently to venture into renewable energy projects. This comes after its earlier announcement to invest INR 56.50 billion by March 2024 to develop solar power for powering its own mining operations.

Apart from these recent announcements, various corporates, financial institutions, asset managers, state governments, and philanthropic organisations have committed to reduce their carbon footprint by pulling out money from “dirty coal” into “clean and green energy”.

What remains a rather risky proposition is expecting complete transparency in the flow of money and credibility of the means of achieving the ambitious net-zero targets by different entities. This forms the first layer of uncertainty in the way energy transition is being powered through financial divestments and net-zero targets.


What remains a rather risky proposition is expecting complete transparency in the flow of money and credibility of the means of achieving the ambitious net-zero targets by different entities. This forms the first layer of uncertainty in the way energy transition is being powered through financial divestments and net-zero targets.

The next layer of uncertainty comes from the way the government is preaching and practicing contrasting developments with respect to energy transition. The high priests of policymaking in India are vociferously advocating and popularising the clean energy targets of 450 GW by 2030, which has attracted global eyeballs and praise. However, at the same time, though in silent ways, there have been developments that further the fossil fuel sector too.

Take the coal sector for example. The trends suggest that coal production in India has been continuously rising in this decade, crossing the figure of 730 million metric tonnes (MT) in 2019–20. However, even the rising production is unable to meet the rising coal demand, and therefore, India’s import dependence has also been rising. The government’s plan is to phase out coal imports by the year 2025, which implies that if demand is not starkly reduced, increased coal production is the only way. This, in addition to the recent commercialisation of coal mines, is a signal to domestic investors to invest more in coal production.

In the oil sector, there is a similar scenario. While India has one of the world’s largest oil refining capacity, it still is the world’s second largest oil importer with over 80 percent dependence on imported crude oil to meet domestic needs. In this backdrop, the government again has planned to reduce the import dependence by 10 percent in 2022. This again gives a positive signal for oil exploration domestically and attracting investments for the same. A major policy push for this was the Hydrocarbon Exploration Licensing Policy of 2016 which provided for uniform licensing, coupled with open acreage policy.

This is the state of affairs in the natural gas sector as well, where the share of natural gas in meeting India’s primary energy needs has been fixed at around 6 percent over the past few years. The Government of India plans to increase this to 10 percent by 2025.

In all these sectors of coal, oil, and natural gas, the State seems to be steering clear of any conclusive decision about the future trends of these sectors. On the one hand, we are celebrating the remarkable announcements, which as India’s Power Minister, Raj Kumar Singh himself said are mere clouds in the sky, while also striving for enhanced domestic exploration of fossil fuels and inflow of investments in the fossil sector.

This is also explained in the remarks of the International Energy Agency in its annual publication, India Energy Outlook 2021. It says that “India is characterised by the co-existence of shortage and abundance in several parts of its energy system. India possesses the world’s fifth largest reserves of coal, nonetheless, it is one of the major coal importers. India is a major centre for global oil refining, but relies overwhelmingly on imported crude.”

It goes on to mention how the choice of per capita or absolute values make a big difference by citing example of carbon emissions, which are third highest in the world in terms of absolute values but barely are in the top 100 when it comes to per capita emission.

Therefore, as long as the transition remains about numbers and statistics, it will be continued to be projected as a glamorous pursuit. It is only when one starts looking inside the numbers to indicators like the policy vision, latent motives and undercurrents, that one explores the shallowness of the glamour of energy transition.


As long as the transition remains about numbers and statistics, it will be continued to be projected as a glamorous pursuit. It is only when one starts looking inside the numbers to indicators like the policy vision, latent motives and undercurrents, that one explores the shallowness of the glamour of energy transition

Finally, the anomaly of our climate discourse being described as the one which places “climate justice” at the heart of it, there have been no concerted developments which exemplifies these announcements and translates them to ground-level changes. The coal sector, reportedly employing 12 million workers, is painted as a ‘dirty’ sector when it comes to climate conferences, yet no concrete steps have been taken either in policies or practices that establish that the State is concerned about climate justice and will adopt principles like just transition going forward.

Hence, while developments like investments in renewable energy, net-zero target announcements, and emission-reduction trajectory are important, there is a need to question these developments from the point of view of their credibility and their intent towards the welfare of people and planet.

WITHIN A DECADE
Renewables were the world’s cheapest source of energy in 2020, report shows

Retiring costly coal plants could stop the emission of about 3 gigatonnes of CO2 a year.


VICTORIA MASTERSON 11 July, 2021 
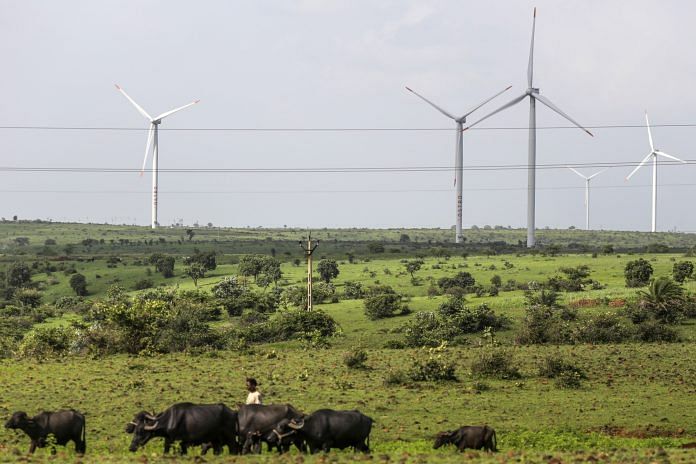
Wind turbines operating beyond electricity cables in Lahori, Madhya Pradesh, India |Photographer: Dhiraj Singh/Bloomberg

Renewables are now significantly undercutting fossil fuels as the world’s cheapest source of power, according to a new report.

Of the wind, solar and other renewables that came on stream in 2020, nearly two-thirds – 62% – were cheaper than the cheapest new fossil fuel, according to the International Renewable Energy Agency (IRENA).

This is double the equivalent share for 2019.

Cheap renewables are good news


IRENA’s report, Renewable Power Generation Costs in 2020, finds that costs for renewable technologies are continuing to fall “significantly” year-on-year.

“Today, renewables are the cheapest source of power,” said IRENA’s Director-General Francesco La Camera.

Cheaper renewables give developed and developing countries a compelling reason to phase out coal while meeting growing energy demands, saving costs and adding jobs, IRENA said.

Retiring costly coal plants would also stop the emission of about three gigatonnes of CO2 a year – 20% of the reduction in emissions needed by 2030 to avert climate catastrophe.

Emerging economies will save up to $156 billion over the lifespan of the renewable projects added in 2020 alone, the agency added.

Falling cost of renewables

The report found a 16% fall in the cost of concentrating solar-thermal power technology – systems that use mirrors to reflect and concentrate sunlight onto a receiver.

The cost of onshore wind projects fell by 13%, and offshore wind projects by 9%.

Solar photovoltaics (PV) – the conversion of light into electricity using semiconducting materials – saw project costs fall by 7%. IRENA reported that the cost of electricity from utility-scale solar PV plunged 85% in the decade to 2020.

IRENA’s report also covers hydropower, geothermal, bioenergy and renewable heat.

“Today, #renewables are the cheapest source of power,” says IRENA DG @flacamera.

Explore the key highlights of our NEW report, Renewable Power Generation Costs in 2020 & learn how renewables provide an economically attractive phase-out agenda for gov’ts: https://t.co/MqvulBdhd6
— IRENA (@IRENA) June 28, 2021


Financing the transition to renewable energy


The report follows the International Energy Agency’s (IEA) conclusion in its World Energy Outlook 2020 that solar power is now the cheapest electricity in history. The technology is cheaper than coal and gas in most major countries, the outlook found.


Another IEA study, Net Zero by 2050, reports that carbon neutrality is possible by 2050 – but only with big changes. This includes huge cuts in the use of coal, oil and gas – and substantial investment in renewables.


The World Economic Forum collaborated with the IEA and the World Bank to produce Financing Clean Energy Transitions in Emerging and Developing Economies, a special report on renewables investment.

This predicts that emerging and developing economies will need to increase their annual clean energy investment by more than seven times – from less than $150 billion in 2020 to over $1 trillion by 2030 – to put the world on track to reach net-zero emissions by 2050.

Victoria Masterson is Senior Writer, Formative Content.

This article was originally published at the World Economic Forum.
Biggest Philippine Power Generator Will Drop New Coal Projects

By Matilda Colman -July 10, 2021

(Bloomberg) — San Miguel Corp., the Philippines’ largest power generator, will drop new coal projects from its expansion plans as it prepares for a transition to a low-carbon future.

“This has not been easy as our country still depends much on reliable and affordable traditional power sources,” the company’s President Ramon Ang said in a Facebook post on Saturday. Still, the nation’s biggest company is “confident” it can effect a transition through collaboration and new technologies, he said.

In April, San Miguel said it is spending more than $1 billion to simultaneously build 31 battery energy storage facilities with a total capacity of more than 1,000 megawatts. Through unit SMC Global Power Holdings Corp., it produces about a fifth of the Philippines’ power supply.

The Department of Energy in late 2020 declared a moratorium on endorsing new coal-fired power plants as the nation seeks to shift to a more flexible power supply. The Philippines is trying to reduce greenhouse gas emissions by 75% by 2030.

©2021 Bloomberg L.P.


B.C.’s clean energy hydrogen strategy aims to decarbonize heavy-duty transportation

July 6, 2021 UPDATED


Hydrogen was attempted more than ten years ago with a proposed hydrogen highway.


VANCOUVER — British Columbia is Canada’s first province to introduce a business and environmental strategy on how renewable and low-carbon hydrogen can reduce emissions and create jobs in the clean technology sector.

Bruce Ralston, minister of energy, mines and low carbon innovation, says the strategy uses actions involving government, industry and innovators to help achieve net-zero carbon emissions by 2050.

He says the short-term goals include establishing regional hydrogen hubs to supply fuel to industries and consumers, while increasing the numbers of medium and heavy-duty vehicles powered by hydrogen on highways and at industrial sites.

Ralston says hydrogen produces no carbon emissions when burned or used in a fuel cell and is considered a climate-friendly solution to industrial activities where the use of electricity is not practical.

Hydrogen can be produced from many sources, including both fossil fuels and renewable resources, although the B.C. plan would support the so-called green pathway, using hydro electricity to create the fuel.


Ralston acknowledges B.C.’s previous attempt to embrace the technology more than a decade ago that included development of a hydrogen highway from B.C. to California, were ahead of their time and are now better positioned to succeed.

Ralston says B.C. is a global leader in the area, with more than 50 per cent of Canada’s hydrogen and fuel-cell companies located in the province and where about 60 per cent of research investment is conducted.

The ministry estimates hydrogen has the potential to reduce B.C.’s emissions by 7.2 million tonnes of carbon dioxide each year by 2050.

“The B.C. hydrogen strategy outlines 63 actions for government, industry and innovators to take aim at accelerating the production, use and export of renewable and low carbon hydrogen,” Ralston told a news conference, adding transitioning heavy-duty vehicles to hydrogen power as “the next frontier.”

This report by The Canadian Press was first published July 6, 2021.

NOT ELON MUSK

Boring to study slow earthquakes

Data from boreholes in plate boundaries could explain slow earthquakes

UNIVERSITY OF TOKYO

Research News

IMAGE

IMAGE: THE TEAM PREPARE THE DEEP-SEA DRILL FOR USE ON THE SEAFLOOR. view more 

CREDIT: © 2021 JAMSTEC-IODP

Slow earthquakes are long-period earthquakes that are not so dangerous alone, but are able to trigger more destructive earthquakes. Their origins lie in tectonic plate boundaries where one plate subsides below another. Though the causal mechanism is already known, there has been a lack of data to accurately model the life cycle of slow earthquakes. For the first time, researchers use deep-sea boreholes to gauge pressures far below the seafloor. They hope data from this and future observations can aid the understanding of earthquake evolution.

The surface of the Earth lies upon gargantuan tectonic plates. The edges of these interact in different ways depending on the plates' relative movement, composition and density. Where plates collide and one sinks below another is known as a subduction zone, often the site of what are known as slow earthquakes. These are low-frequency earthquakes which release their energy over longer periods -- hours to months -- than the earthquakes we might feel shaking the ground beneath us, which can last seconds to minutes.

It is important to understand slow earthquakes as, although not especially dangerous by themselves, they can cause larger short-period earthquakes, which can be extremely dangerous. Researchers believe that the variation of pressure between water-permeable regions at a subduction zone is the cause of slow earthquakes. They expected that excessive pressures beyond those the types of rock at those boundaries can withstand, might be responsible. At last, hard data on these high-pressure conditions has been collected on a recent Integrated Ocean Drilling Program (IODP) expedition, which included researchers from the University of Tokyo's Earthquake Research Institute.

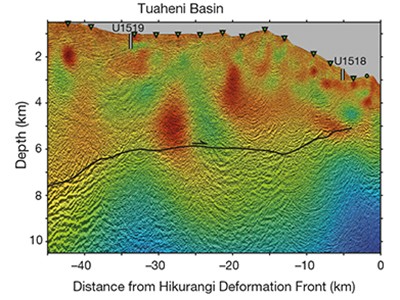
"We believe the subduction fault zone is much weaker than the surrounding rock, and that this can lead to the fault zones slipping, which could trigger earthquakes," said Professor Masa Kinoshita of the Earthquake Research Institute. "High fluid pressure within the water-permeable rocky faults, called ocean aquifers, is one cause for this weakness. Our expedition to the Nankai Trough, a few hundred kilometers south of Osaka, included boring down to measure temperatures and pressures along the fault line."

Typical, or "hydrostatic," pressures below the seafloor in this region are around 60 megapascals -- that's approximately the pressure you'd feel if you lay down flat and someone dropped 200 Empire State Buildings on you. The researchers' borehole samples revealed pressures around 5 megapascals to 10 megapascals greater than this in the vicinity of the fault zone itself. The chosen area was ideal for making these kinds of observations. The team had prior knowledge that there were high-temperature gradients which would likely correlate with the variations in pressure they hoped to discover. The team also included microbiologists who aimed to uncover unseen microbial life in these previously unexplored regions.

"Although we acquired some very useful data, and the first of its kind, the pressure readings had to be inferred, and in future we wish to have in situ observation stations in place which can relay pressure and temperature data without the need for a ship," said Kinoshita. "We now propose another expedition, this time just west of Japan where there are frequent slow earthquakes. I have studied subsea heat flow since my graduate days. It's exciting to see in reality what was only theoretical until very recently."

###

Journal article

T. Hirose, Y. Hamada, W. Tanikawa, N. Kamiya, Y. Yamamoto, T. Tsuji, M. Kinoshita, V. B. Heuer, F. Inagaki, Y. Morono, and Y. Kubo, "High Fluid-Pressure Patches beneath the Décollement: A Potential Source of Slow Earthquakes in the Nankai Trough off Cape Muroto" Journal of Geophysical Research

Funding

This work was partly supported by the Japan Society for the Promotion of Science KAKENHI Grant Numbers JP19H02006, JP19K21907, 17H06455, and JP16H06476, by the Scientific Research on Innovative Areas "Science of Slow Earthquakes", and by the Deutsche Forschungsgemeinschaft (DFG, German Research Foundation) under Germany's Excellence Strategy - EXC-2077 -390741603.

Earthquake Research Institute - https://www.eri.u-tokyo.ac.jp/en/

About the University of Tokyo

The University of Tokyo is Japan's leading university and one of the world's top research universities. The vast research output of some 6,000 researchers is published in the world's top journals across the arts and sciences. Our vibrant student body of around 15,000 undergraduate and 15,000 graduate students includes over 4,000 international students. Find out more at http://www.u-tokyo.ac.jp/en/ or follow us on Twitter at @UTokyo_News_en.


How to increase the take-up of earthquake insurance


  by Jason Contant


When broader government assistance is available for earthquake insurance, the take-up rates for private earthquake insurance appear to be suppressed, according to a new study on the difference between earthquake insurance rates in B.C.’s Lower Mainland and neighbouring Washington State in the United States.

In addition, citizens who do not trust government authorities to safeguard them may tend to underestimate the risk of damage after a quake, thus leaving them less inclined to purchase earthquake coverage.


Is the answer to mandate earthquake insurance coverage?

Possible reasons for low take-up rates of earthquake insurance are explored in a recent paper authored by Glenn McGillivray, managing director of the Institute for Catastrophic Loss Reduction, and Mary Kelly, a professor of finance and chair of insurance at Wilfrid Laurier University. Their paper, The Earthquake Insurance Protection Gap: A Tale of Two Countries, is published in the Journal of Insurance Regulation. They wrote the paper along with Steve Bowen, head of catastrophic insight at Aon.

The paper starts with the observation that take-up rates for earthquake insurance are significantly higher in the Lower Mainland of British Columbia than in neighbouring Washington, State, even though exposure to earthquake risk in the two areas is largely the same.

More than 60% of homeowners in B.C.’s Lower Mainland purchase earthquake insurance protection for their homes and belongings, but fewer than 14% in Washington State do the same.

iStock.com/SUNG YOON JO

The key question is why?

The answer may provide a clue for how to improve the take-up rates of earthquake insurance.

One major difference between the two locales is the broader availability of government disaster assistance in Washington compared to B.C., the paper states. “While there are numerous aid and grant programs to help uninsured or under-insured people in the U.S., the B.C. government has publicly stated that it will not pay assistance for earthquake damage because of the availability of private insurance,” the authors write. “We believe this and issues centring around national culture are the two main reasons why earthquake insurance take-up rates are so low in Washington.”

Elaborating on the cultural aspect, McGillivray and Kelly write: “Because Americans tend to be individualistic and less likely to trust information provided by authorities, they are more likely to underestimate the potential risk. This has resulted in not only low take-up rates for earthquake insurance in western Washington, but also in California, where roughly only 10% of households have proper coverage.”

What can be done to increase take-up rates and lower the protection gap for quake insurance?

The article suggests a number of potential solutions, including mortgage lenders requiring (or governments mandating) the purchase of insurance.

Changes in product design could also motivate more homeowners to purchase earthquake insurance. This might include bundling all potential disasters into a basic policy, or changing the typical one-year policy duration into a multiple-year term. Another possibility is to provide “insurance vouchers” to high-risk, low-income households.

Multi-year policies would benefit both the insured (who would have protection for the life of the policy) and the insurer (which would have both risk and premium set for a few years), McGillivray told Canadian Underwriter Wednesday. “It is felt that this would lower costs for the insurer, who could offer a lower premium. It would also allow the consumer to benefit from stability with regard to their cost of insurance.”

Kelly added that a multi-year policy also encourages investments in mitigation. “When a consumer can see the five-year impact of the reduction in premium if they undertake mitigation, then they are more likely to do so.”

Insurance vouchers are designed to help low-income households deal with the high cost of risk-based premiums for perils such as flood and earthquake. They are tied to income levels, whereas subsidized rates are typically tied to risk levels, Kelly said Wednesday. “One of the ideas here is to assist people in paying the premium and not reducing the premium so that it is no longer risk-based,” McGillivray said.

iStock.com/studiocasper

“When I think about it,” Kelly said, “I think about how subsidized daycare works in Ontario, and a similar model would work (I think) for vouchers.”

Government-run insurers like the U.S. National Flood Insurance Program have gotten themselves in trouble in the past by not charging property pricing for risk, McGillivray observed. In contrast, insurers would (and could) not reduce premiums, or else they would get into solvency issues. “The answer could be vouchers,” McGillivray said.

He noted that vouchers could result in both a reduced reliance on disaster assistance and a quicker recovery after a loss event.

If U.S. state governments required earthquake insurance, would Washington see take-up rates near that of B.C.?

If quake insurance were mandatory, take-up rates would likely exceed those of B.C., McGillivray said.

In this scenario, however, the potential exists of an unscrupulous homeowner purchasing the insurance, providing proof to authorities, and then cancelling the policy.

“Barring this, requiring earthquake cover could work, though we feel it would be politically unpalatable to many,” McGillivray said.

Authorities would have to ensure enough companies offer the coverage. Options might include a negative option, meaning that a homeowner automatically gets earthquake coverage unless they opt out.

It’s also worth noting that when U.S. government mortgage loan corporations tried to make quake coverage required for mortgages in California, the state blocked it, Kelly added. Legislation states that the California Earthquake Authority will cease writing new quake insurance policies if either government association (Freddie Mac and Fannie Mae) requires this type of insurance. “So, I can’t see it ever being passed,” Kelly said.

McGillivray agrees the issue is a double-edged sword. If quake insurance were to be mandated in B.C., the protection gap would be reduced (though not eliminated because quake insurance still have large deductibles; plus, not all properties would have enough damage to trigger the policy). On the other hand, there would be higher earthquake exposure for insurers, who would have to manage their accumulations and purchase adequate Cat reinsurance.

“This would all have to be carefully managed, as the industry has only so much capital to pay for a major West Coast earthquake,” McGillivray said.

Kelly noted that a typical deductible is 10% of the property value. “In theory, insurers should have sufficient reinsurance, but I too would anticipate that some of the smaller players might significantly limit their exposure in response.”

 February 18, 2021 

Feature image via iStock.com/metamorworks

Giant diamonds may hold the key to superdeep earthquakes

Imperfections such as the inclusions (dark flecks) in this diamond reveal that tectonic slabs can carry water deep into Earth’s mantle. EVAN SMITH/© 2021 GIA
Jun. 1, 2021 , 4:45 PM

Earthquakes shouldn’t occur more than 300 kilometers below Earth’s surface, according to most geophysical models. Yet they commonly do—a phenomenon that has mystified seismologists for decades. Now, researchers suggest water carried by tectonic plates shoved beneath continents could be triggering these deep temblors. The find may also explain another marvel: why a huge number of fist-size diamonds form at this depth.

Earthquakes typically occur when the two sides of a fault, or the opposite sides of a tectonic plate boundary, scrape past each other. But far beneath our planet’s surface, the pressures are too high for such slippage, and rocks are typically so hot they ooze and flow rather than break. That has led geophysicists to come up with alternate explanations for deep seismic activity, which can be very strong but largely too far away for us to feel.

One idea is that some minerals, under the extreme heat and pressure deep within our planet, can suddenly lose volume, with the runaway collapse over large distances causing strong quakes. A second notion is that once a quake gets going—because of the sudden collapse of minerals or another cause—rocks near the tip of the rupture heat up even further and weaken, fueling the quake. A third cause might be water released from rocks deep below Earth’s surface, which could weaken other rocks nearby, allowing them to fracture more easily. Researchers have largely dismissed that explanation, however, because it wasn’t clear where such water would come from.

Steven Shirey, a geochemist at the Carnegie Institution for Science, had a hunch: diamonds. The precious gems can accumulate layers as they grow, gathering imperfections—such as flecks of surrounding rocks—as they get bigger. Those so-called inclusions can also contain pockets of mineral-rich water.

To see whether the idea could work, Shirey and his team took a closer look at how water might make its way down deep. The answer, they believe, is that it rides down within tectonic slabs as they get shoved beneath continents. There are three sources of water, they postulate. One was the water was locked in the minerals that formed as molten rock hardened at midocean ridges. Another was the wet sediments that accumulated on those slabs as they moved across the ocean floor. And the third was ocean water that infiltrated the slabs as they bent and fractured.

Then, the scientists used computer simulations—and the results of previous lab studies by their team and others—to study how minerals in those slabs would behave as they moved deeper and deeper. In general, as depth within Earth increases, so do temperature and pressure. Although slabs can start out relatively cool at Earth’s surface, they warm up as they sink. And because they’re many kilometers thick, it often takes millions of years for the slabs to heat throughout.

Regardless of depth, Shirey and his team found that once rocks in the slabs reached temperatures above 580°C, they were less able to hold water. As that water flooded out of the slab, it weakened the surrounding rocks and triggered quakes, Shirey and his colleagues report in AGU Advances. This water, typically chock-full of dissolved minerals, would also be available to fuel diamond formation.

“The temperature tells the story,” says Douglas Wiens, a seismologist at Washington University in St. Louis who was not involved in the new study. If the tectonic slab starts out hot, as it would if the rocks are relatively young, he says, the plate will dehydrate at depths between 100 and 250 kilometers and thus won’t carry water far enough down to generate deep quakes. But if rocks in the sinking slab are old and relatively cool, water will stay locked inside the sinking slab for a longer time, persisting there until it is released at depths of 300 to 500 kilometers or more.

Further work in both the lab and the field will be needed to fully understand the relationships between water released from sinking slabs and deep earthquakes, Wiens says. In the meantime, he says, it’s clear that diamonds that form at those depths, imperfections and all, will be critical to teasing out the details of the story.

Fluid-rich extinct volcanoes cause small earthquakes beneath New Zealand

Imaging of a region where an oceanic tectonic plate descends below another plate reveals evidence that fluid-rich extinct volcanoes can help to lubricate the interface between plates — reducing the potential for large earthquakes.


Catherine A. Rychert &
Nicholas Harmon

At subduction zones, the force of gravity drags dense tectonic plates beneath other, more buoyant plates. As the plates slide past one another, stress builds and is eventually released in the largest and most destructive types of earthquake on Earth. Various factors are thought to have a role in determining the location, type and magnitude of these earthquakes. Working out when and where each of these factors is at play is central to understanding earthquake processes and mitigating the associated hazards. The characteristics of the down-going plate are thought to be a crucial contributor.


Read the paper: Fluid-rich subducting topography generates anomalous forearc porosity


However, finding direct links between the features of a down-going plate and the associated earthquake characteristics has proved challenging. Chesley et al.1 report in Nature their use of a technique called electromagnetic imaging to investigate extinct underwater volcanoes, known as seamounts, on the Pacific plate as it descends beneath New Zealand. The authors show that the seamounts bring fluid into Earth’s interior that is later released into the overlying plate, effectively lubricating the system and potentially lowering the likelihood of large earthquakes.This use of electromagnetic imaging has produced one of the first high-resolution images of a feature on the down-going slab that directly links the release of fluids to the type and size of earthquakes.

A range of factors dictate the probable location and magnitude of earthquakes2. One such factor is the frictional properties of the interface between the plates. Fluids that are carried into Earth by the down-going plate can reduce the force of friction if they increase the fluid pressure in the fault zone. This, in turn, could decrease the likelihood of large earthquakes3. Alternatively, if the sea floor of the down-going plate is rough, because of features such as seamounts, this might produce areas of higher friction at a fault interface, increasing the likelihood of large earthquakes4.

To investigate this issue, Chesley et al. carried out electromagnetic imaging of the subduction zone in New Zealand. The technology uses either artificial or naturally occurring electric and magnetic fields to determine the degree to which geological features in Earth’s interior are electrically conductive or resistive. The method is particularly sensitive to the presence of interconnected fluids.

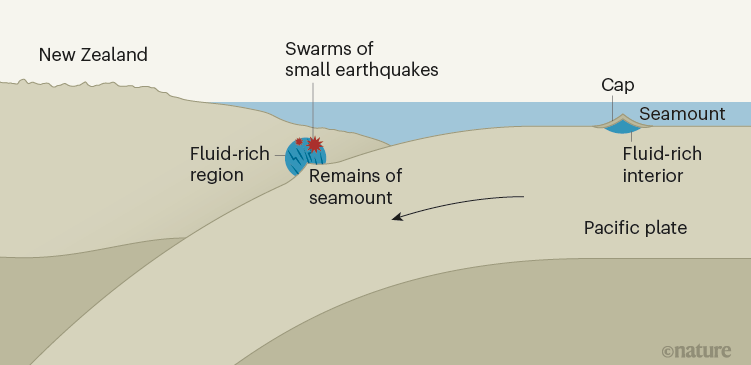
The authors produced high-resolution images of a seamount on a section of the Pacific plate that is about to be subducted. They observed that the interior of the seamount is highly conductive, but is overlain by a thin, electrically resistive layer of material (Fig. 1). The authors propose that the conductive interior is fluid-rich, and that the resistive layer is fluid-poor, with low porosity. The resistive layer therefore acts as a cap, limiting the release of fluids from the deeper conductive region until the plate reaches greater depths.


Figure 1 | Evidence that a seamount has altered seismic behaviour beneath New Zealand. The oceanic tectonic plate known as the Pacific plate descends (subducts) beneath the tectonic plate that supports New Zealand. Chesley et al.1 report electromagnetic imaging of a seamount — an extinct underwater volcano — on part of the Pacific plate that is about to subduct, and find that it has a fluid-rich interior capped by a thin, low-porosity layer of material. The authors also observed the remains of a seamount at the interface between the Pacific plate and the overlying plate. The region of the overlying plate above the remains is damaged and fluid-rich, and corresponds to an area in which many small earthquakes have been reported. The authors suggest that the subducted seamount damaged the overlying plate and that its cap broke, releasing fluid to the upper plate. The fluids reduced friction between the plates, thereby decreasing the likelihood of large earthquakes, which often occur at subduction zones.

Chesley et al. also imaged an anomalously resistive feature deeper in the subduction zone, on top of the down-going plate. This corresponds to another seamount that had previously been imaged using seismic waves5,6. The anomaly resides beneath a conductive, fluid-rich region of the over-riding plate and is associated with a swarm of overlying small earthquakes (Fig. 1). The authors conclude that the previously observed seamount was the origin of the fluid in the conductive region now observed over the anomaly, and infer that the small earthquakes occur as the fluid moves through the system. So, although the rough topography of seamounts might be expected to increase friction at faults, seamounts can also decrease friction — and the potential for large ‘mega-thrust’ earthquakes — if they damage the upper plate and release fluids.

Some questions remain. How much fluid is left in the subducted seamount, and how much, if any, is carried deeper into the subduction zone? Deeply transported fluids are also important in subduction-zone settings, because they decrease the melting temperature of the mantle, resulting in hazardous volcanism at the surface7.


Determining whether the worst earthquake has passed


More work is required to determine the global role of seamounts in influencing subduction dynamics and earthquake hazard. In some locations, seamounts have been associated with aseismic slip8 (movement on faults that does not cause big earthquakes), whereas in other locations they have been linked to large earthquakes4. One explanation for these divergent effects is that seamounts have different hydration levels and are variably fractured around the world; those that are strong, dry and less fractured produce large earthquakes. If this is correct, then what processes cause seamounts to become hydrated or weak? And what is the relative contribution of factors such as sea-floor characteristics, the age of the plate beneath the volcano and the time elapsed since the seamount was an active volcano?

Another unanswered question is, how much fluid do seamounts contribute to subduction zones, compared with other sources of fluid in down-going plates? For instance, processes that occur near sea-floor features called mid-ocean ridges can add fluids to oceanic plates by altering the mineral composition of the rocks9, or through the formation of faults and associated damaged zones10,11, or both. Moreover, further hydration might occur when a plate is bent and broken as it enters the subduction zone12, or, as Chesley et al. suggest, when a local hotspot generates a volcano that eventually becomes a seamount13. The contributions of these diverse mechanisms could vary with location and time. Further imaging of oceanic plates that formed at different times and rates, and with different degrees and times of emergence of volcanic activity, is now required — in particular, by combining electromagnetic and seismic imaging techniques, which have complementary sensitivities to the properties of Earth’s interior.

Nature 595, 178-179 (2021)

doi: https://doi.org/10.1038/d41586-021-01703-7


References

1.

Chesley, C., Naif, S., Key, K. & Bassett, D. Nature 595, 255–260 (2021).

Article Google Scholar
2.

Peng, Z. & Gomberg, J. Nature Geosci. 3, 599–607 (2010).

Article Google Scholar
3.

King Hubbert, M. & Rubey, W. W. Geol. Soc. Am. Bull. 70, 115–205 (1959).

Article Google Scholar
4.

Cloos, M. Geology 20, 601–604 (1992).

Article Google Scholar
5.

Arai, R. et al. J. Geophys. Res. Solid Earth 125, e2020JB020433 (2020).

Article Google Scholar
6.

Bell, R. et al. Geophys. J. Int. 180, 34–48 (2010).

Article Google Scholar
7.

Stern, R. L. Rev. Geophys. 40, 3 (2002).

Article Google Scholar
8.

Bonnet, G., Agard, P., Angiboust, S., Fournier, M. & Omrani, J. Geology 47, 407–410 (2019).

Article Google Scholar
9.

Bach, W. & Früh-Green, G. L. Elements 6, 173–178 (2010).

Article Google Scholar
10.

Cooper, G. F. et al. Nature 582, 525–529 (2020).

PubMed Article Google Scholar
11.

Davy, R. G., Collier, J. S., Henstock, T. J. & the VoiLA Consortium. J. Geophys. Res. Solid Earth 125, e2019JB019100 (2020).

Article Google Scholar
12.

Ranero, C. R., Morgan, J. P., McIntosh, K. & Reichert, C. Nature 425, 367–373 (2003).

PubMed Article Google Scholar
13.

Park, J. & Rye, D. M. Geochem. Geophys. Geosyst. 20, 4779–4809 (2019).

Article Google Scholar

Download references

COMPETING INTERESTS

The authors declare no competing interests.
The day the Island shook: Vancouver Island rocked by earthquake 75 years ago today
SCOTT STANFIELD
Jun. 23, 2021 
The 1946 earthquake severely damaged Comox Road. Photo donated by the late Eileen Turnbull, former Town of Comox clerk and council member. Courtesy of Comox Archives & Museum
Damage to a house on Anderton Road in Comox following the 1946 earthquake. Photo donated by the late Eileen Turnbull, former Town of Comox clerk and council member. Courtesy of Comox Archives & Museum
Courtenay Elementary sustained a hole in the roof. Courtesy Courtenay and District Museum, 990.25.5
        
Classroom damage in 1946. Courtesy Courtenay and District Museum, 972.54.2


The post office building was also damaged in the 1946 earthquake. Courtesy Courtenay and District Museum, 967.13.42
 
Many chimneys were damaged. Courtesy Courtenay and District Museum, 967.13.44Next


On June 23, 1946, Vancouver Island was rocked by an earthquake that emanated from Forbidden Plateau, and could be felt from Prince Rupert to Portland, Ore.

The quake registered 7.3 on the Richter scale.

According to the Courtenay Museum, the shaking knocked down 75 per cent of the chimneys in Cumberland, Union Bay and Courtenay, damaged buildings in Comox, Port Alberni and Powell River, and even caused some damage in Washington State. Two deaths were attributed to the earthquake: a man who drowned when his boat was swamped by a wave near Deep Bay, and a Seattle man who suffered a heart attack.


“This particular earthquake happened in the crust, and it was fairly big. This would have surprised a lot of people. It was unprecedented for that time,” said Joseph Farrugia, a seismologist at Natural Resources Canada. “If something happened like this today, not much would be different in terms of ground shaking.”

Farrugia would expect that structures not built to current codes would sustain repeated damage in terms of knocked down chimneys and foundation issues.

Though it occurred 75 years ago, the 1946 earthquake can serve as a reminder to prepare for a disaster — which can strike at any time.

“That’s the reality,” said Paul Berry, president of Comox Valley Search and Rescue, and director of health and safety at Comox Valley Schools. “Everything that we know currently is that we’re due. Could be tomorrow, it could be years from now. There’s not usually any warning. When it strikes, it means that people need to be prepared in advance.”

Berry said most local schools have been seismically upgraded. All schools have a site emergency preparedness committee, and resources for people to care for themselves post-earthquake.

In the event of a large-scale earthquake on the West Coast, Berry said it would take several days for federal resources to arrive.

“We know from examples we’ve seen, even in countries that are well prepared, how communities are overwhelmed immediately,” he said. “The majority of rescues, post-disaster, are completed within the first 12-24 hours — not by trained responders, they’re conducted by neighbours and friends.”

Because emergency services would be tied up, schools have supplies on hand to look after the facility, to conduct a cursory inspection and keep people out of harm’s way.

Farrugia said an earthquake kit can cover a person for any natural disaster. Having a minimum of 72 hours’ worth of provisions is recommended.

For more information, visit Prepared BC: bit.ly/3gRhFr7

“They really want you to cover all your bases,” Farrugia said. “I think having a plan is probably the biggest asset, so that you can account for different situations you might find yourself in.”

The third Thursday of October is International ShakeOut Day (https://www.shakeoutbc.ca/) which teaches the public to drop, cover and hold on.

“That’s the best thing you can do,” Farrugia added. “The number one cause of death in earthquakes is things falling on people, things off shelves.”

For more news from Vancouver Island and beyond delivered daily into your inbox, please click here.

RELATED: Vancouver Island overdue for the big one, can also expect mega-thrust tsunami

RELATED: Real-life tsunami threat in Port Alberni prompts evacuation updates